This week marks article #5 in my series on redistricting possibilities across Florida. Each week I will look at an area of Florida and hypothesize how the maps may turn out.
Series Explainer
The goal of this series is to take a look at different areas in Florida and see how the legislative lines may end up. These articles will focus on how lawmakers may draw districts to accommodate changing populations. I will talk about different areas, what mandates (namely minority representation) they have, and what might need to happen due to population changes. I will also, at times, examine what efforts to gerrymander a region will look like. After the 2012 gerrymandering was discovered by a Florida Court, I believe it is appropriate to treat legislative intent with some healthy skepticism. “Fair maps” can – at times – be in the eye of the beholder, but the goal will be to identify what would likely be partisan decisions by lawmakers.
I highly recommending reading my History of Florida Redistricting series – as many mandates and norms we have in our maps are a product of that history. Prerequisite reading is absolutely my 2022 Primer Article – which covers which districts are under-populated and what the racial benchmarks are.
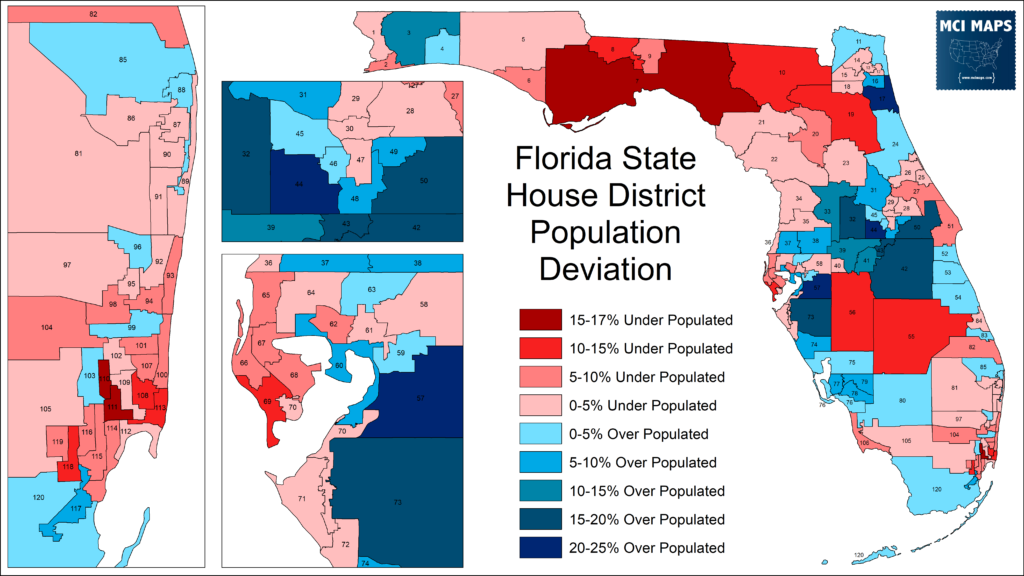
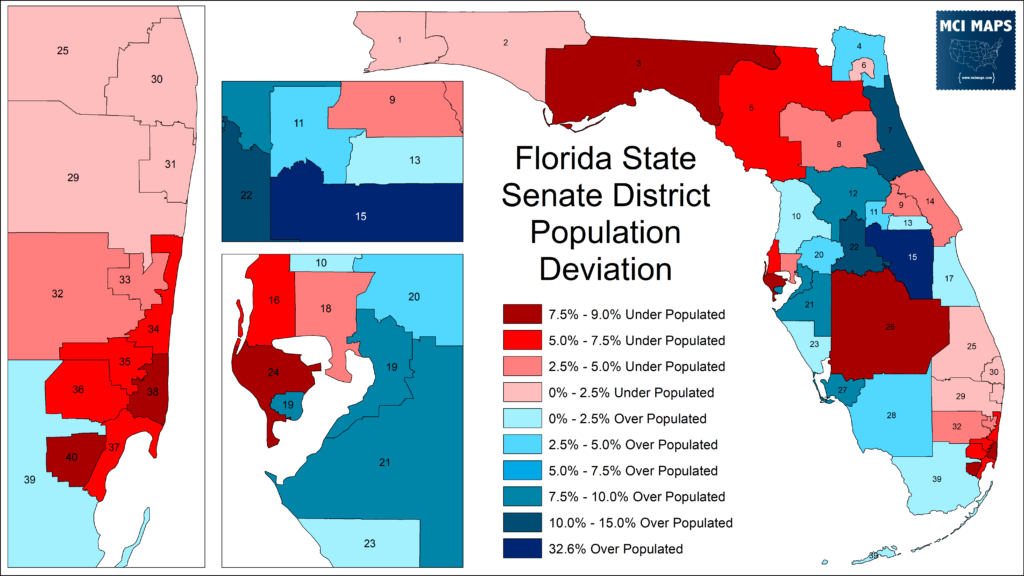
The full spreadsheet of district stats – including population and racial makeup – can be found here.
An important glossary to remember:
- BVAP = Black Voting-Age population
- HVAP = Hispanic Voting-Age Population
- Functional Analysis = using political turnout data to confirm minority performance in a district. Utilizing both general election and primary election performance for parties and racial groups.
Lets continue this series by looking at Tampa Bay state senate!
Update! State Senate Maps Out
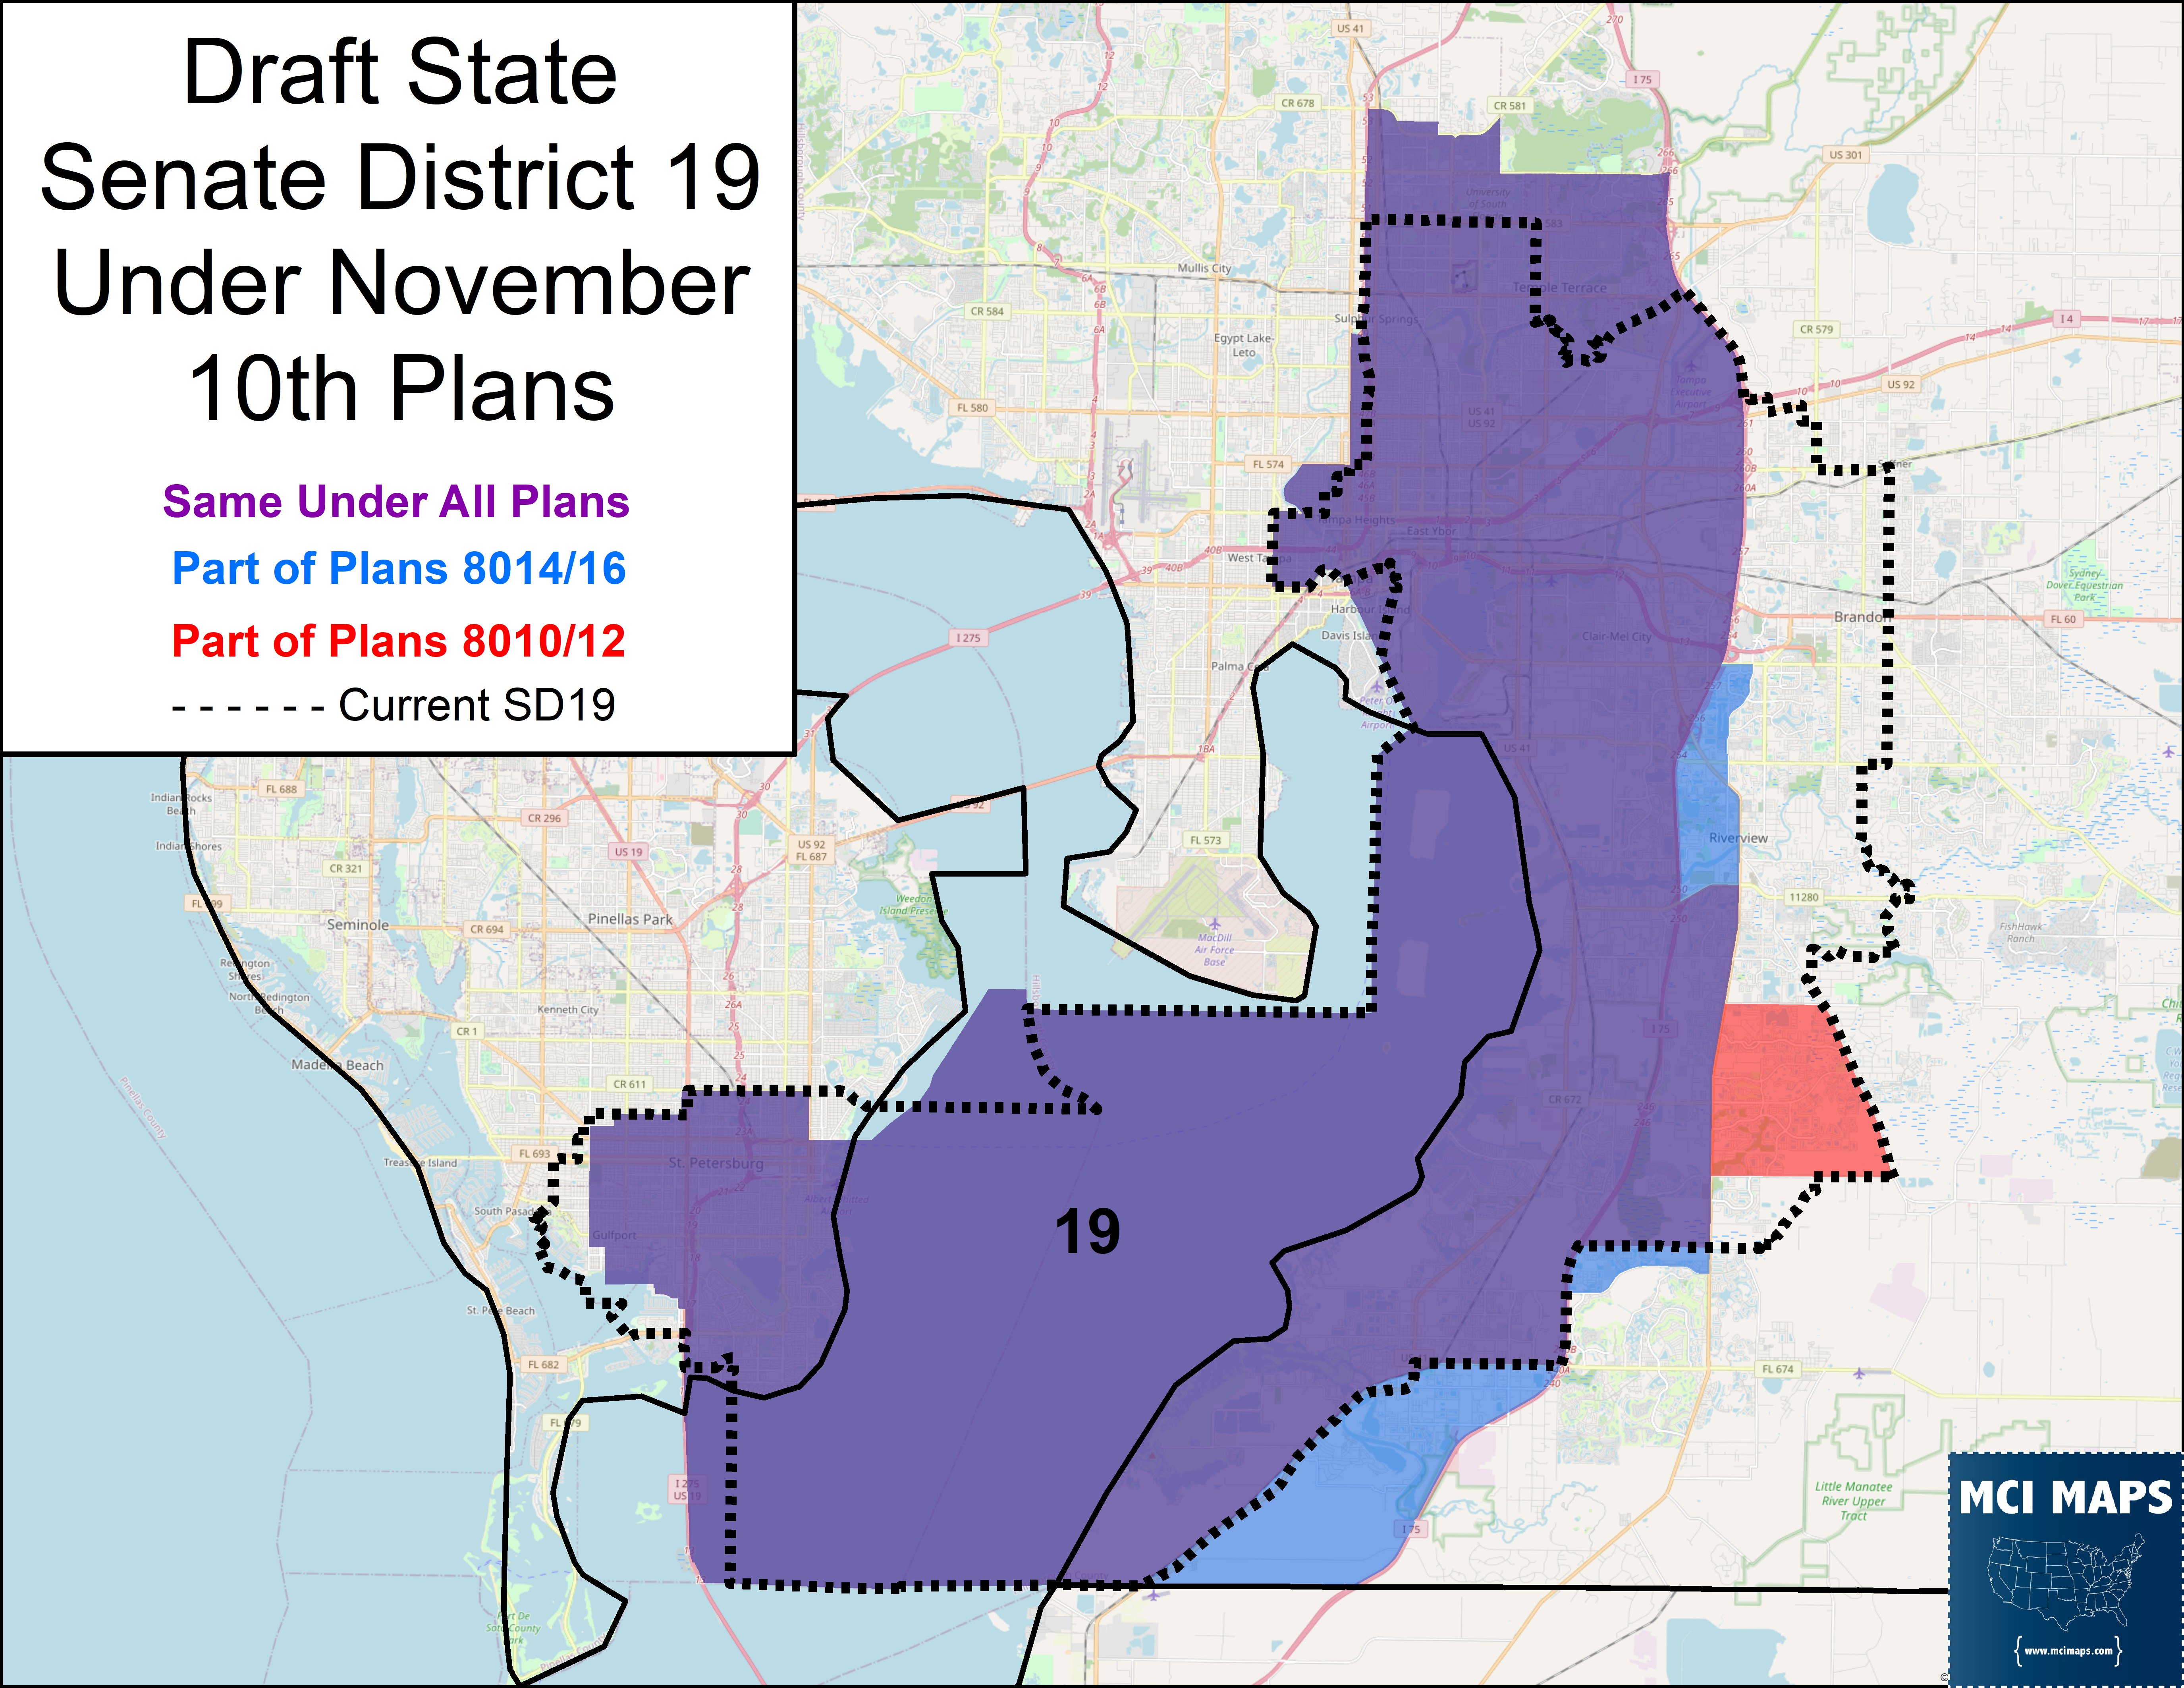
On November 10th, we got our first set of draft maps from the legislature. The Florida Senate’s Redistricting Committee released FOUR state senate maps. All four plans have similar makeups and only have a few differences.
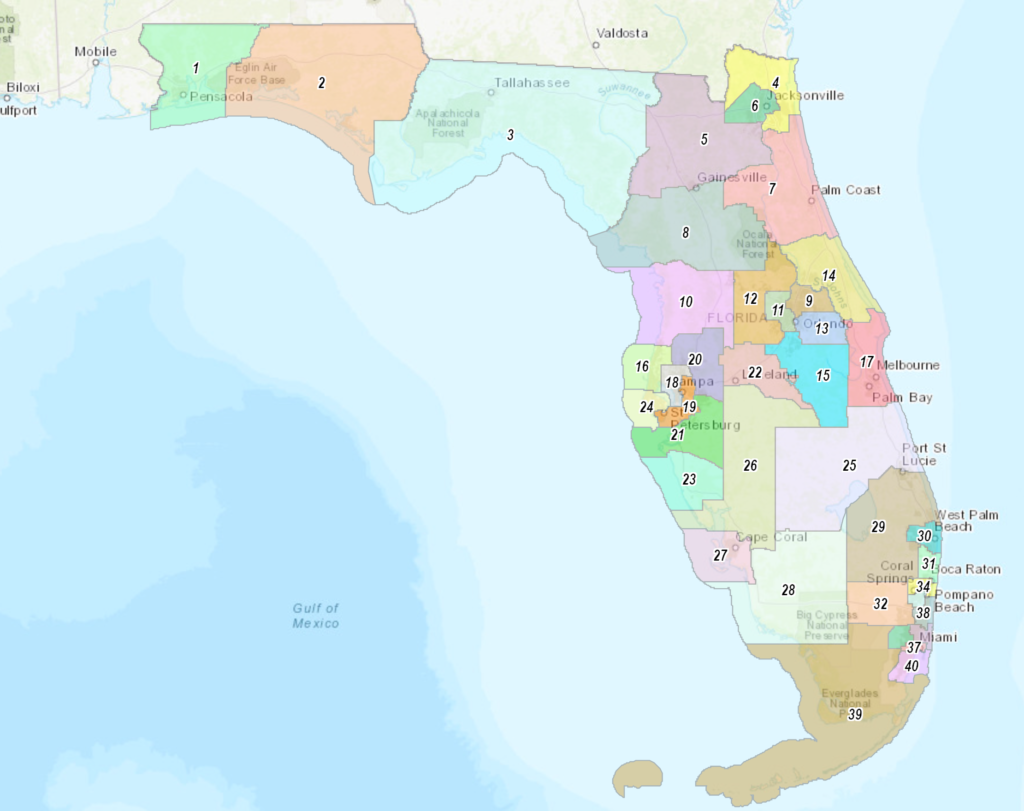
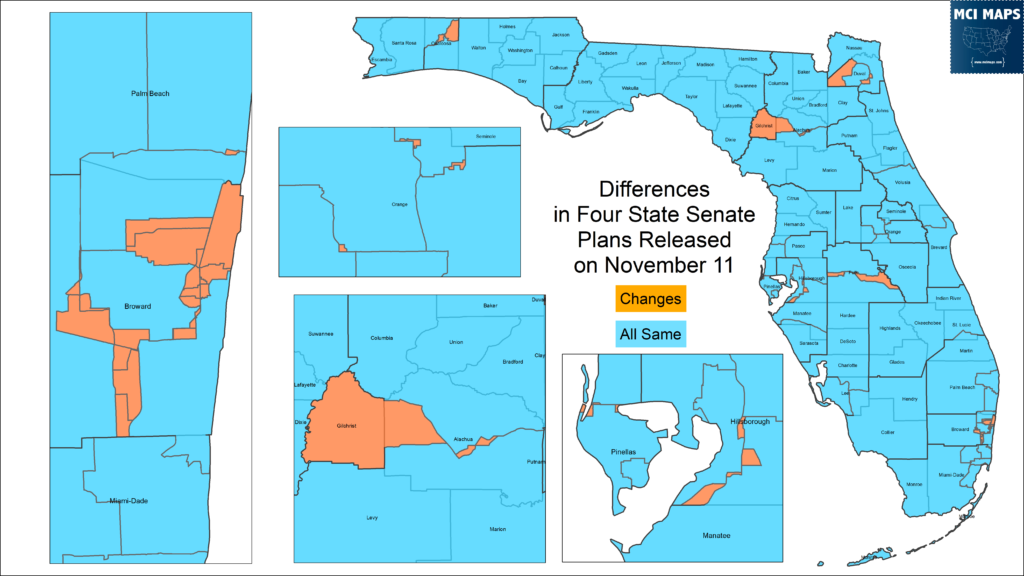
You can see all four plans here, and see my quick-look write-up in my latest substack article.
I recommend clicking those links for more details. Long story short, these are not terrible maps. They are not aggressive gerrymanders. I’d argue the State Senate map has some more “questionable” decisions than Congress, but the state senate plans still have a fairly balanced partisan impact. The plans are all 23 Trump Districts, 17 Biden districts.
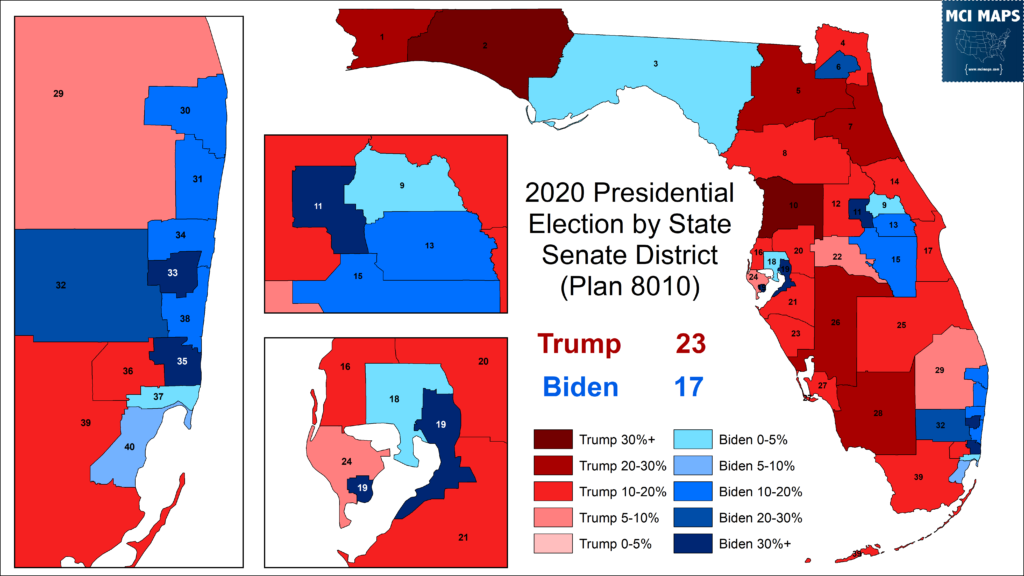
For context, the current Senate plan is 22 Trump, 18 Biden.
As I said, there are some questionable decisions in the map. This article will talk about one of those issues – the Tampa Bay!
The Tampa Bay State Senate Plan
The History of Crossing the Tampa Bay
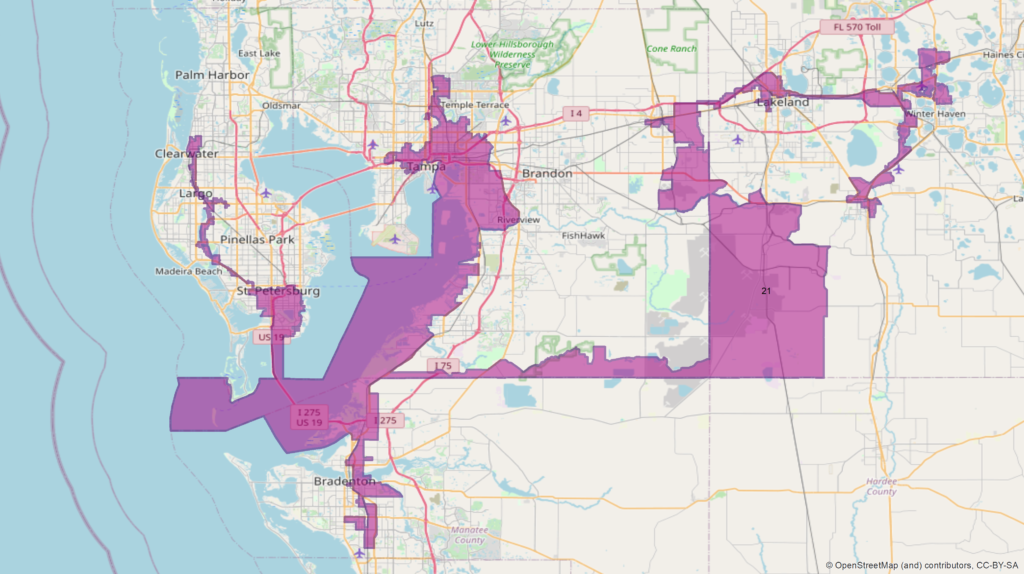
Before we delve into the current State Senate plan, some history is likely in order. For those of you who read my Redistricting History in Florida series – you’d know the Tampa Bay has been a contentious point of debate since the 1990s. In 1992, a large debate emerged over drawing a State Senate district that would give African-Americans an opportunity to elect a candidate of their choice.
The legislature passed a plan that did not aim to create a minority district in Tampa Bay. As a result, the Department of Justice refused to sign-off on the plan. The Supreme Court of Florida would eventually offer a district that was drawn to elect an African-American.
This district was 45% black voting-age population. It would be used in 1992 and 1994, but the US Supreme Court began a series of strike-downs of districts like this. In Georgia v Miller, the court commented on “a reapportionment plan may be so highly irregular and bizarre in shape that it rationally cannot be understood as anything other than an effort to segregate voters based on race.” With this and other cases, legislatures moved away from such spider-web-like districts. A new plan was passed for the 1996 elections.
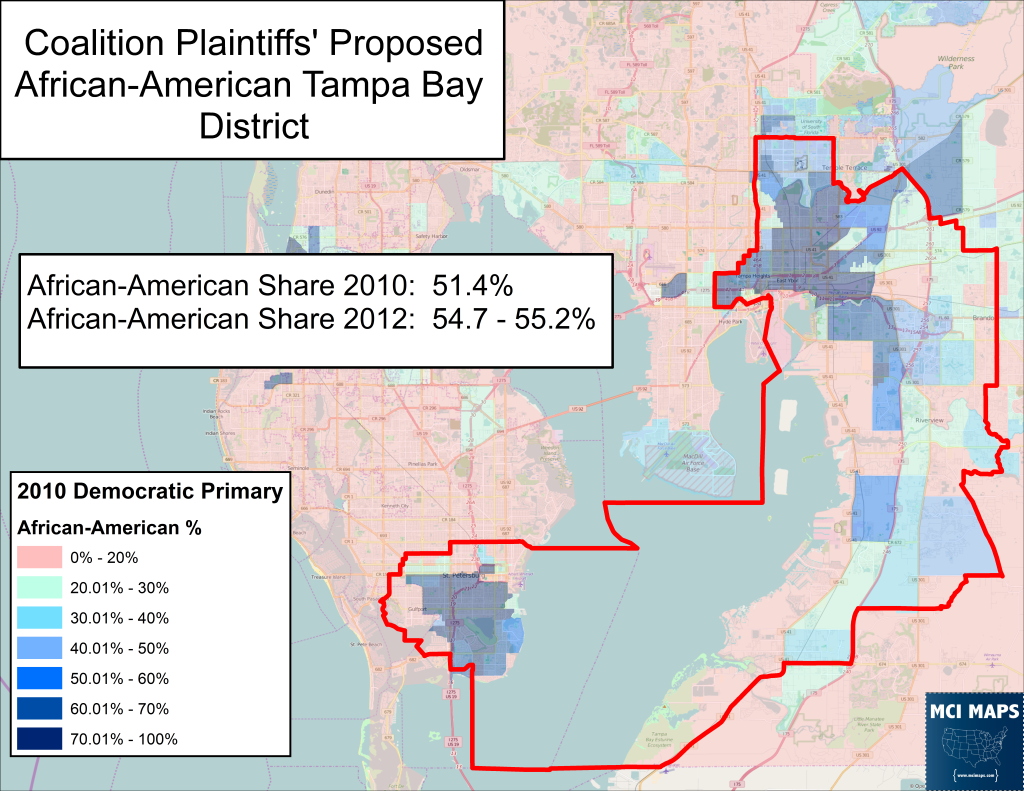
This style would remain through the 1990s and into today. Plans would link the black population of Hillsborough, Pinellas, and Manatee county until the 2015 redistricting process. When the mid-decade State Senate redraw began, the debate largely focused on the legislature desiring a Hillsborough to Pinellas plan, while the League of Women Voters and other orgs favored a Hillsborough-only African-American district.
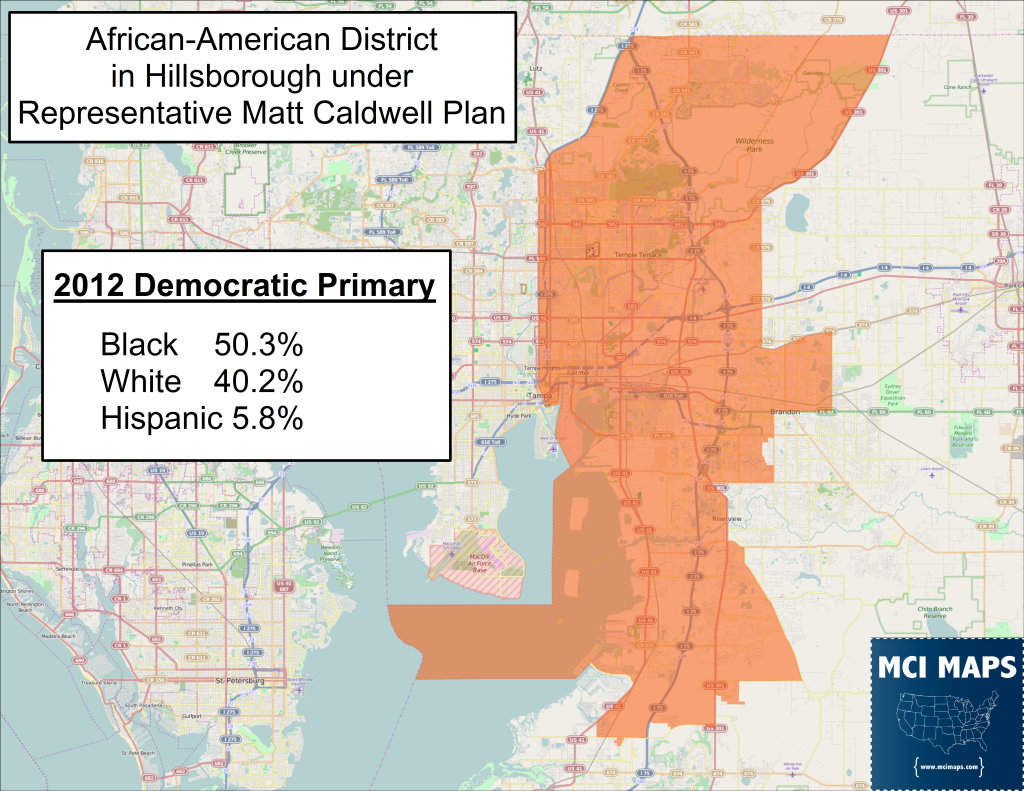
The 2015 redistricting saw a great deal of debate over what by-then was SD19. The legislature argued crossing the Tampa Bay water was still needed to create a functional African-American district. The big issue being the partisan makeup of the Democratic primary. Post-2012 turnout data showed that a Hillsborough-only district could be drawn. In fact, a plan from Republican State Rep Matt Caldwell did precisely this.
The issue would eventually fade as the coalition plaintiffs and the legislature all agreed to continue a Hillsborough to Pinellas district. The plan would also grab a chunk of white Democrats in Pinellas.
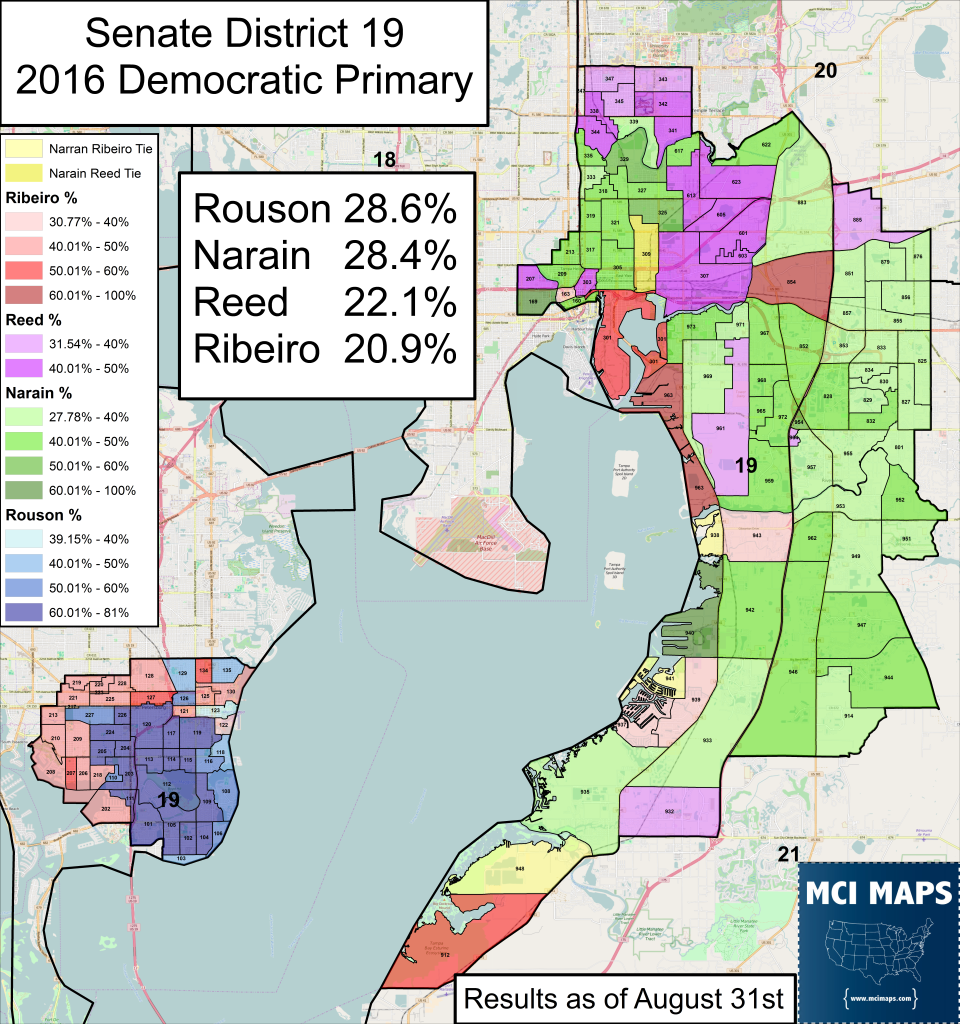
Later that same year, the newly-drawn SD19 would have a contentious Democratic primary that pit three African-American elected officials against a white self-funder (who came in last).
So with a new census and more election data – the question became – would the Tampa Bay lines keep crossing the water?
For the legislature, the answer is clearly yes.
Tampa Bay Senate Plans
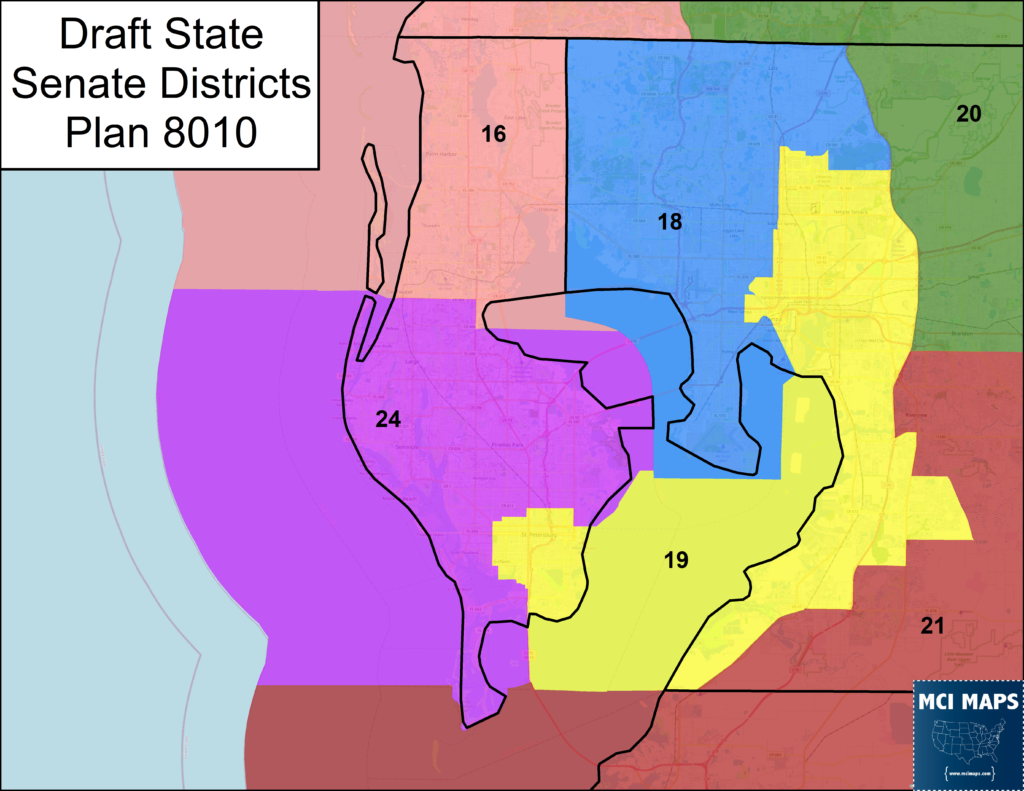
All four State Senate plans are very similar when it comes to the Tampa Bay area. The plans largely preserve the layout of districts 16, 18, 19, and 24 compared to the current map.
Two of the four plans offer different borders for SD19 – specifically in the area on the border with SD21. These differences are small and don’t move racial makeup that much.
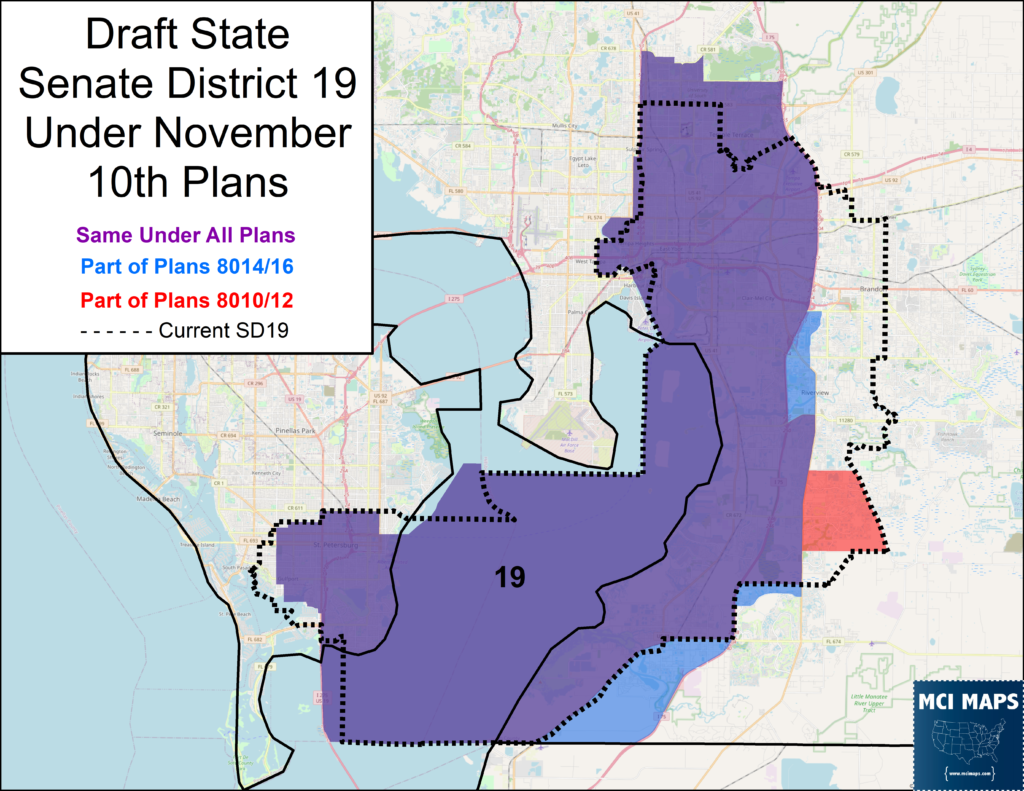
The plans hover around 34% Black VAP, 40% White VAP, 22% Hispanic VAP.
The Democratic primary makeup is the important point here – and is what determines if the seat is an African-American district or not. The seat will be solidly Democratic – with the primary winner being a lock for the general. Well the plan released by staff has a 2020 Democratic primary right around 50% African-American.
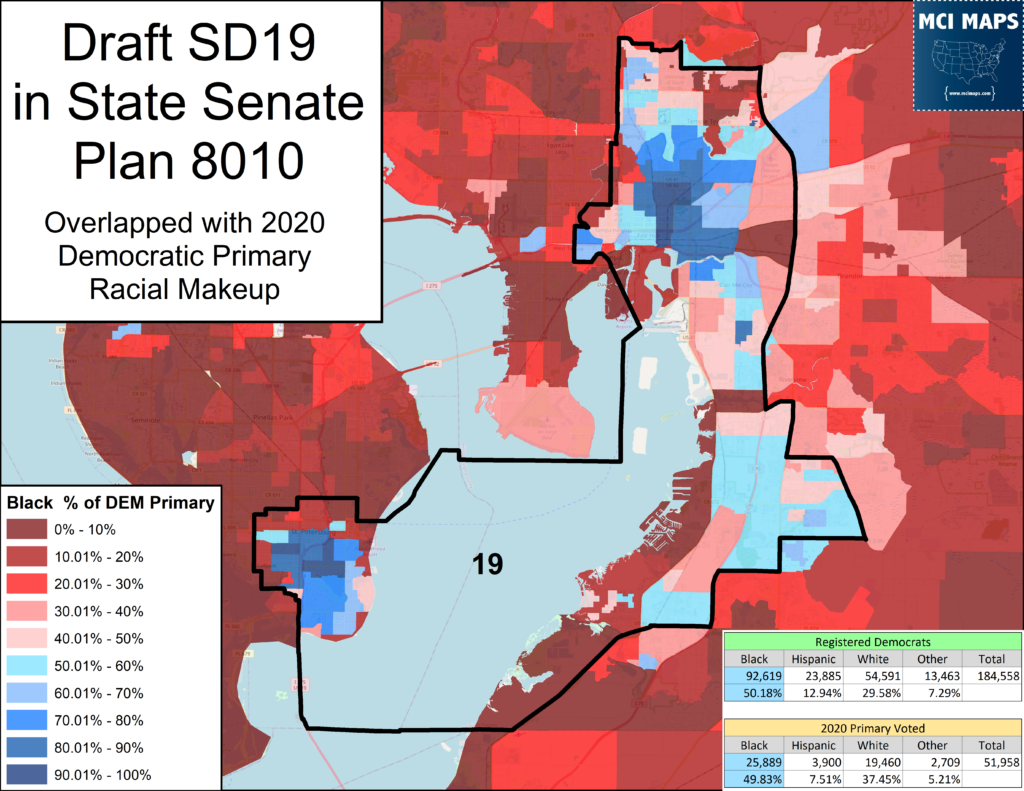
African-Americans make up up either a majority or high plurality of the districts primaries – depending on turnout.
Biggest issue here is the plan does the same thing the 2015 plans did – it still grabs a ring of white Democrats in Pinellas. As a result, the Pinellas portion of the district was only 49% black, 44% white.
The alternative plans (8014 and 8016) are actually 0.8% less African-American in the 2020 Democratic primary.
My Proposal
At this point, there is no reason for SD19 to keep crossing the Tampa Bay. Doing so does not result in a huge spike in the African-American population.
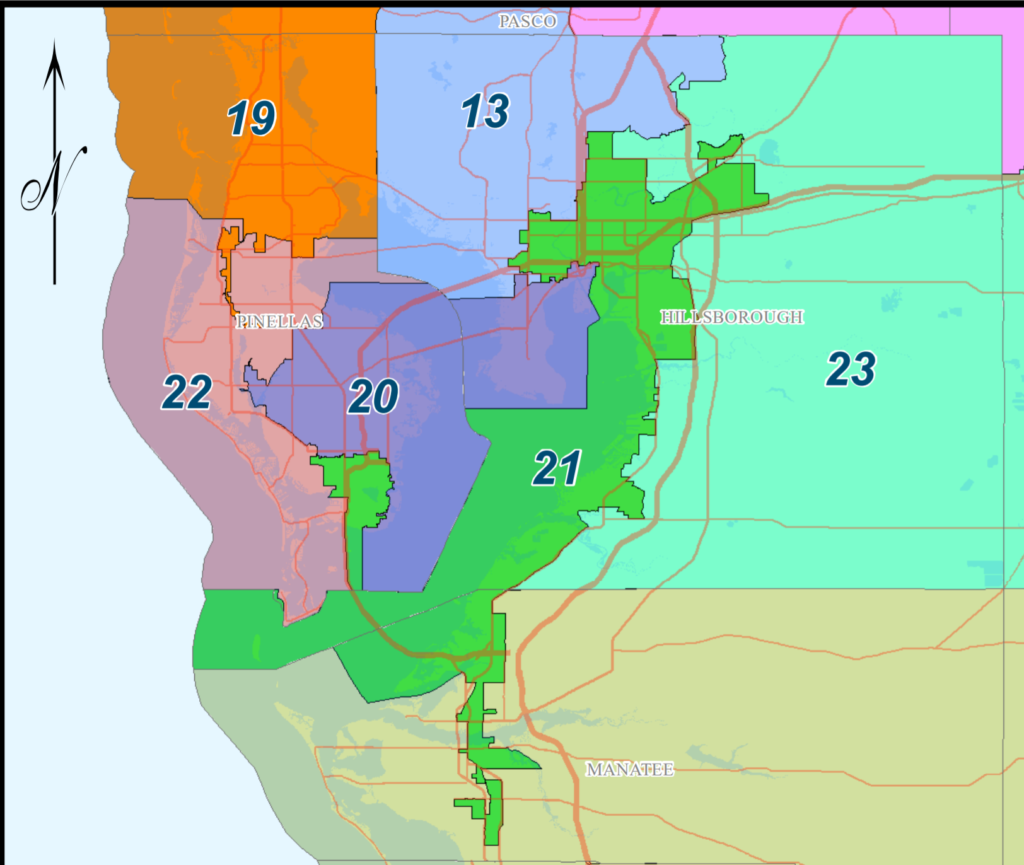
This is a plan I drafted, which puts 19 all on Pinellas and makes SD17 an African-American access district.
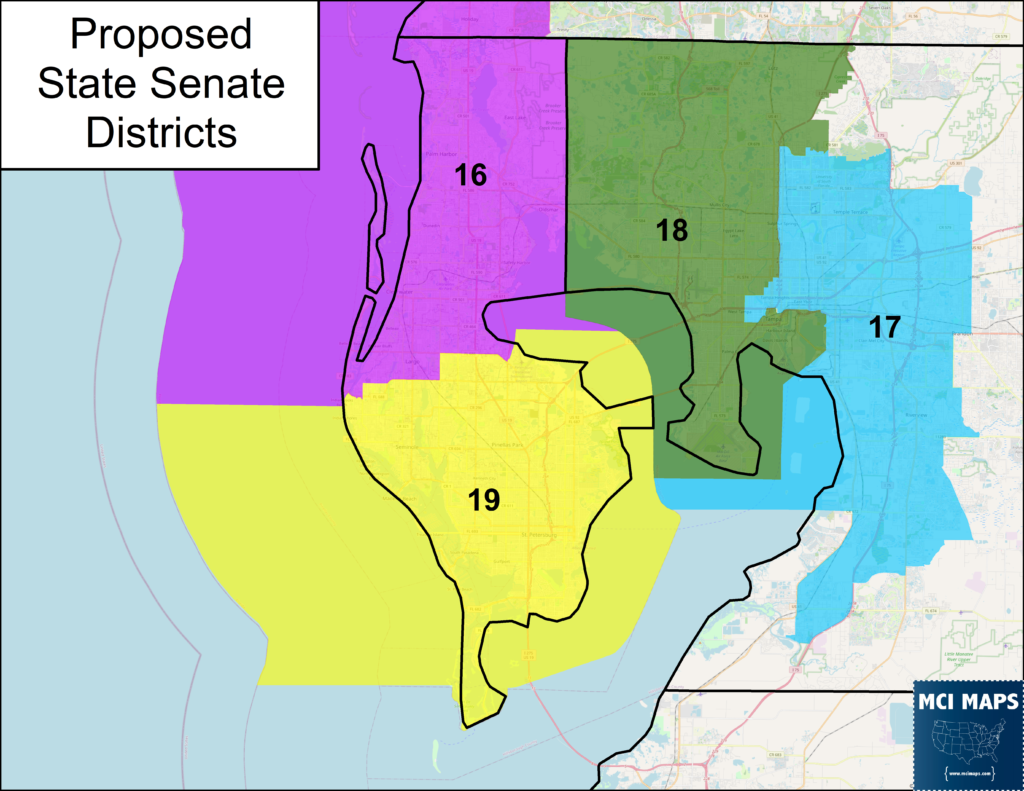
My SD17 would be 31% black VAP, 38% white VAP, and 26% Hispanic VAP.
The district would be just under 51% black in a Democratic primary.
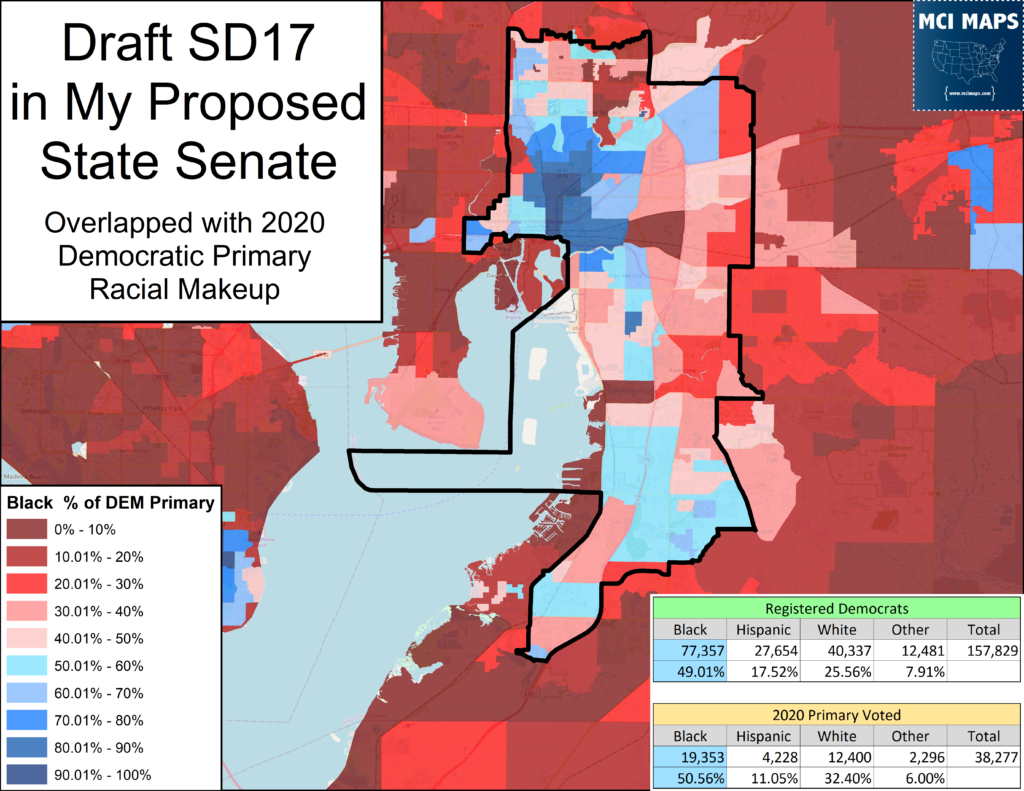
So this plan has a slightly-higher African-American share of the primary electorate than the staff plan; and its done by not crossing the bay.
Crossing the bay is important because it has massive partisan implications. A state senate plan that keeps south Pinellas whole would be a democrat-aligned seat. Crossing the bay prevents that.
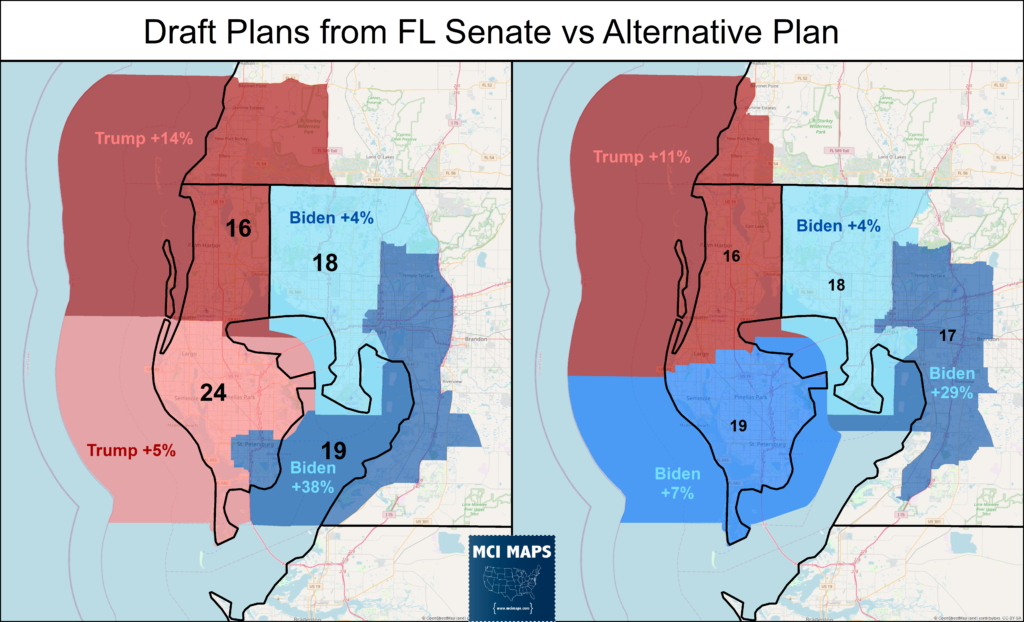
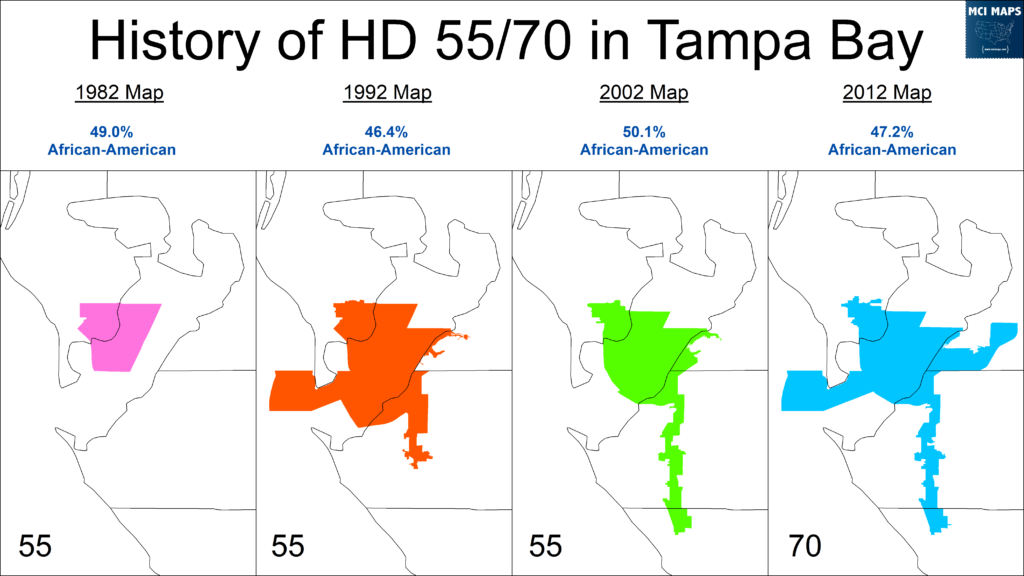
Now, I talked about the justification for crossing waterways in last week’s article – which covered the State House and specifically HD70.
The question here though, is crossing the water anything but a partisan move when doing so doesn’t materially improve minority share of the district. Pre-2012 the demographics said that crossing the bay was needed to create an African-American district. However, that no longer appears to be the case. Just like SD19/21 moved out of Manatee County, it may be ready to move away from crossing water altogether.
If the legislature will insist on counting the bay – then they need to justify it. Otherwise it looks like a pretty clear partisan move.
Looking Ahead
We are now in the period of draft maps for Florida. We should be getting draft maps from the state house down the line, and maps are subject to change as committees meet and debate. This series will continue to respond to maps and keep moving through Florida.
Next up – South Florida!

