This week marks article #3 in my series on redistricting possibilities across Florida. Each week I will look at an area of Florida and hypothesize how the maps may turn out.
Series Explainer
The goal of this series is to take a look at different areas in Florida and see how the legislative lines may end up. These articles will focus on how lawmakers may draw districts to accommodate changing populations. I will talk about different areas, what mandates (namely minority representation) they have, and what might need to happen due to population changes. I will also, at times, examine what efforts to gerrymander a region will look like. After the 2012 gerrymandering was discovered by a Florida Court, I believe it is appropriate to treat legislative intent with some healthy skepticism. “Fair maps” can – at times – be in the eye of the beholder, but the goal will be to identify what would likely be partisan decisions by lawmakers.
I highly recommending reading my History of Florida Redistricting series – as many mandates and norms we have in our maps are a product of that history. Prerequisite reading is absolutely my 2022 Primer Article – which covers which districts are under-populated and what the racial benchmarks are.
The full spreadsheet of district stats – including population and racial makeup – can be found here.
An important glossary to remember:
- BVAP = Black Voting-Age population
- HVAP = Hispanic Voting-Age Population
- Functional Analysis = using political turnout data to confirm minority performance in a district. Utilizing both general election and primary election performance for parties and racial groups.
Lets begin this series by looking at Tampa Bay state house!
Tampa Bay Regional Changes
The Tampa Bay region, which for this article will focus on Hillsborough and Pinellas counties – like much of the state – has grown more diverse with time. Hillsborough county, home to Tampa, is now under 50% white, and is seeing continued growth in the Hispanic population. Pinellas remains heavily white, but continues to diversify as well.
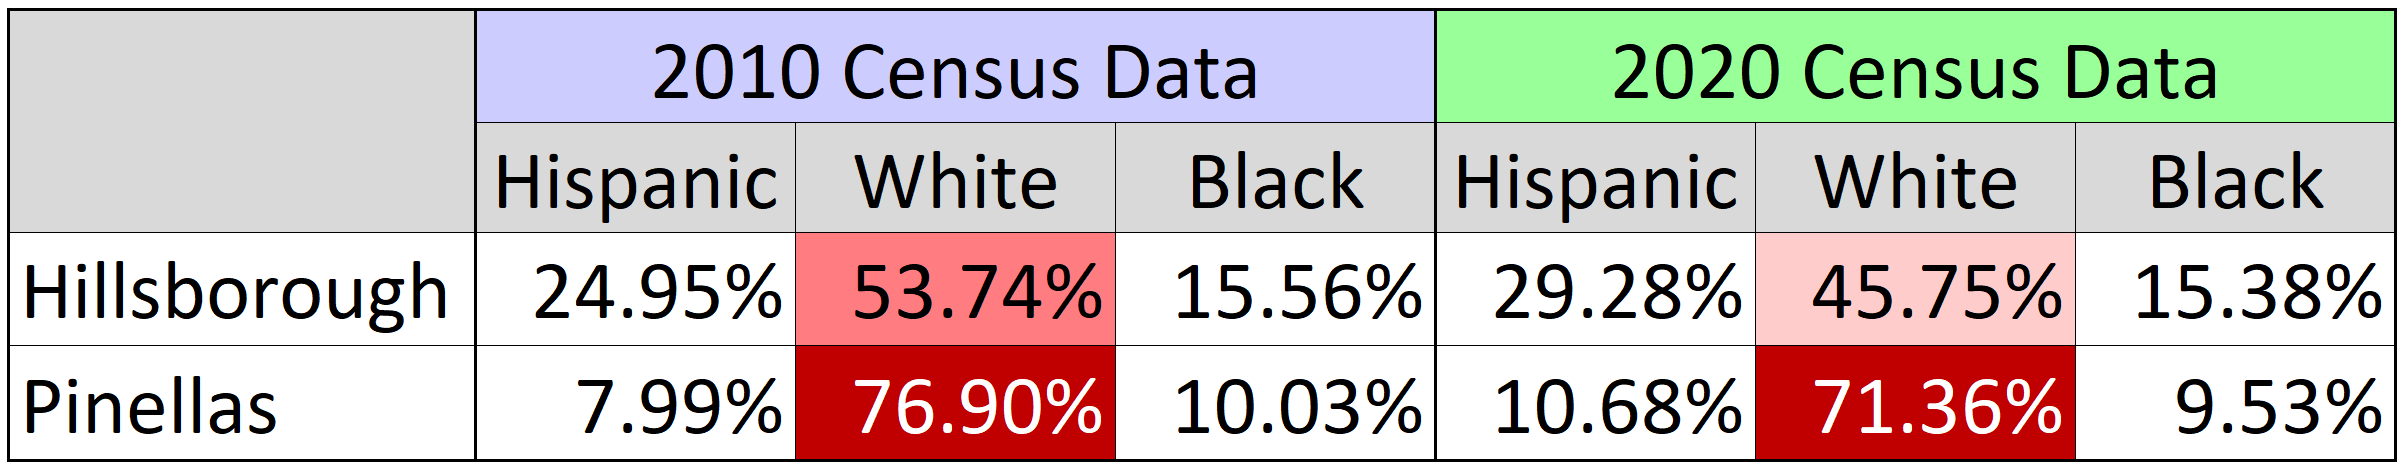
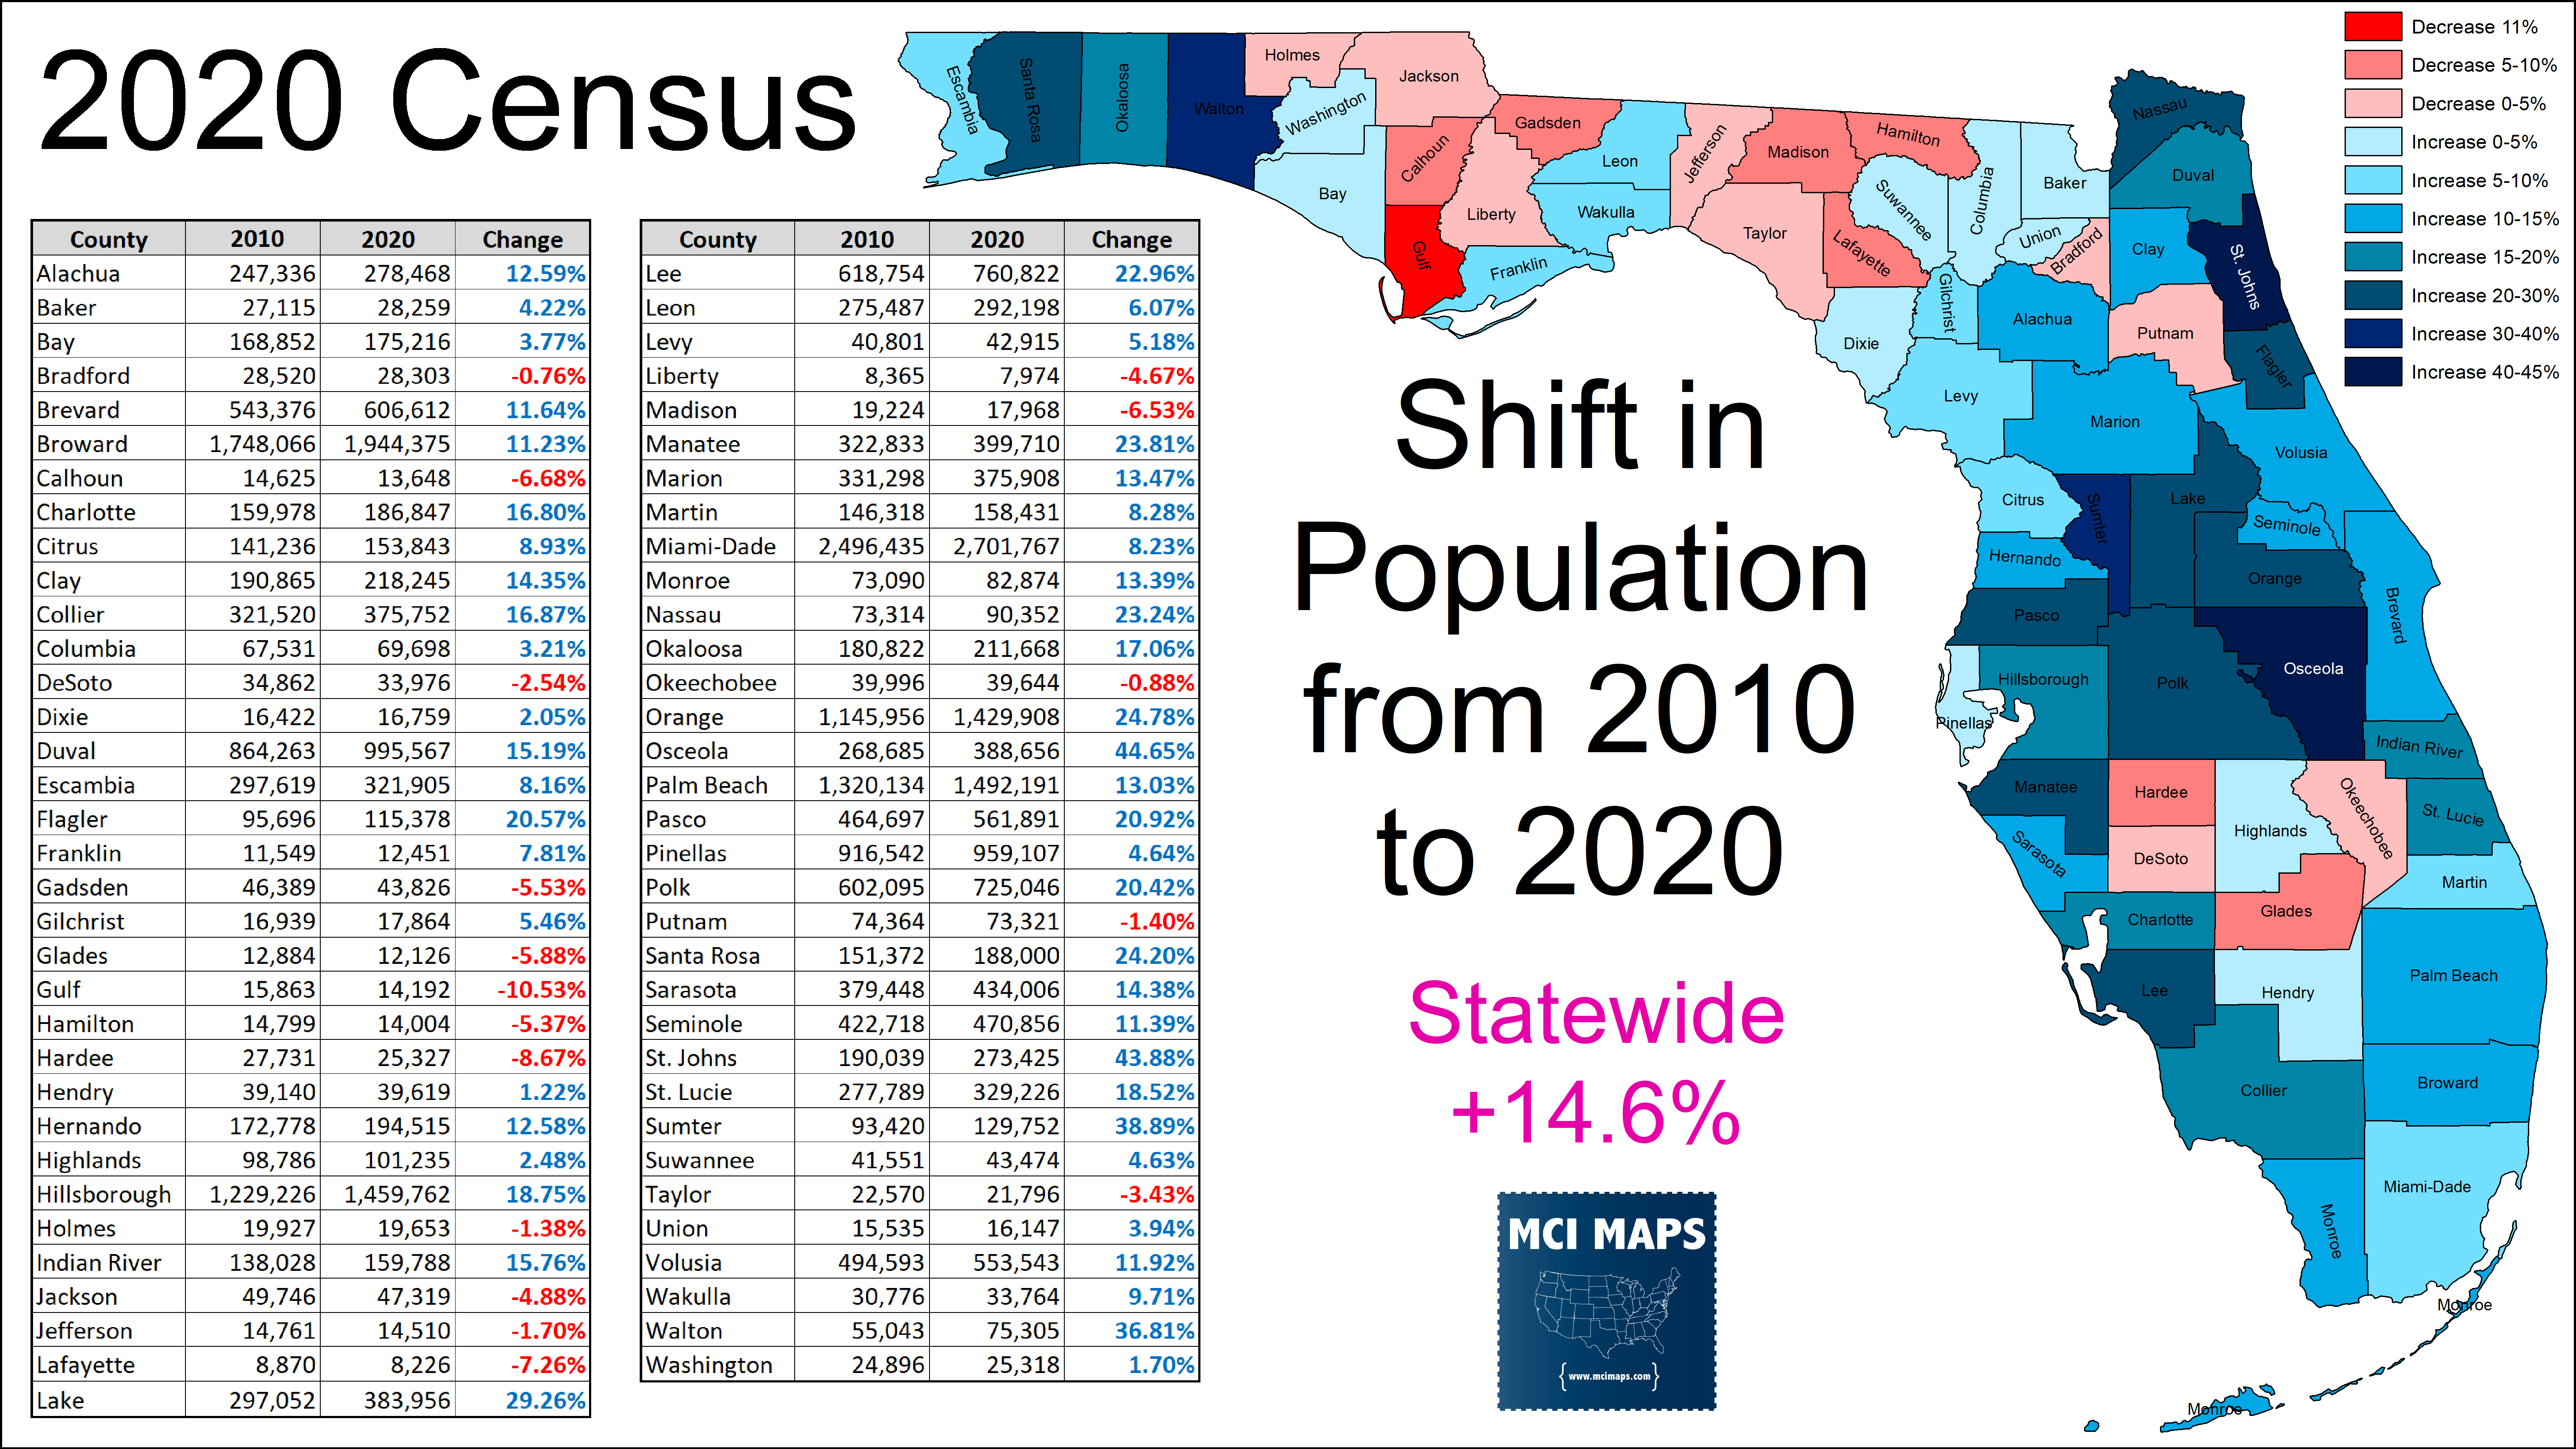
Hillsborough county has continued to experience massive growth, especially in its eastern region – where new subdivisions have been popping up across once-rural communities. Pinellas, meanwhile, has suffered from being largely maxed-out in density. The peninsula cannot really accommodate massive growth, and as a result the county only grew by 4%, far lower than the statewide average. Hillsborough, meanwhile, grew by 19%.
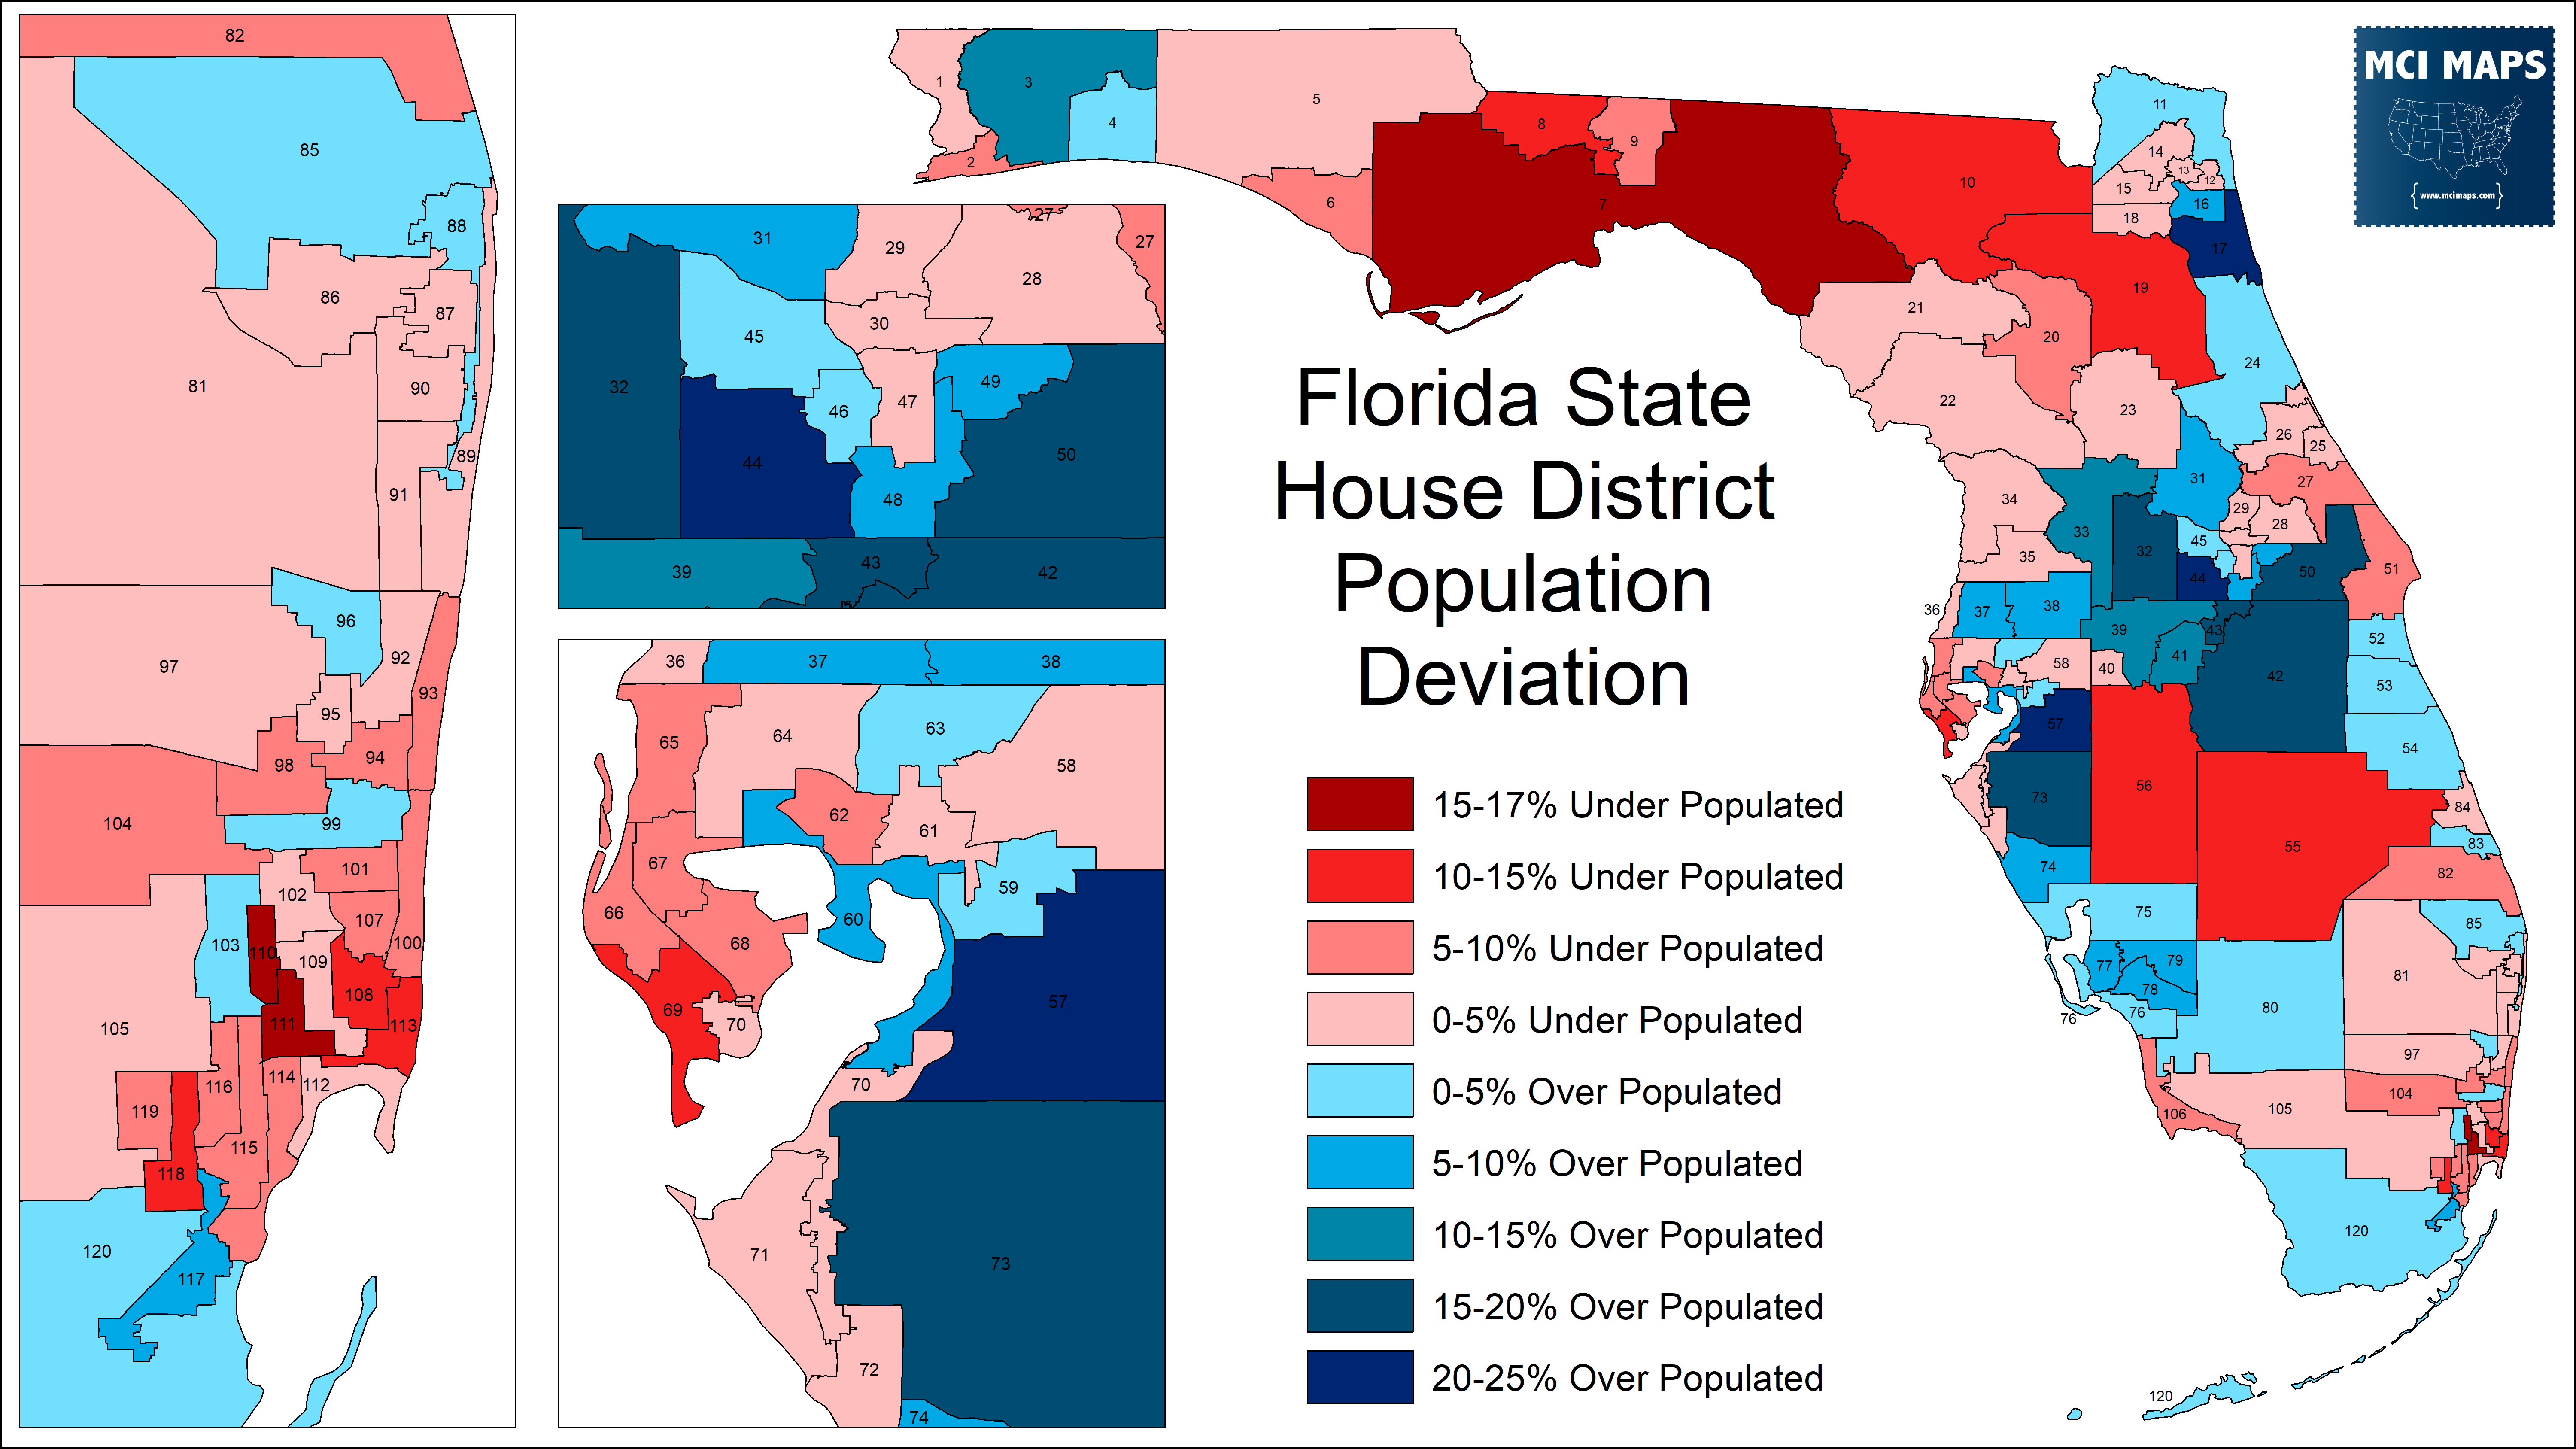
If you look at the state house map in the Series Explainer section, which shows which districts are over or under populated, you see how the Pinellas districts are all underpopulated, while many Hillsborough seats are way overpopulated. In total, Pinellas has lost half a district in terms of what it could hold. Hillsborough, meanwhile, could take on 30% of an additional seat.
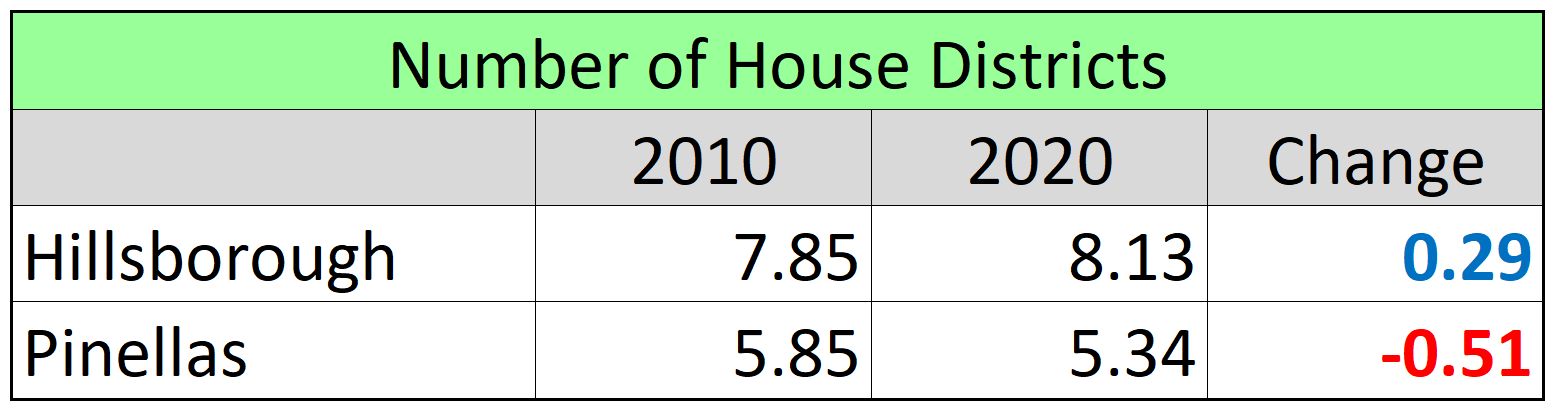
This means the Tampa Bay region will see a weakening in Pinellas influence and an increase in Hillsborough power.
Of all the districts to cover Hillsborough, HD57 had the most growth. The district is 23% overpopulated, the third largest in the state. This growth has been largest along the areas south of Riverview. New, diverse suburbs around I-75 led to a massive swing in the Presidential vote for the district.
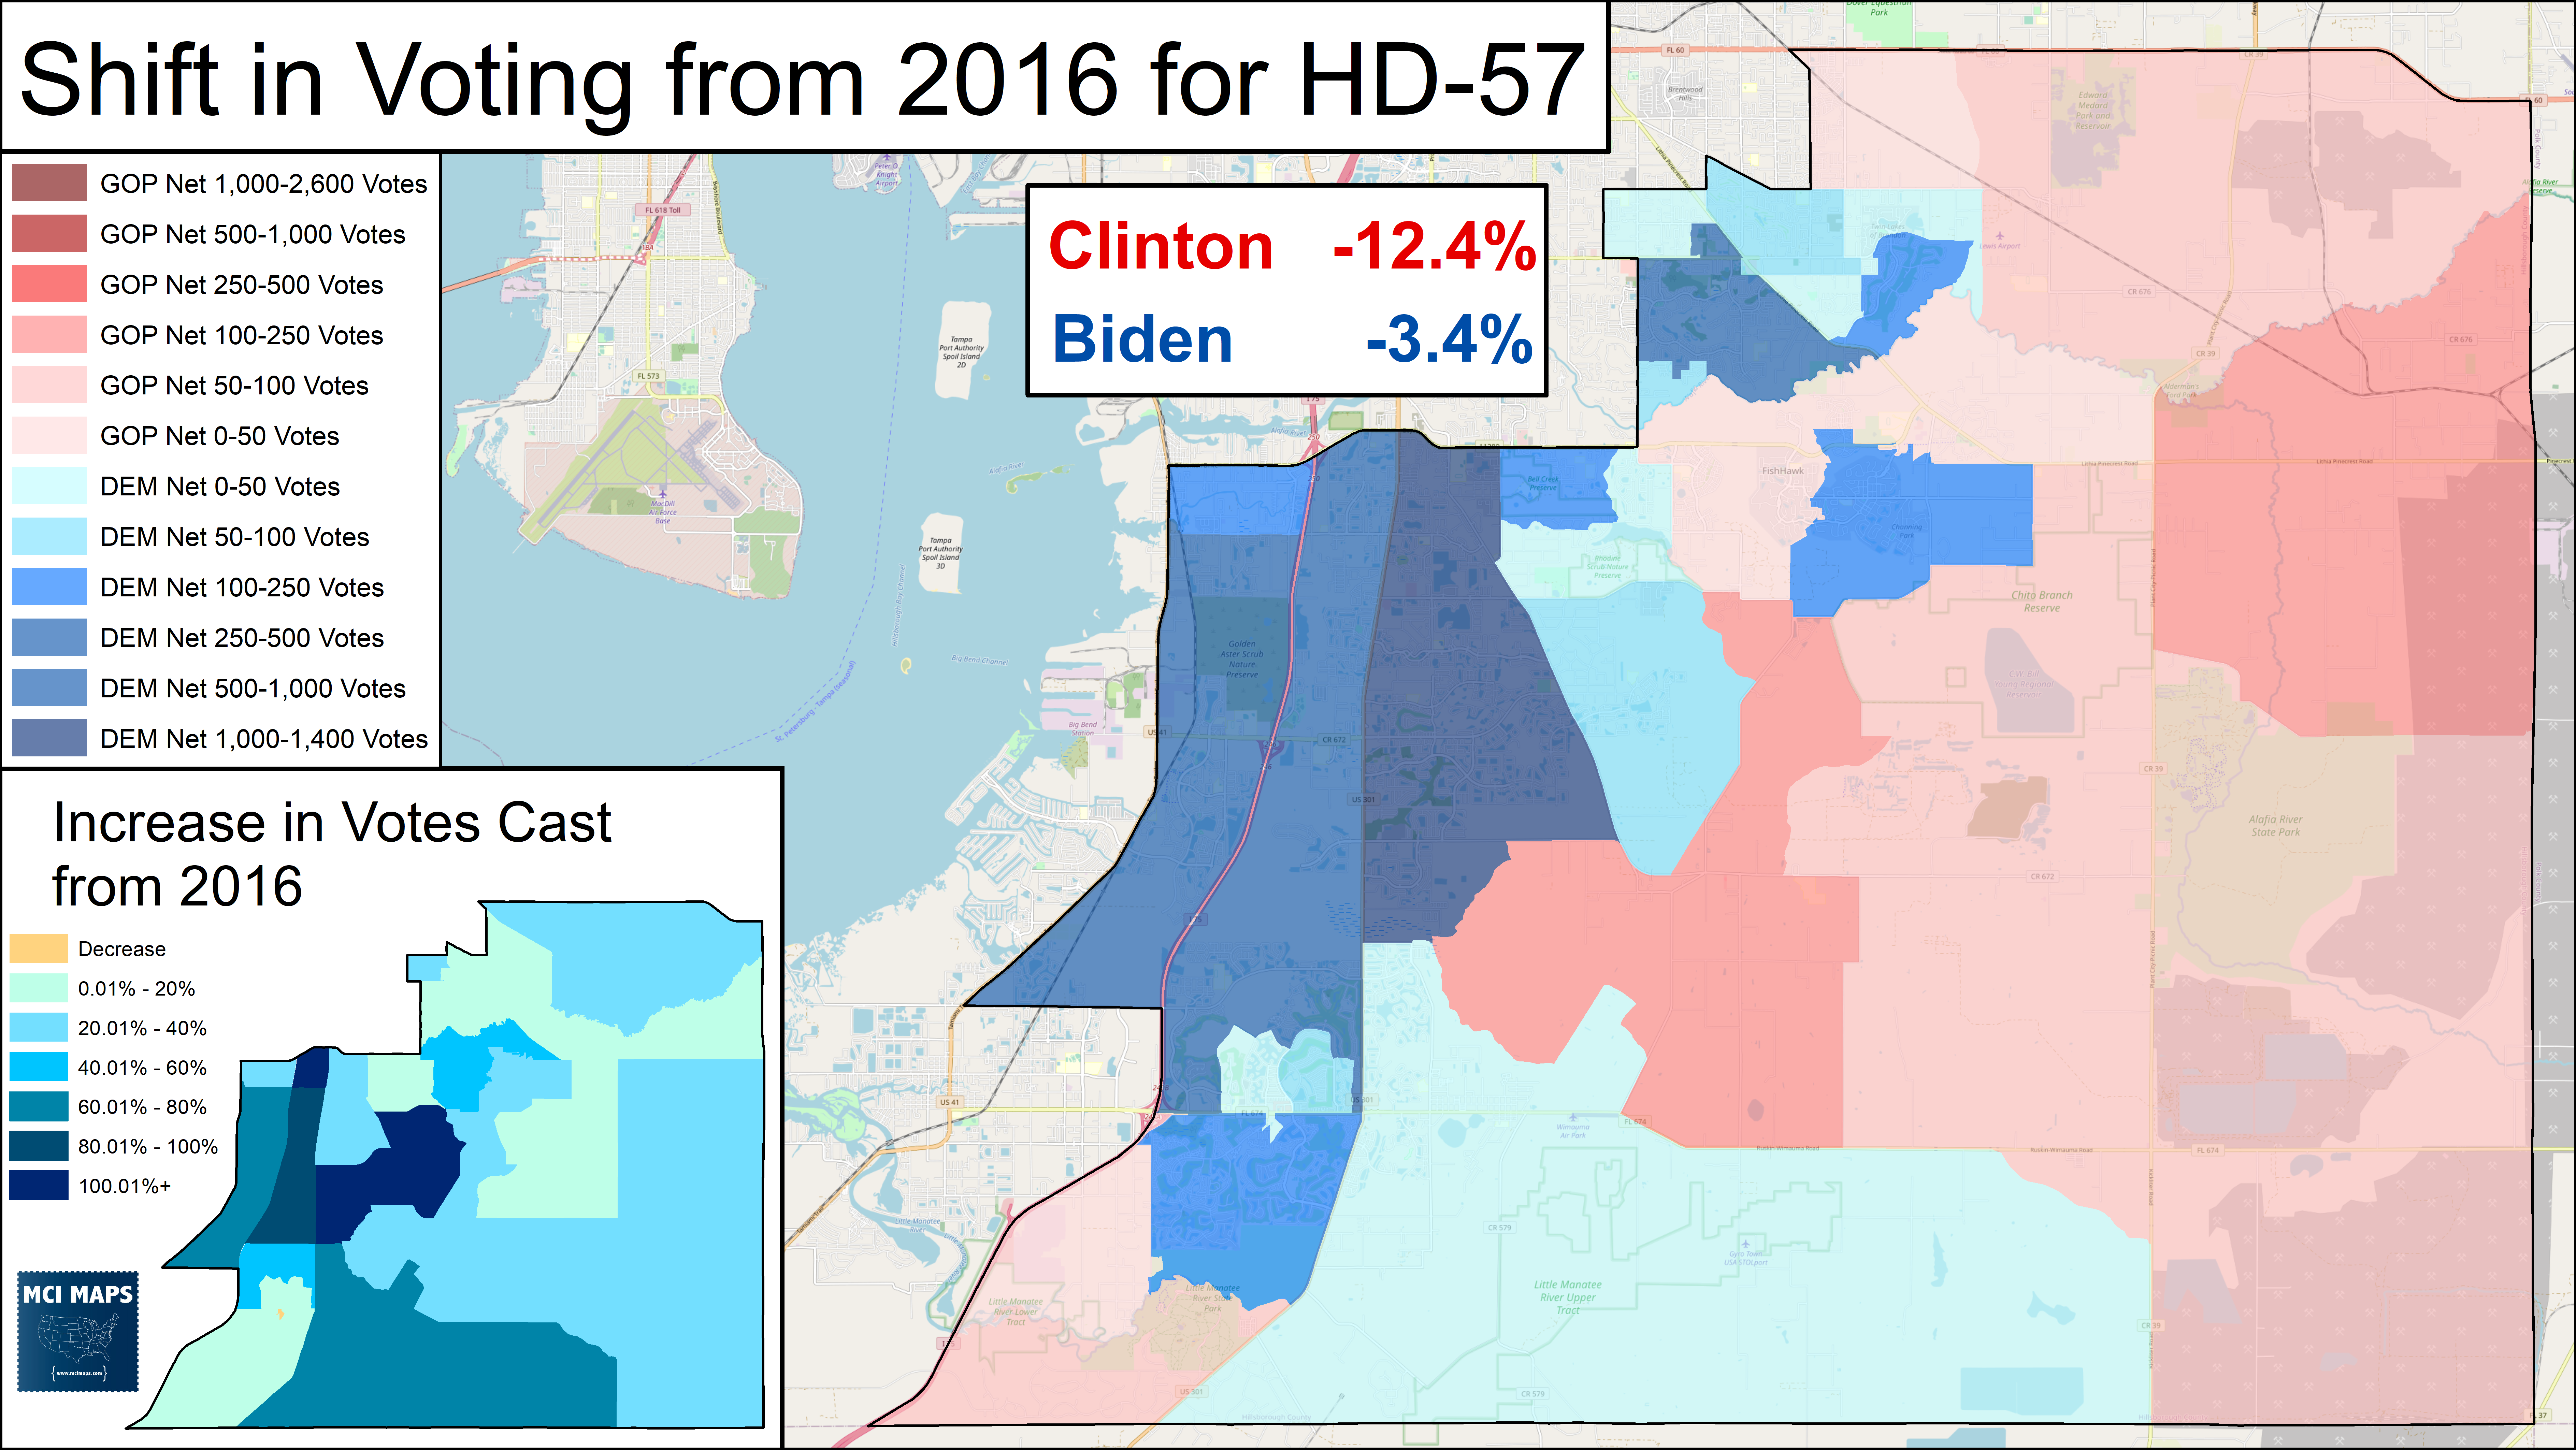
This seats growth perfectly summarizes what has occurred along I-75 in Hillsborough.
Potential House Map
When working on possible districts for the area, I wanted to consider current borders when possible (not a requirement but not against the rules), where population growth would continue, and to ensure minority representation was maintained. The region currently holds a Hispanic-majority district, an African-American plurality seat in Tampa, and an African-American seat in St Petersburg that stretches further south.
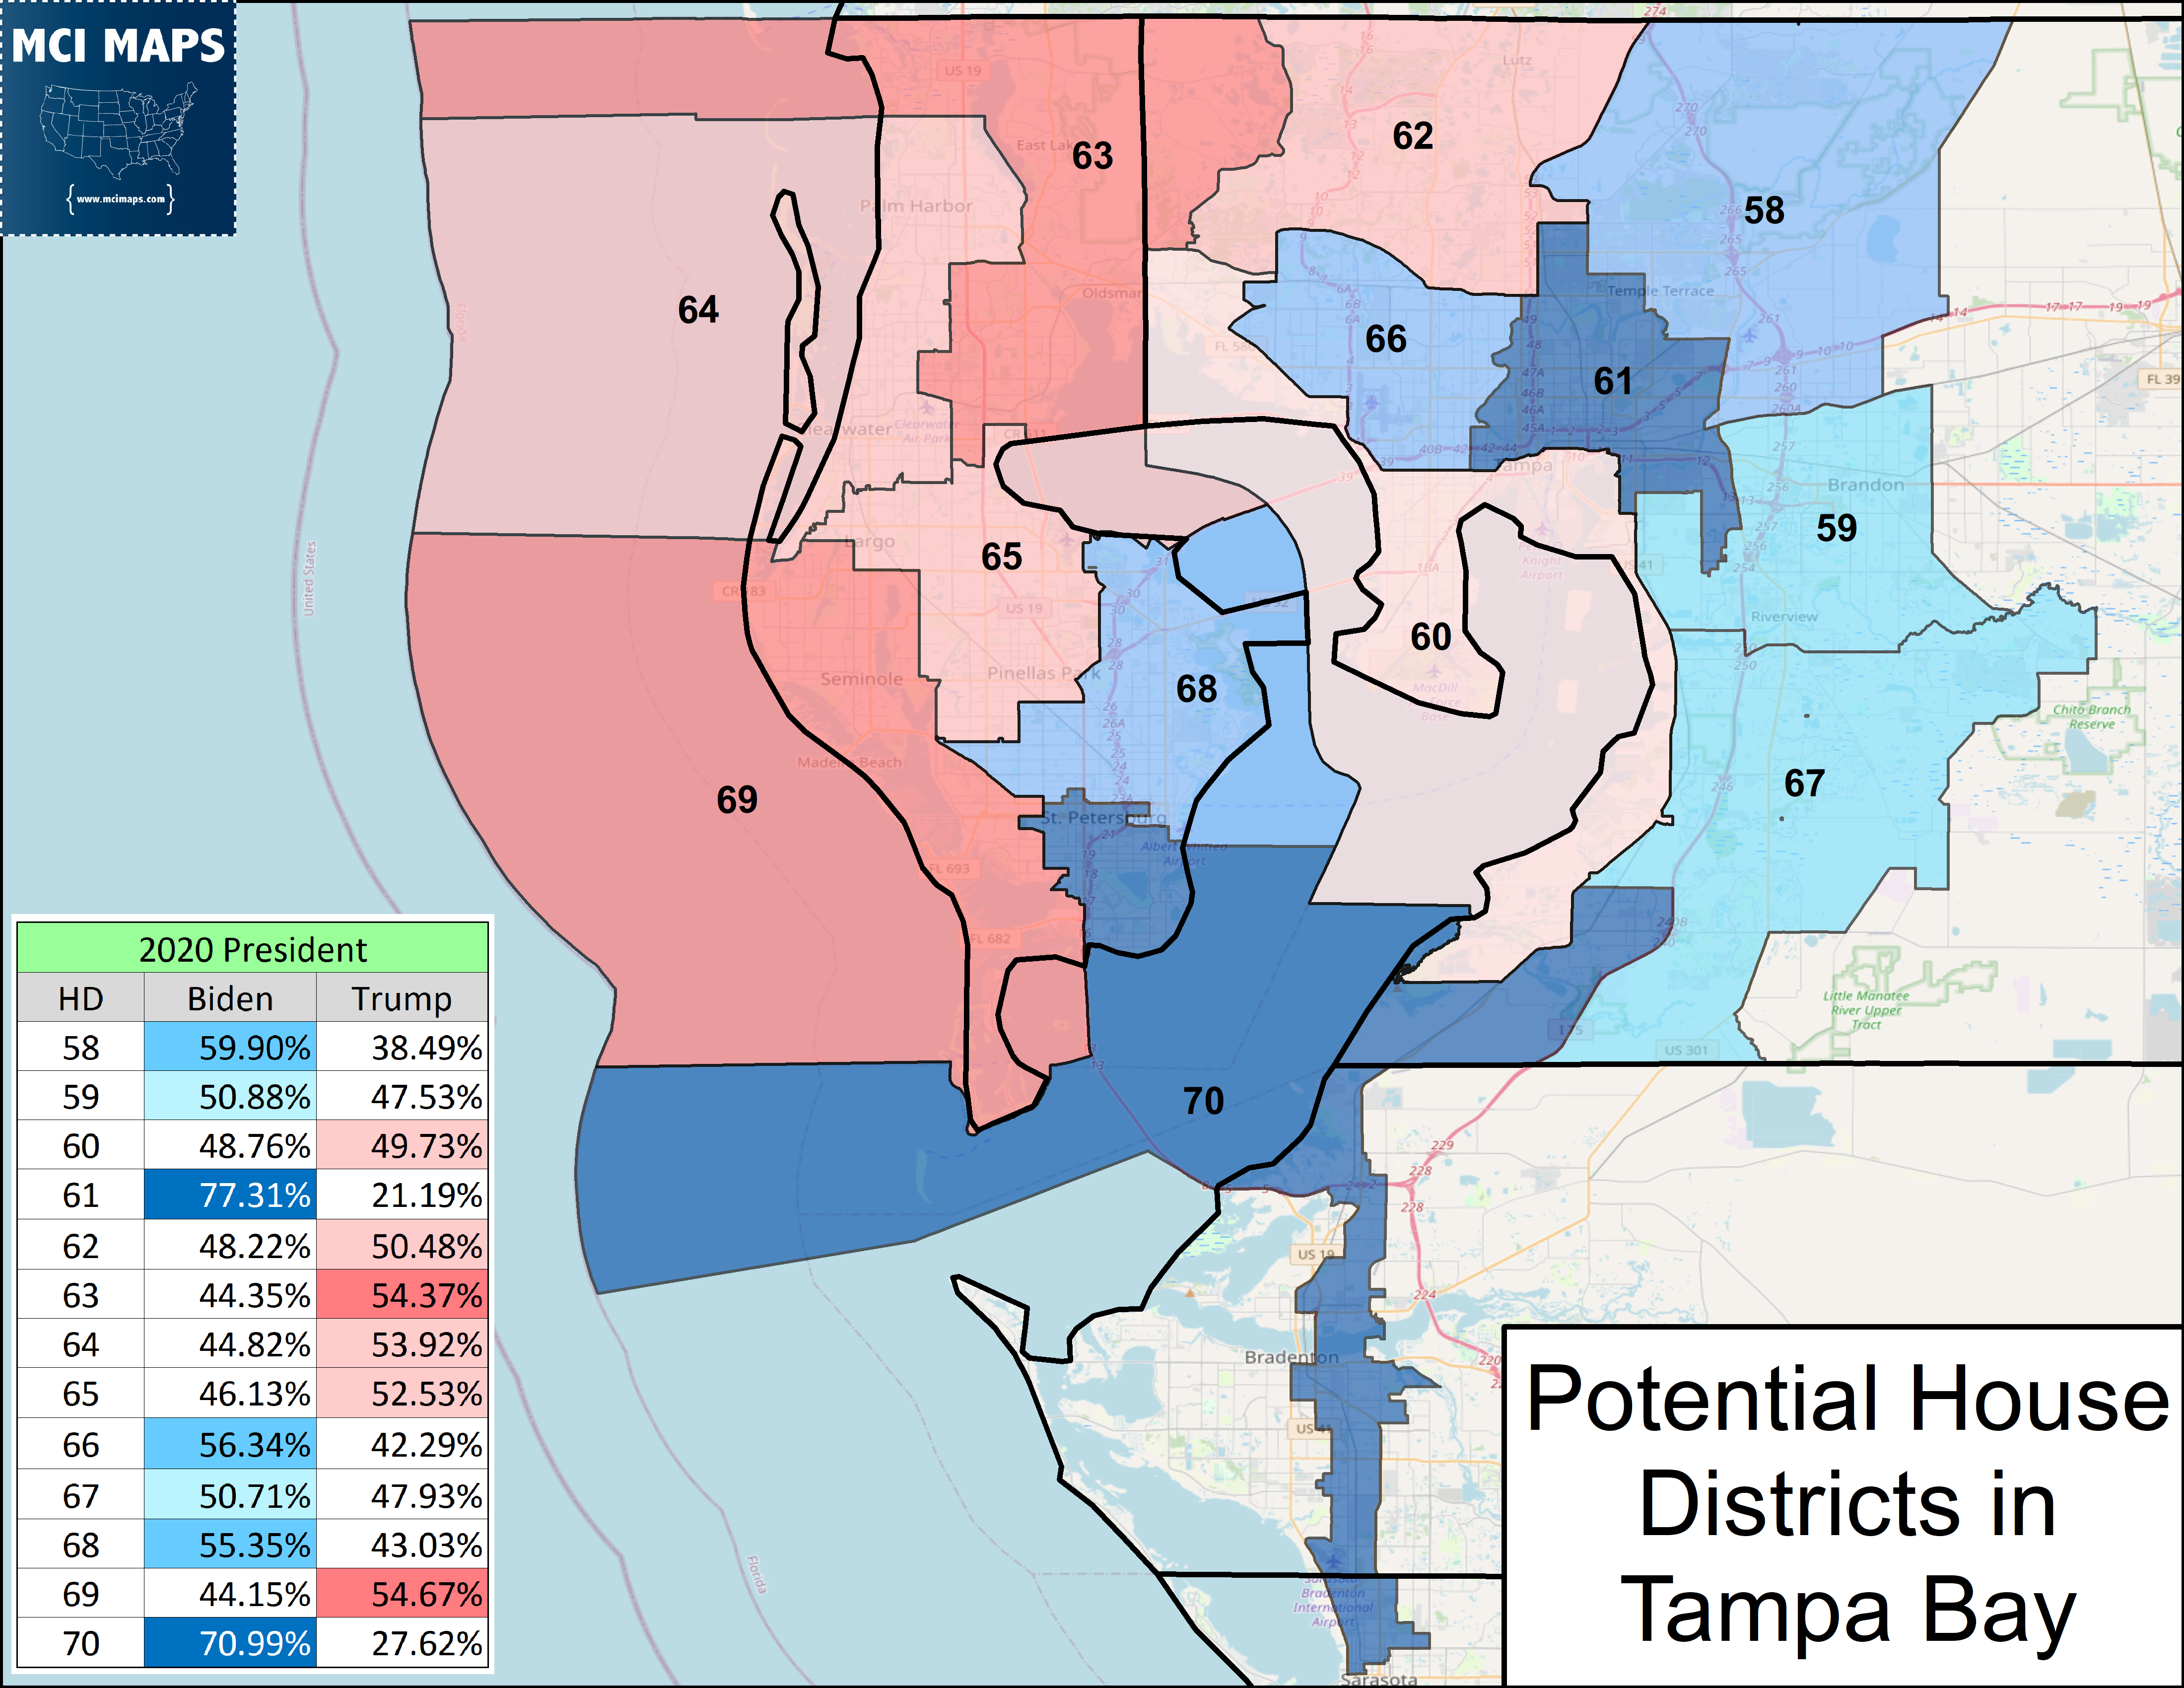
After a great deal of internal debate and adjustments, this is one proposal I drafted.
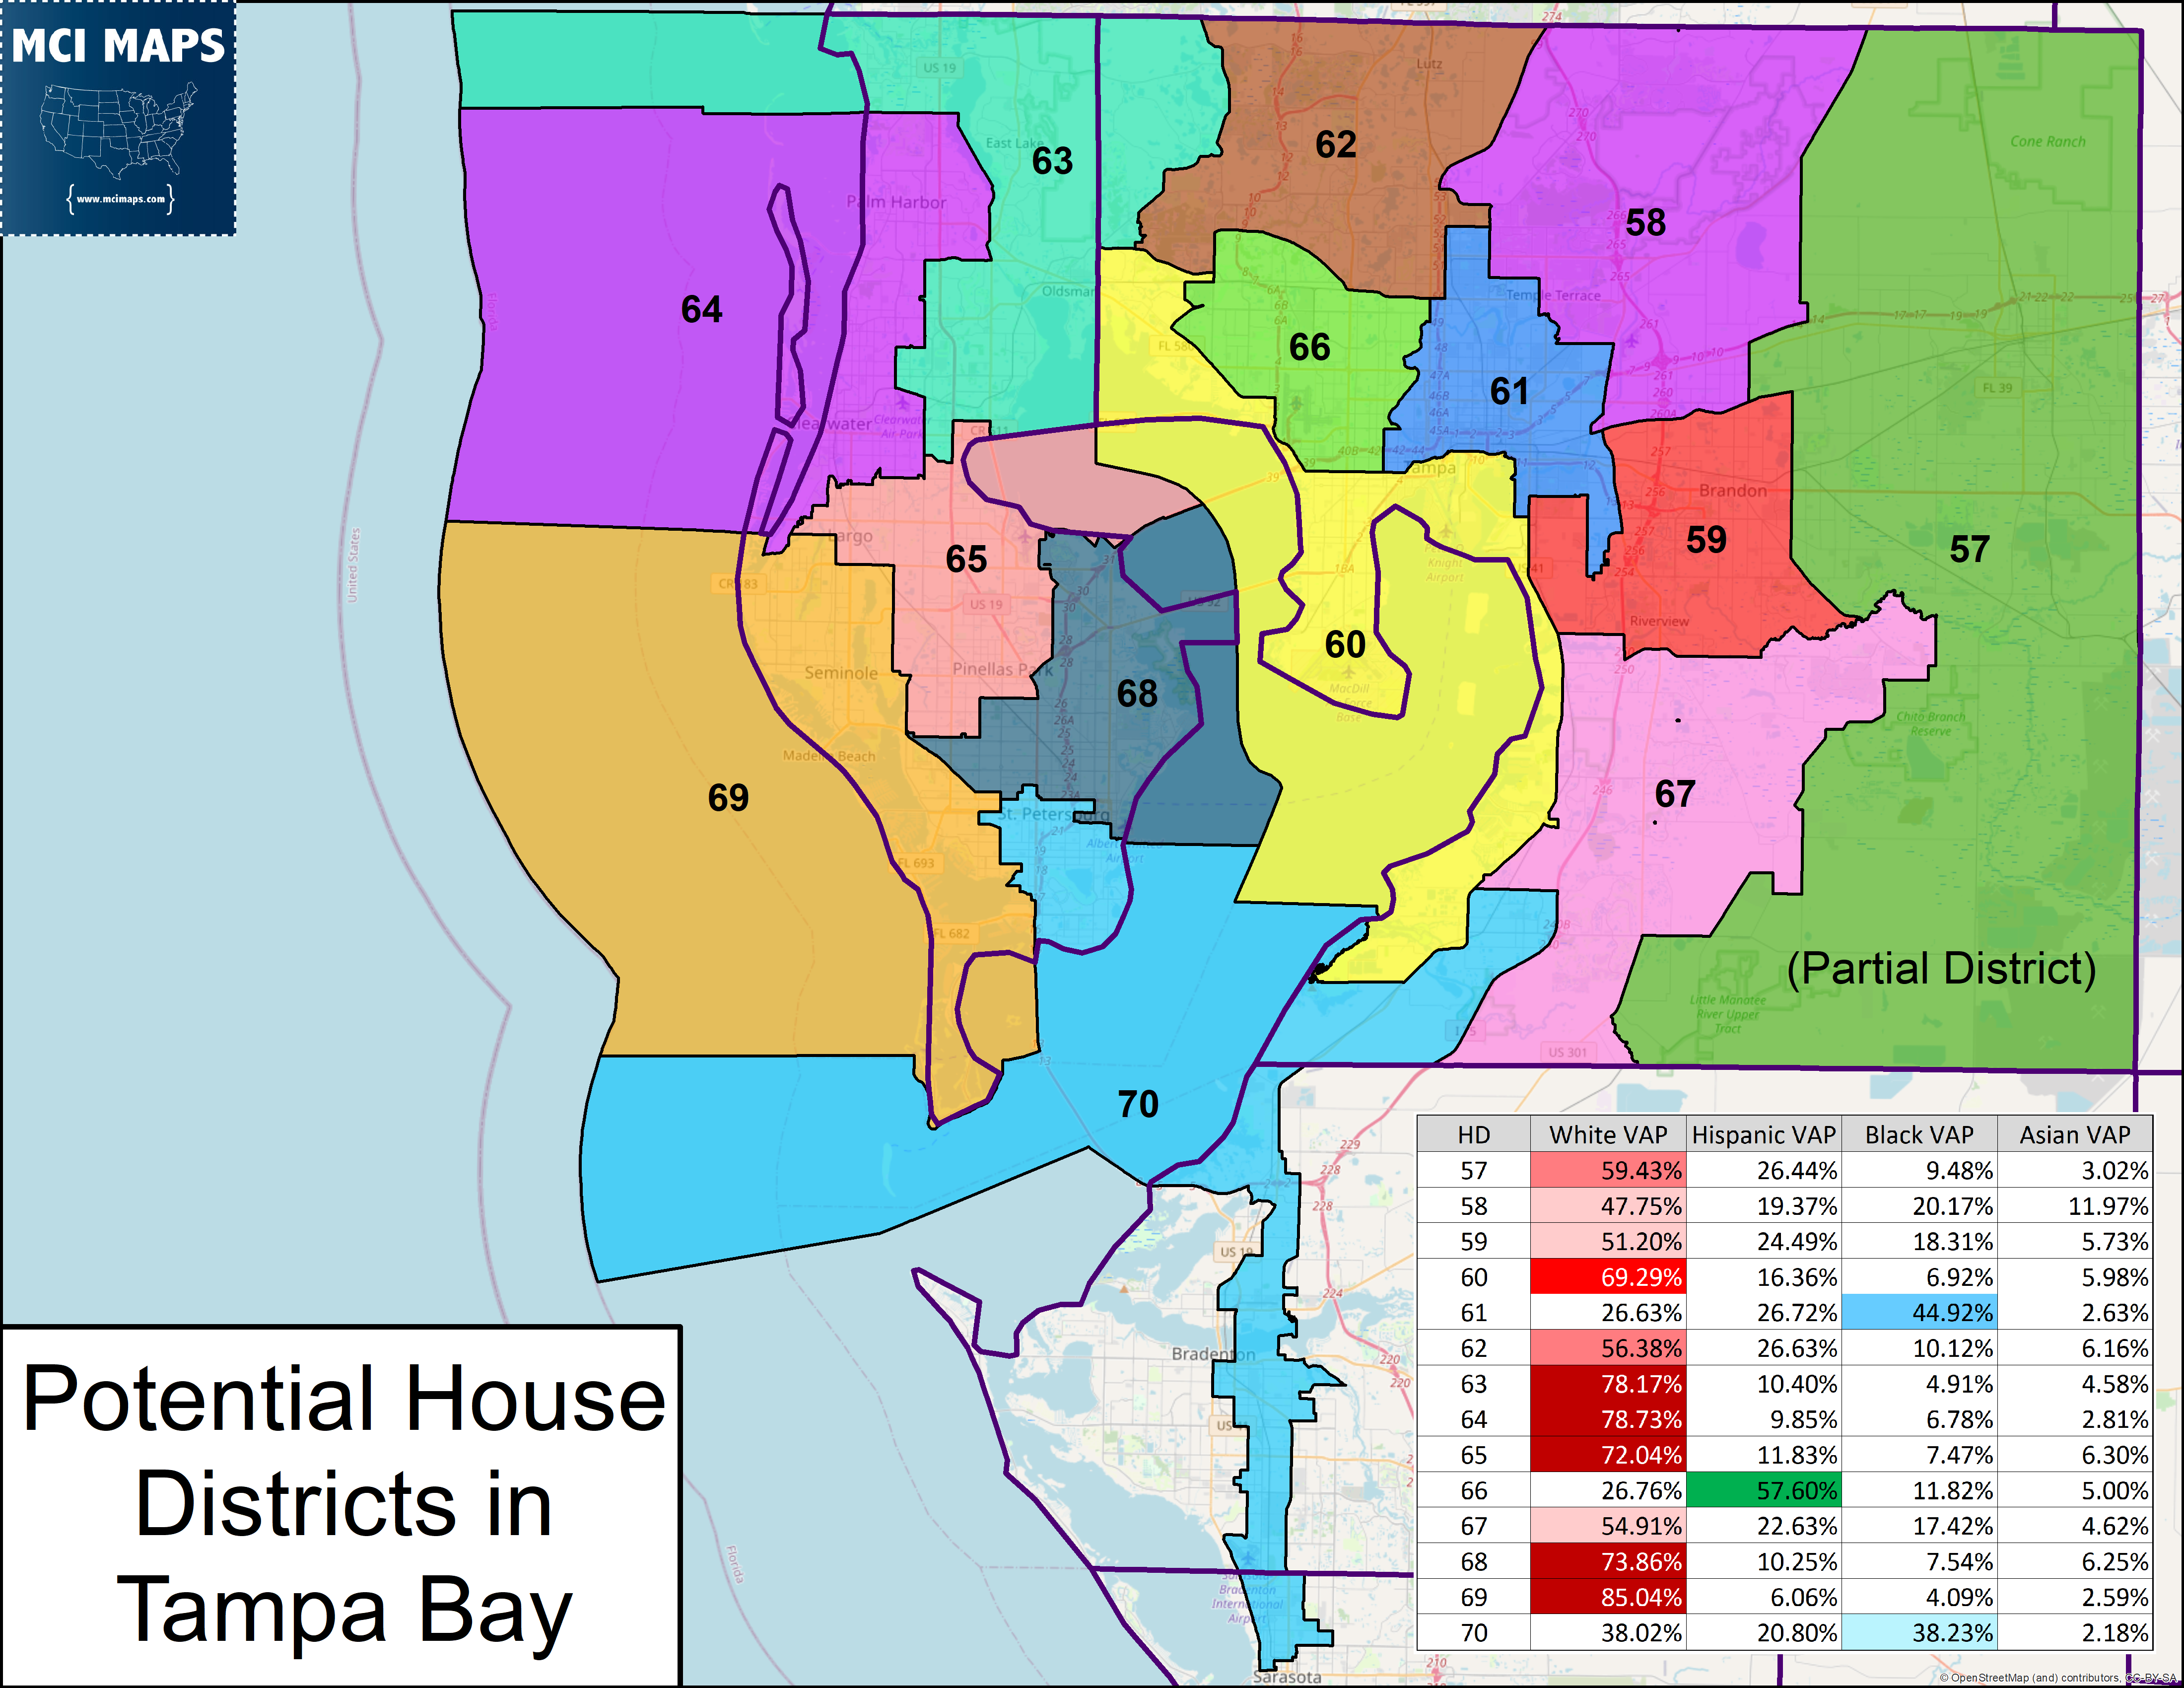
The Voting-Age-Population data is listed in the corner. The districts in question maintain racial representation, but we see Pinellas overall lose a bit of power while the southeastern Hillsborough region has a new urban/suburban district. In my map, district 57 is not complete – needing to go into Polk, Manatee, or Pasco to get the population it needs. Many districts have an ancestry they can tie to. District 67 is the most changed – as its lost its rural areas and it now a district for the growing population of the region.
The story of the above map is a modest shift out of Pinellas and a tightening of districts around the urban core of Hillsborough.
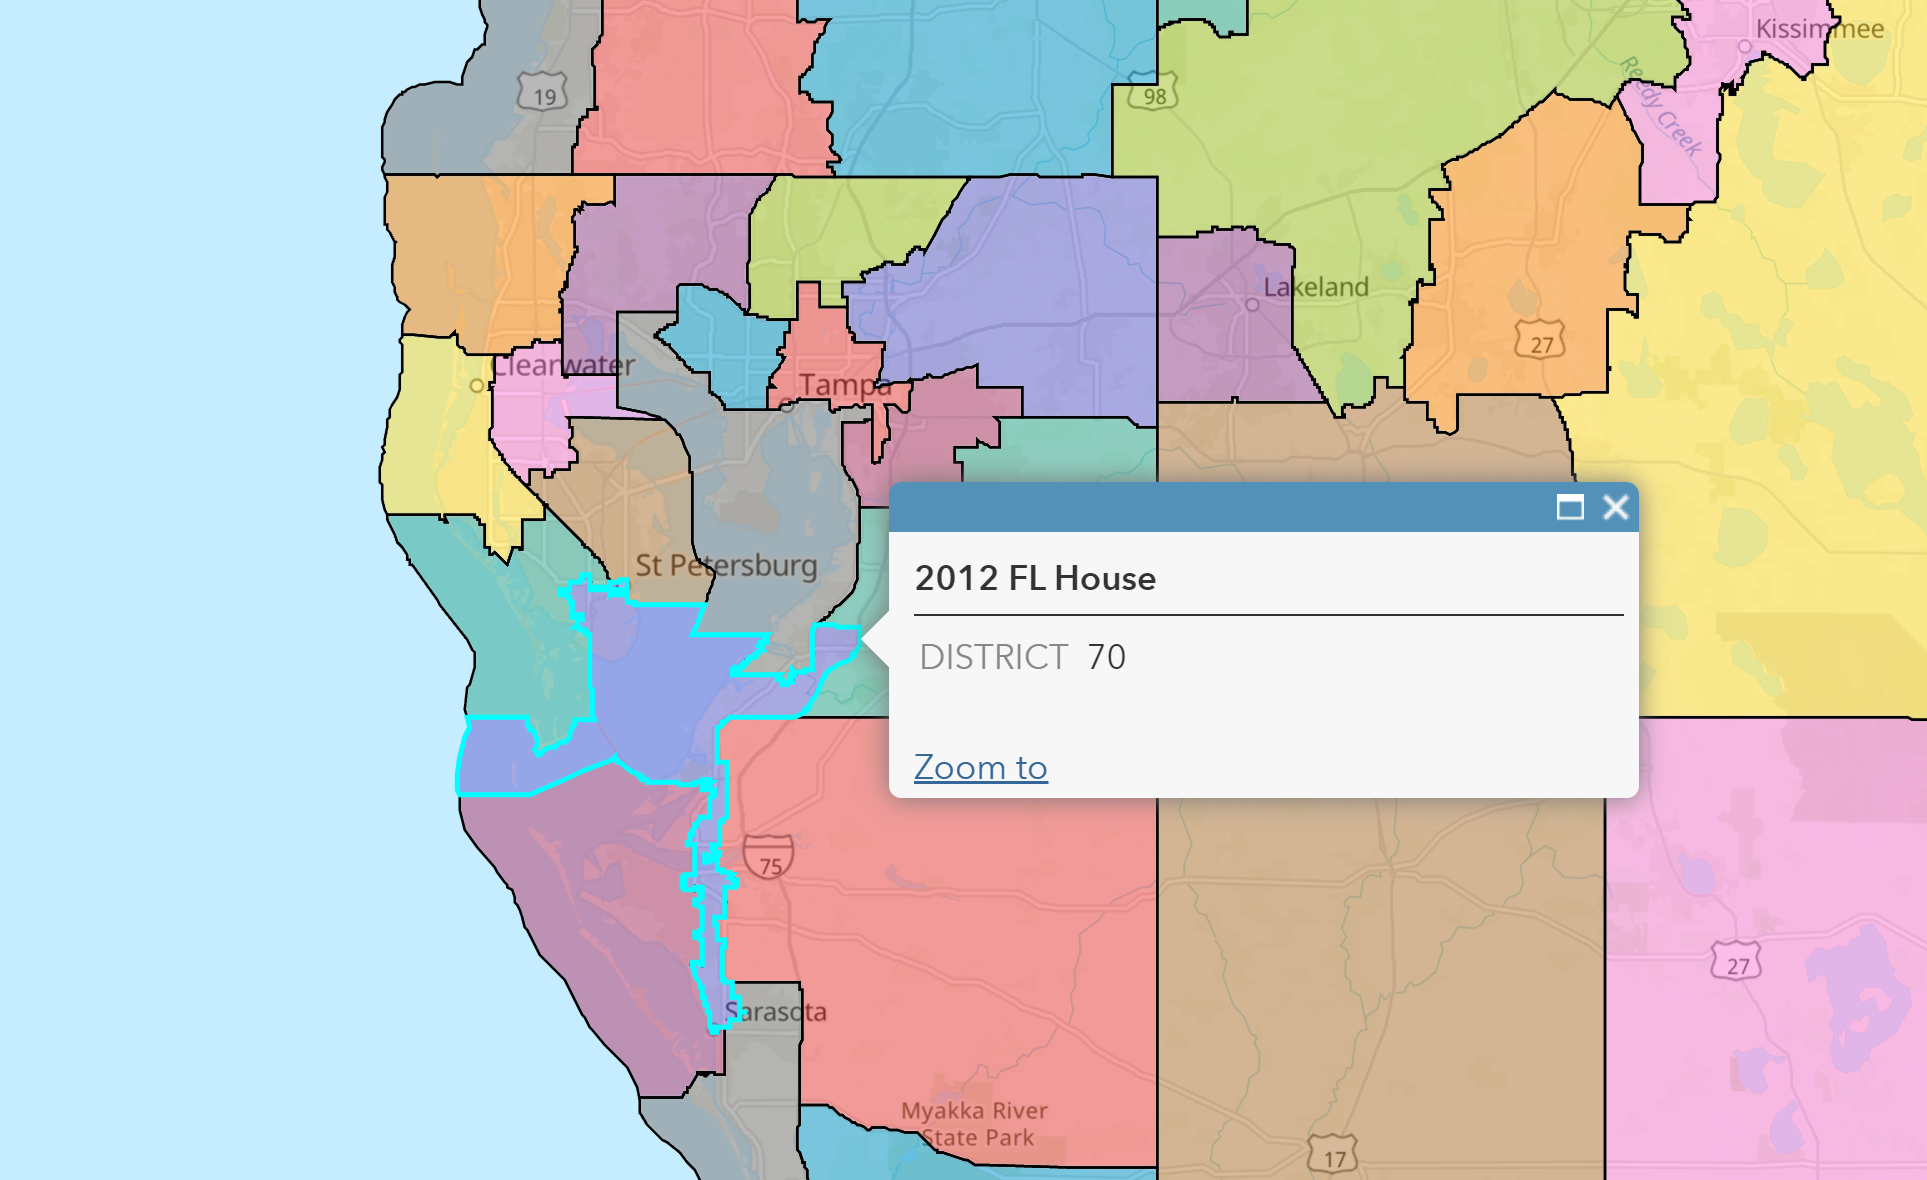
District 70 Redistricting History
Ok, lets talk about district 70. This is its current form. A seat that connects African-American voters across the area. The seat is anchored in Pinellas (city of St Pete specifically). It grabs blocks of African-American voters in Hillsborough and follows down a corridor of African-Americans in Manatee and Sarasota county.
This seat has long been targeted as a gerrymandering example. However, this is not a district born out of political gerrymandering as much as its a district born out the Voting Rights Act. The district first came into existence in 1992, going from St Pete to Bradenton (in Manatee county). Even with the lines, the district was only 47% African-American. So we are not talking about some 90% black seat (which could definitely be argued as packing if that was the case).
When 2002 came around, Republicans expended the seat down into Sarasota, increasing the black population. Now this is something I talked about in my 2002 redistricting article. Republicans super-charged many minority districts – arguing it was needed to ensure continued minority Representation. Now, was this for their own partisan benefit? Yes. By going into Sarasota, it makes it easier for the GOP to keep HD72 as a swing/Lean R seat. Read more about HD72 here. However, it also improved the minority share of HD70.
When 2012 came around, the district retained its Sarasota addition. The Supreme Court (a liberal bench at the time) – defended the the HD70 layout. While there was a political benefit to the GOP, the district survived because it was ensuring minority Representation. Barring some smoking gun from the GOP, legislative deference is given.
The fact is, as this district has changed with time, its African-American share of the population has always been close to 47%-50%.

The district used to be anchored just in Pinellas county. However, as the state grew and more residents needed to be added, the district had to move south to maintain its minority access status.
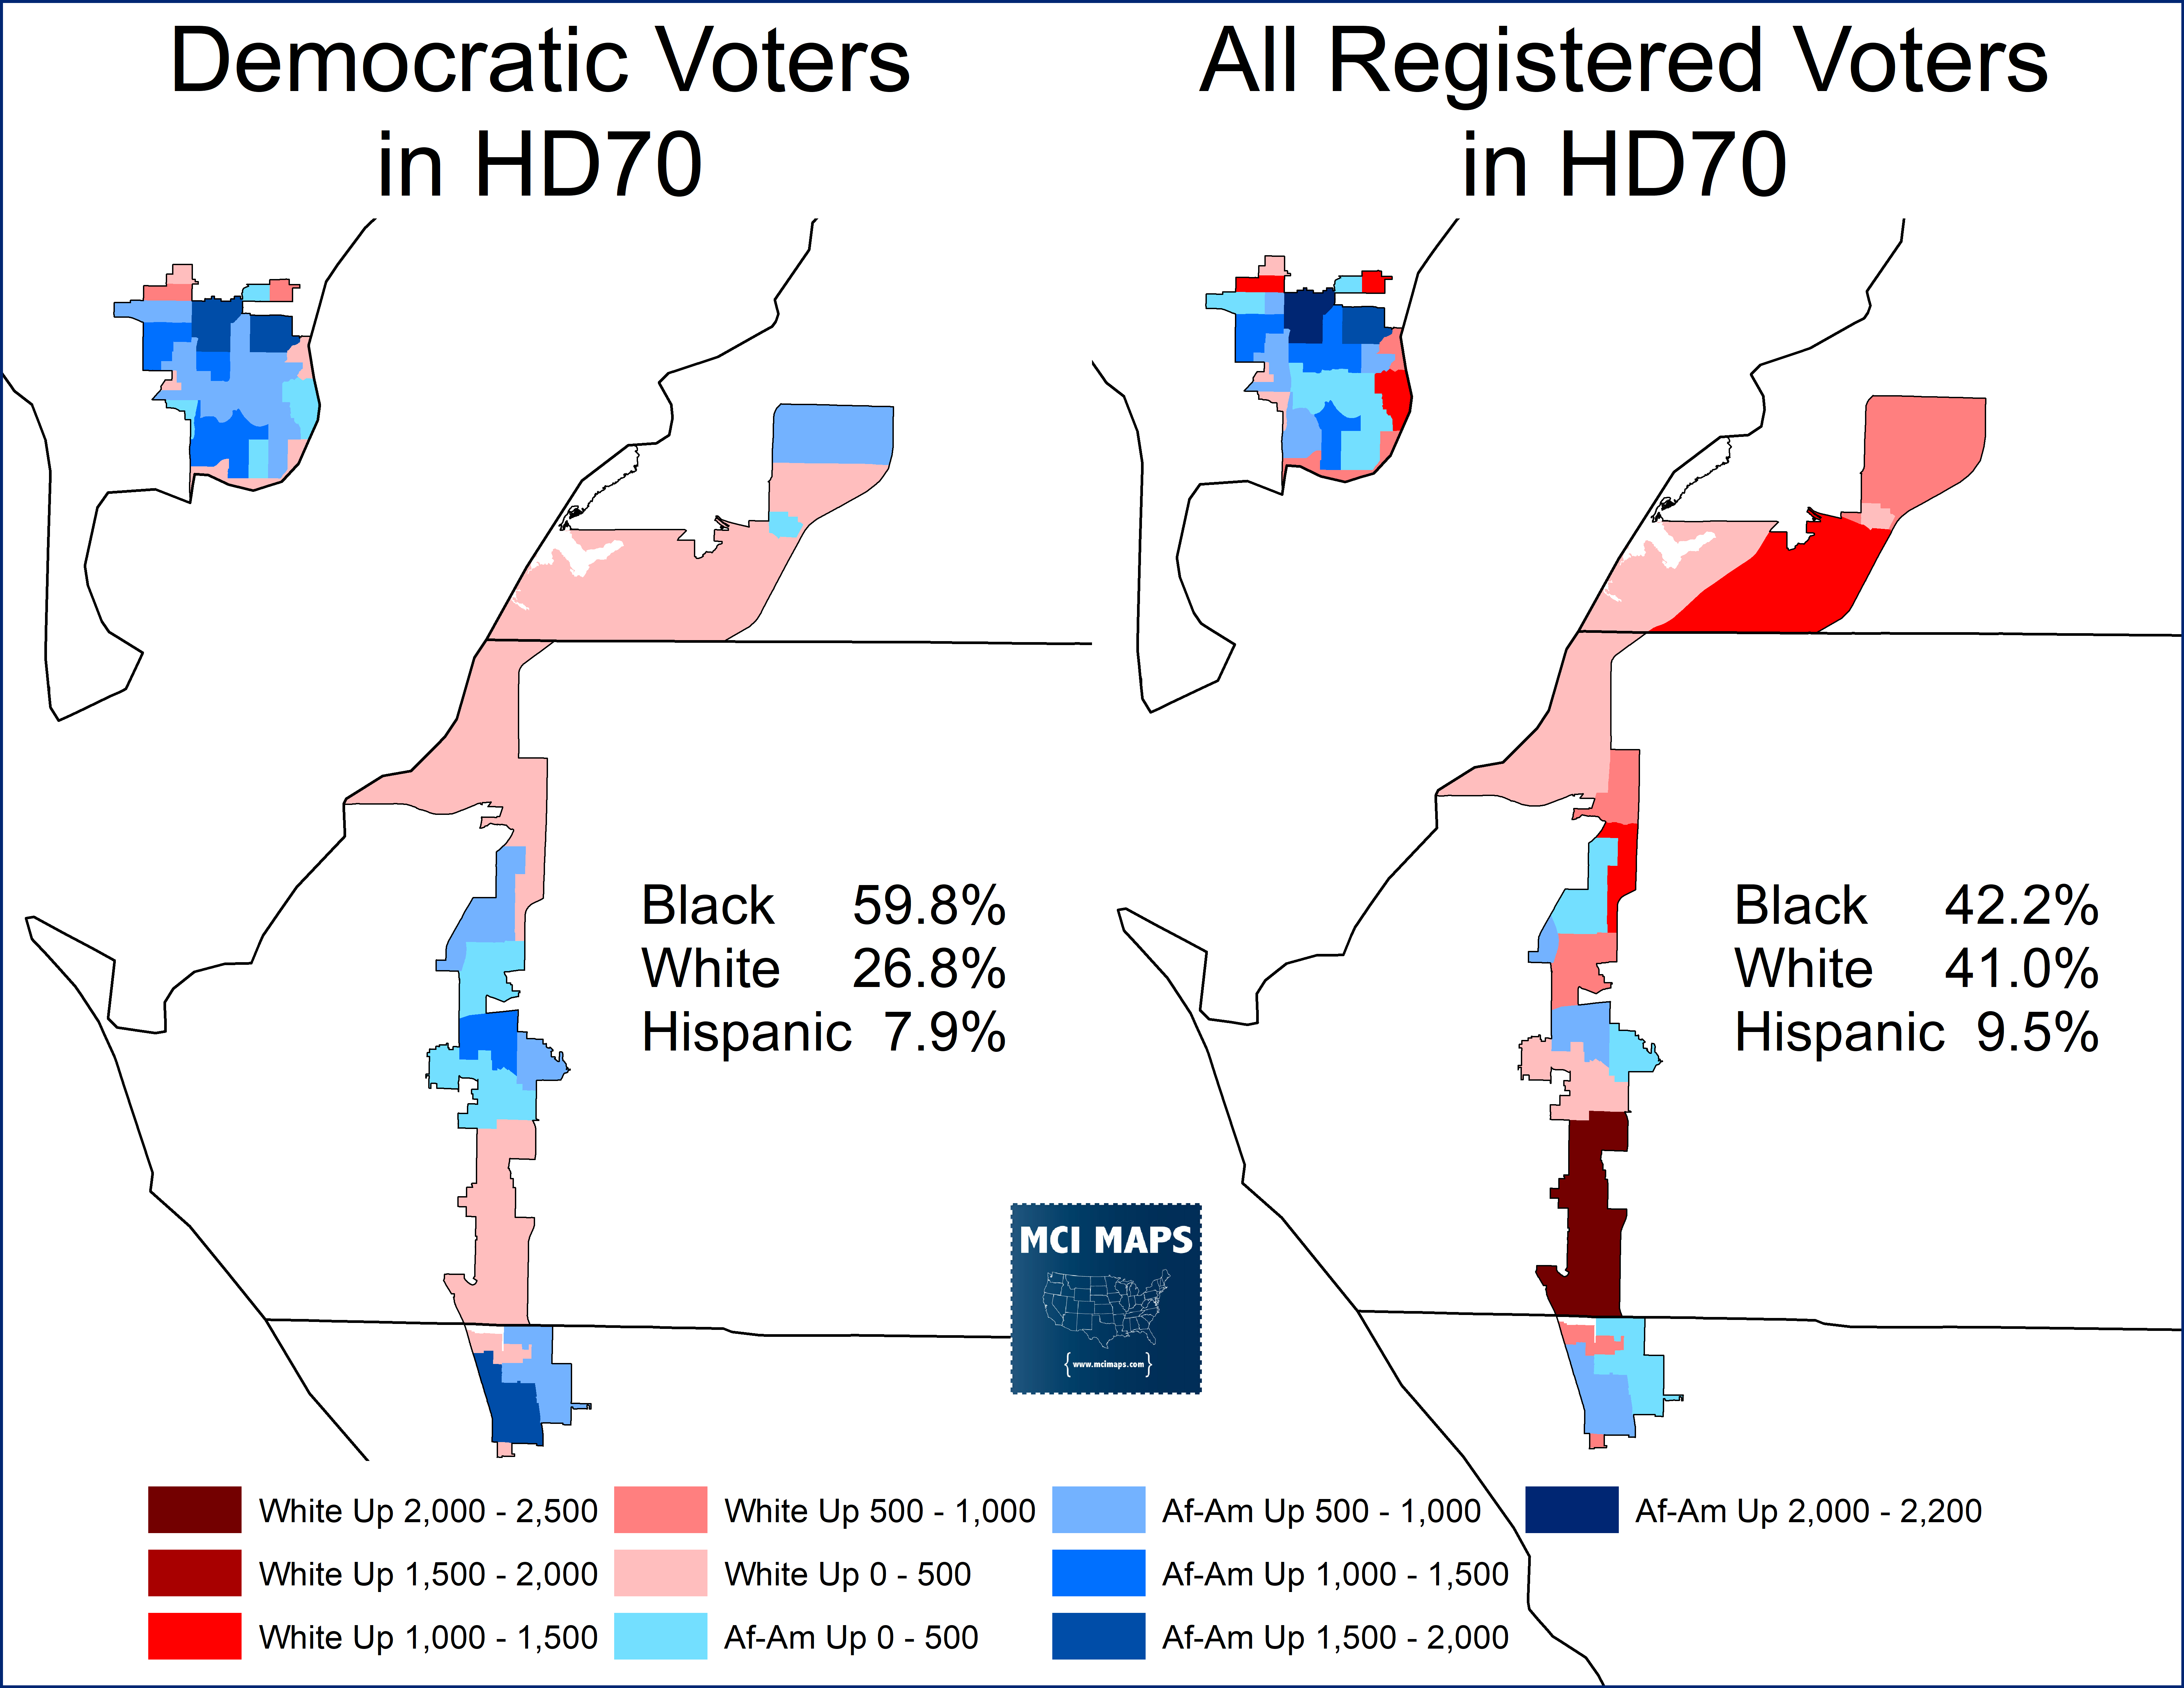
Ok, so what if we changed the district in 2022? Well you absolutely cannot draw HD70 just in Pinellas/St Pete. That wouldn’t even be majority black in a Democratic primary. So that is a non-starter. The real question is going into Sarasota or not. What if we drew a map where it stops in Manatee?
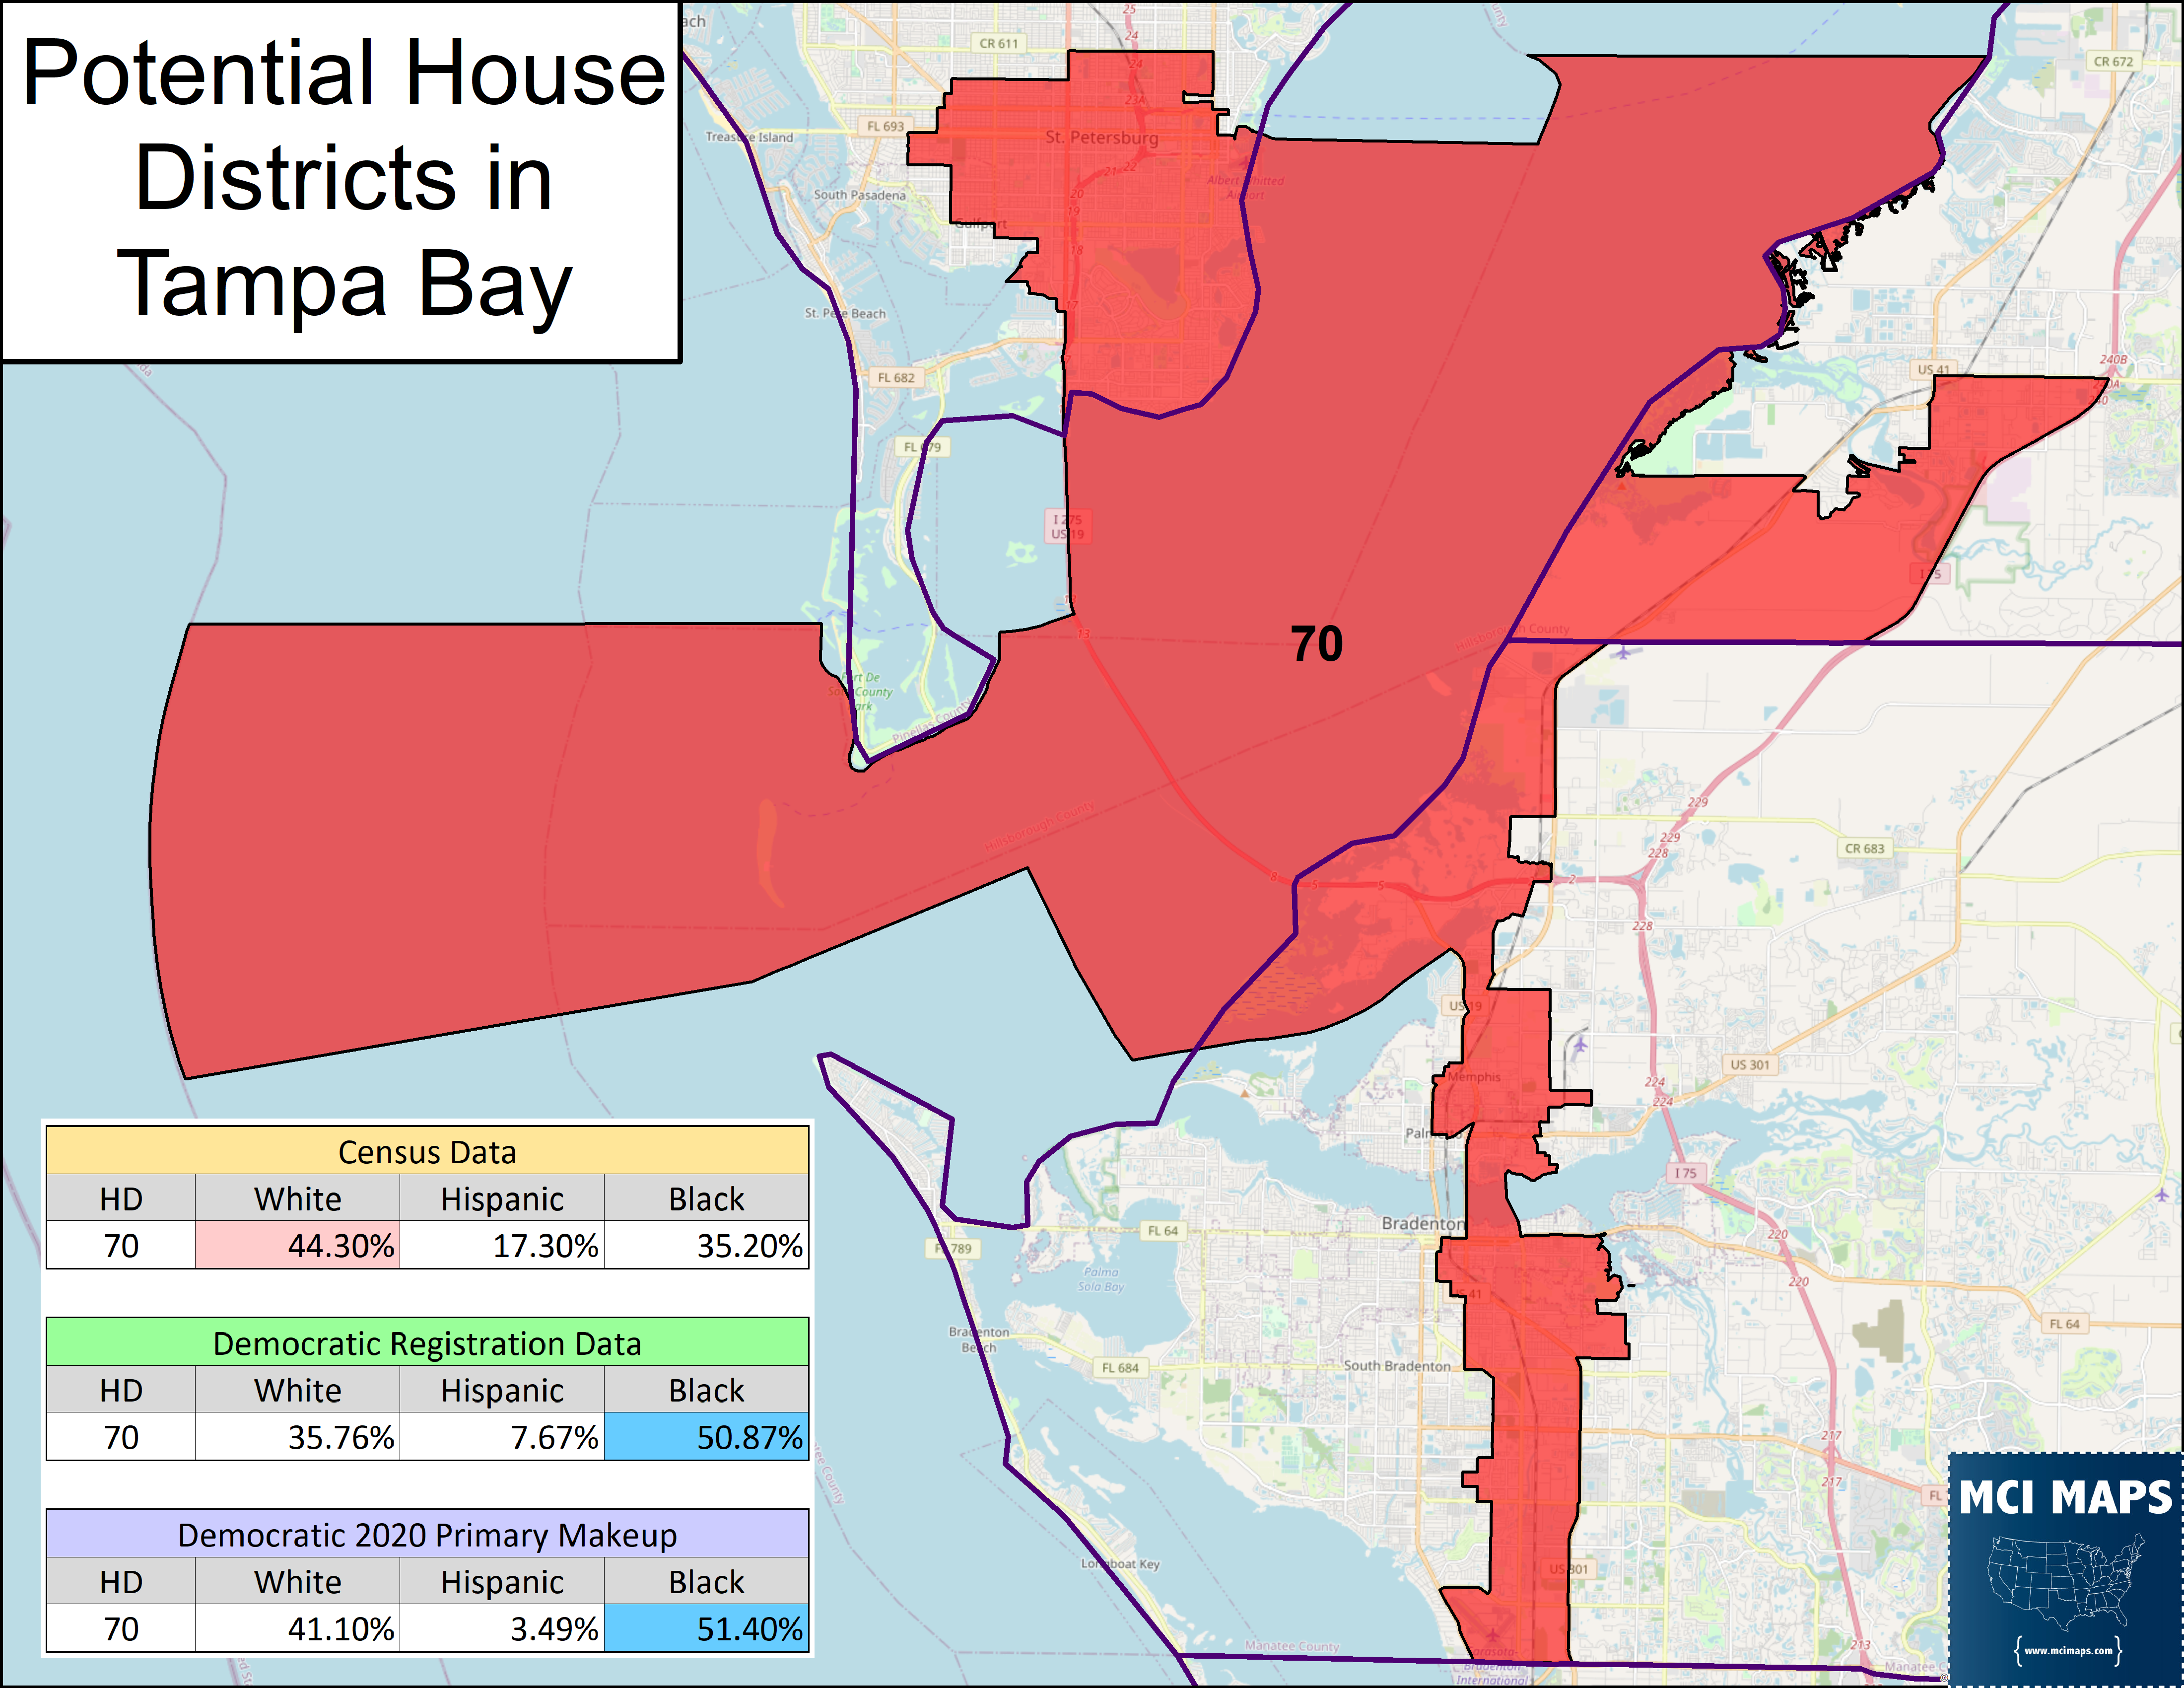
So if you stopped in Manatee, you would still have a African-American seat? Yes most likely. While it would be plurality white in the census, it would be a safe democratic seat with a majority-black Democratic primary.
The 2020 Democratic primary would have been 51% African-American. However, this is still notably lower than in a seat which includes Sarasota.
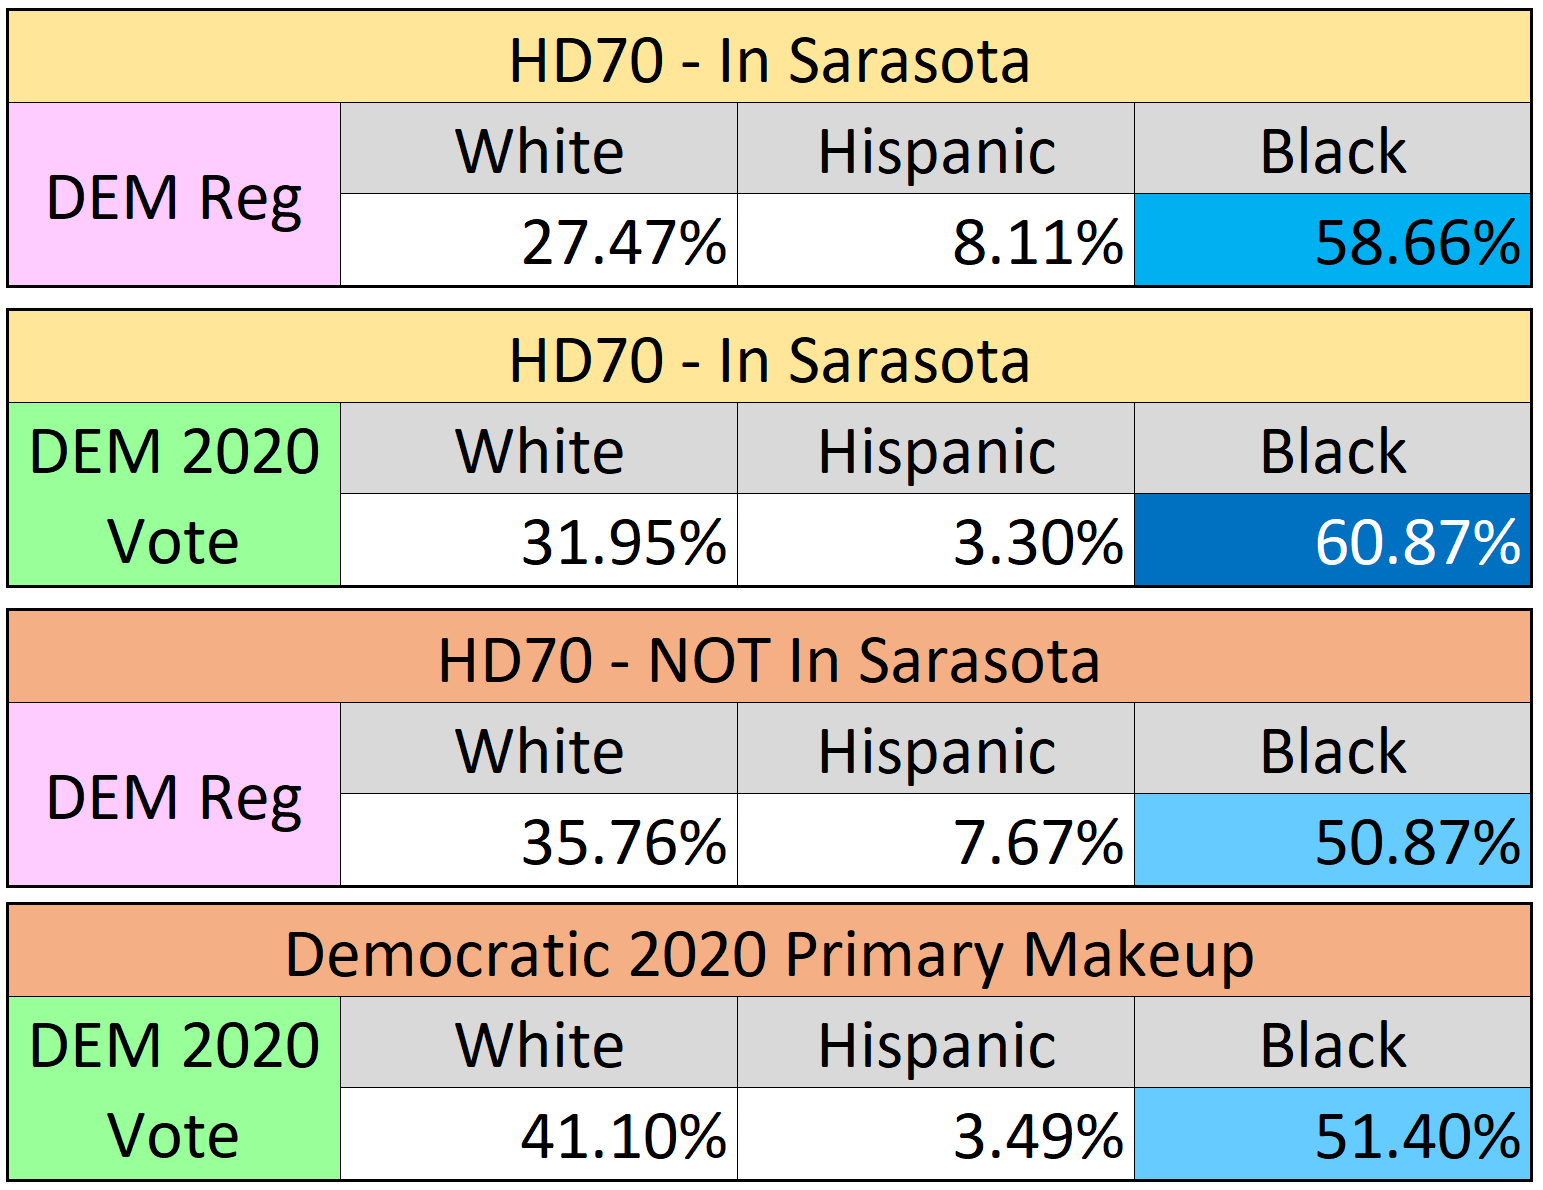
The issue is pretty straight-forward. By not going into Sarasota’s black community, you lose those voters. On top of this, you need more population, so you must grab white voters in Manatee or St Pete. So instead of a 61% black democratic primary, you are at 51%. Now, maximizing minority share of a district is NOT a requirement of Fair Districts or the VRA. However, the question becomes, would a 51% black democratic primary be enough? Is going into Sarasota (which splits another county) worth the racial representation? This pits Tier 1 of Fair Districts (minority representation) against Tier 2 (county/city splits).
Lets also not forget that partisan desires fuel this debate. Democrats want to stop at the Manatee border, because it could lead to a blue-ish/swingish seat in Sarasota. Republicans don’t want that. Both sides have partisan desires and frankly neither care about county splits or minority representation. They care about the partisan lean of a Sarasota house district.
So judge for yourself.
Potential New Black-Access Seat
So I laid out one potential state house plan. That plan largely maintained current district makeups where possible. However, there is another possibility for a new minority-access district in the Brandon/Riverview area. This plan below has District 65 as a potential African-American access seat.
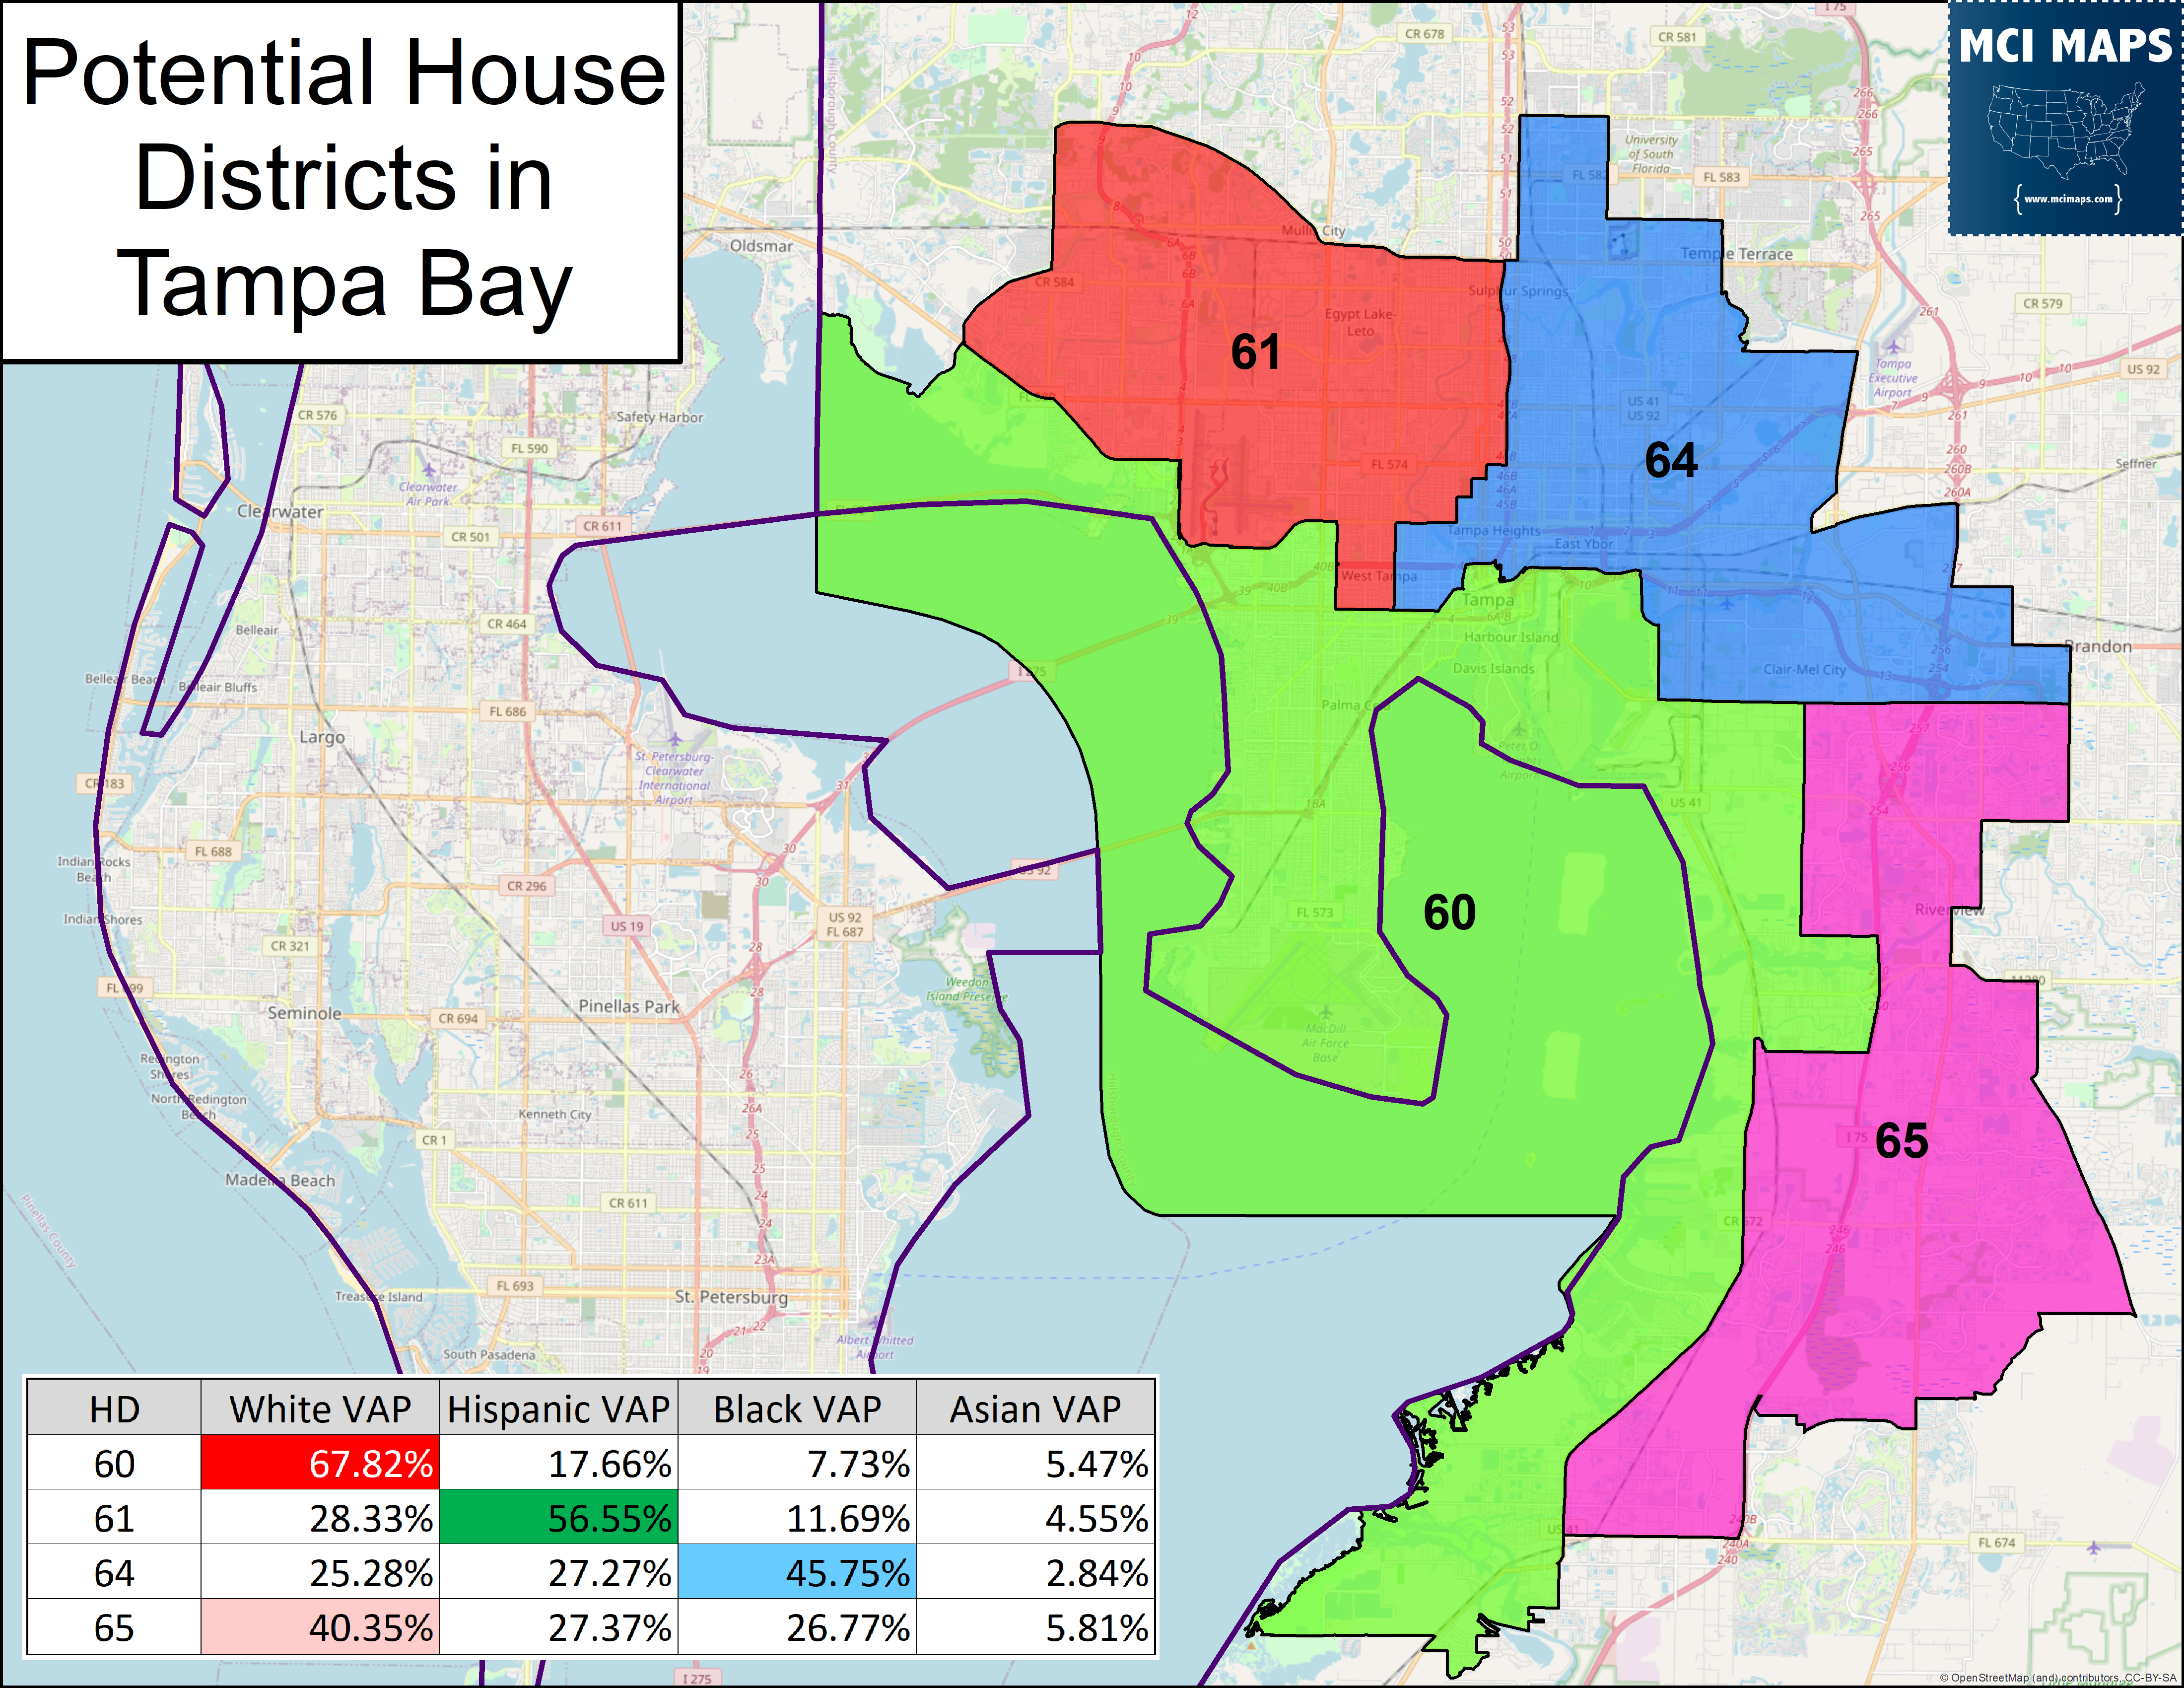
How district 65 performs as an African-American district is through its Democratic primary. This, again, is where Functional Analysis comes into play. This proposed seat would be Biden +20 in the general election. Meanwhile its Democratic primary would be 47% African-American vs 33% white. African-Americans hold the most votes in the primary. The non-white share is likely to increase with time.
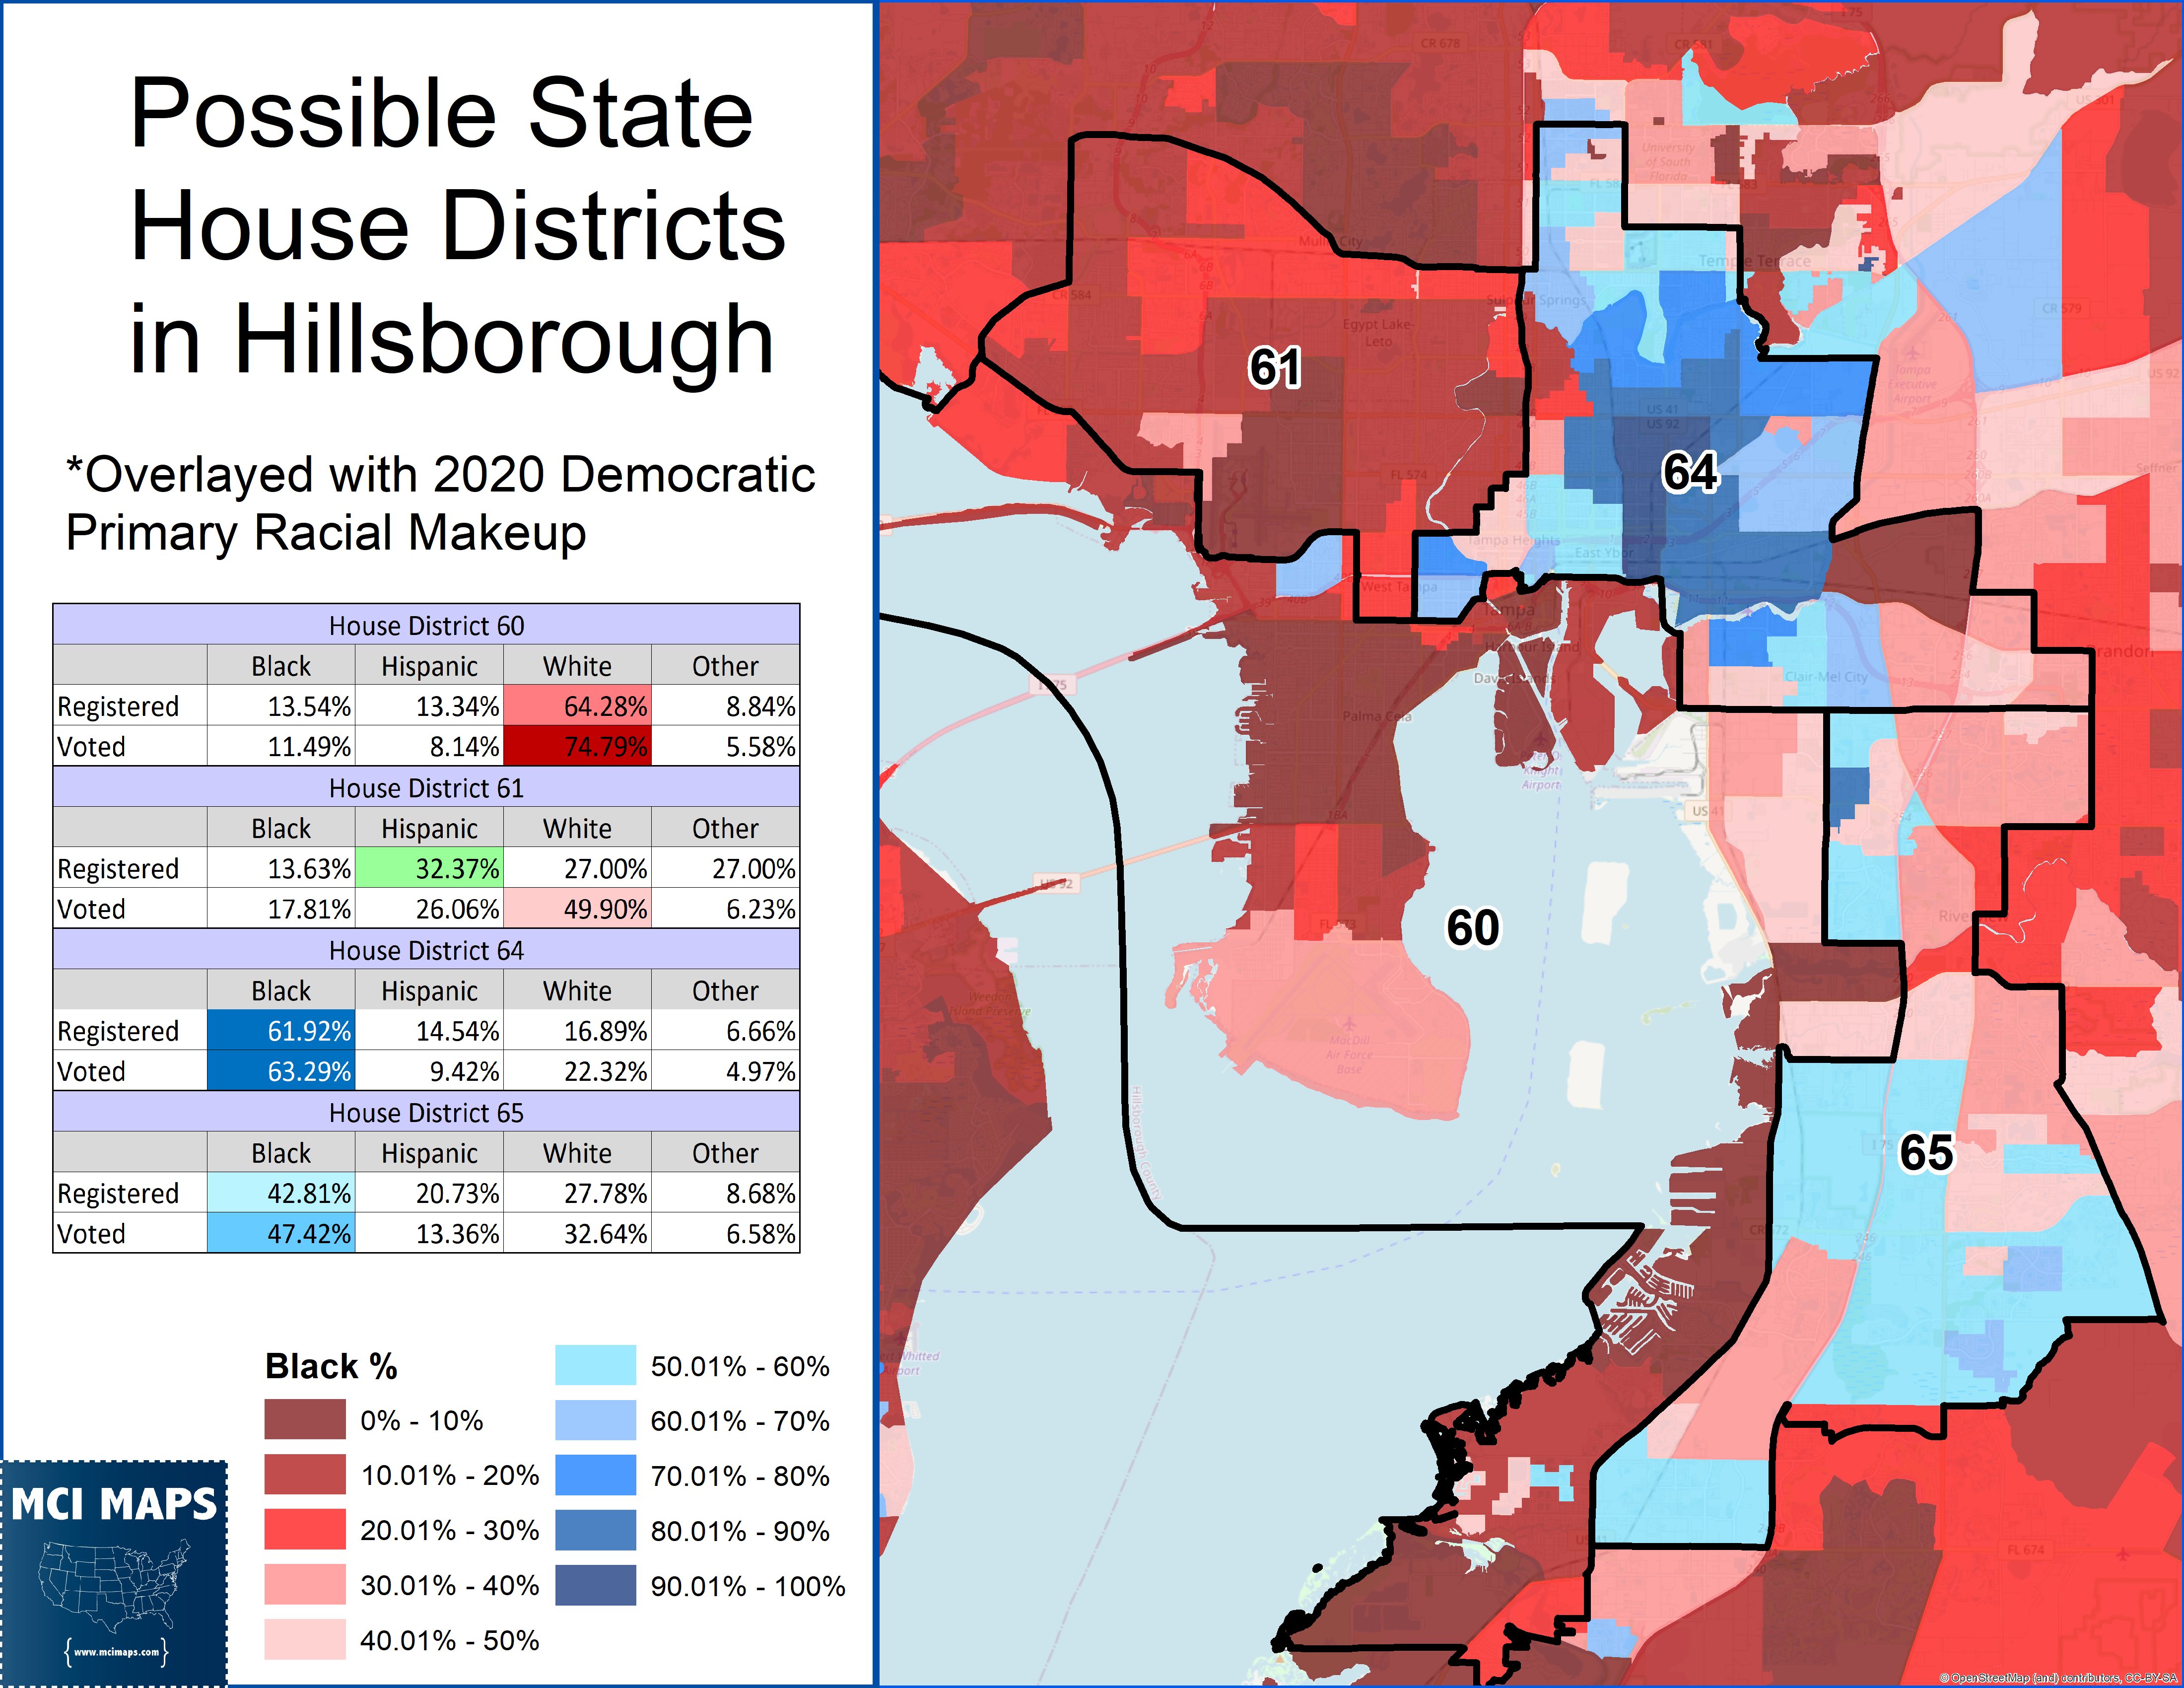
The creation of this seat is not mandated by the VRA or Fair Districts. However, creating it would be a positive step forward in recognizing a growing diverse population in the area.
We’ll see if it shows up on any map drafts. Could the GOP sign onto it? Maybe. I’ll explain below.
Possible Republican Gerrymandering
As with all my redistricting tour articles, I’m going to talk about possible Republican gerrymandering attempts in the map.
There is plenty of reason for the Republican legislature to not like the plan I drew. In total it is made up of seven Biden seats and six Trump seats (not counting 57). Now, this would make sense for a region that backed Biden. However, it increases the number of Biden seats by one (my 67 specifically is the new Biden seat).
So how could Republicans short-circuit Democratic seats. The biggest trick for them is the Democratic growth along I-75. If Republicans want to keep the whole region covered in GOP-leaning seats, they need to crack and carve up the Democratic voters as much as possible. This is not an easy task. The proposal below would, for now, keep Biden seats constrained to three in Hillsborough: 61, 63, 64.
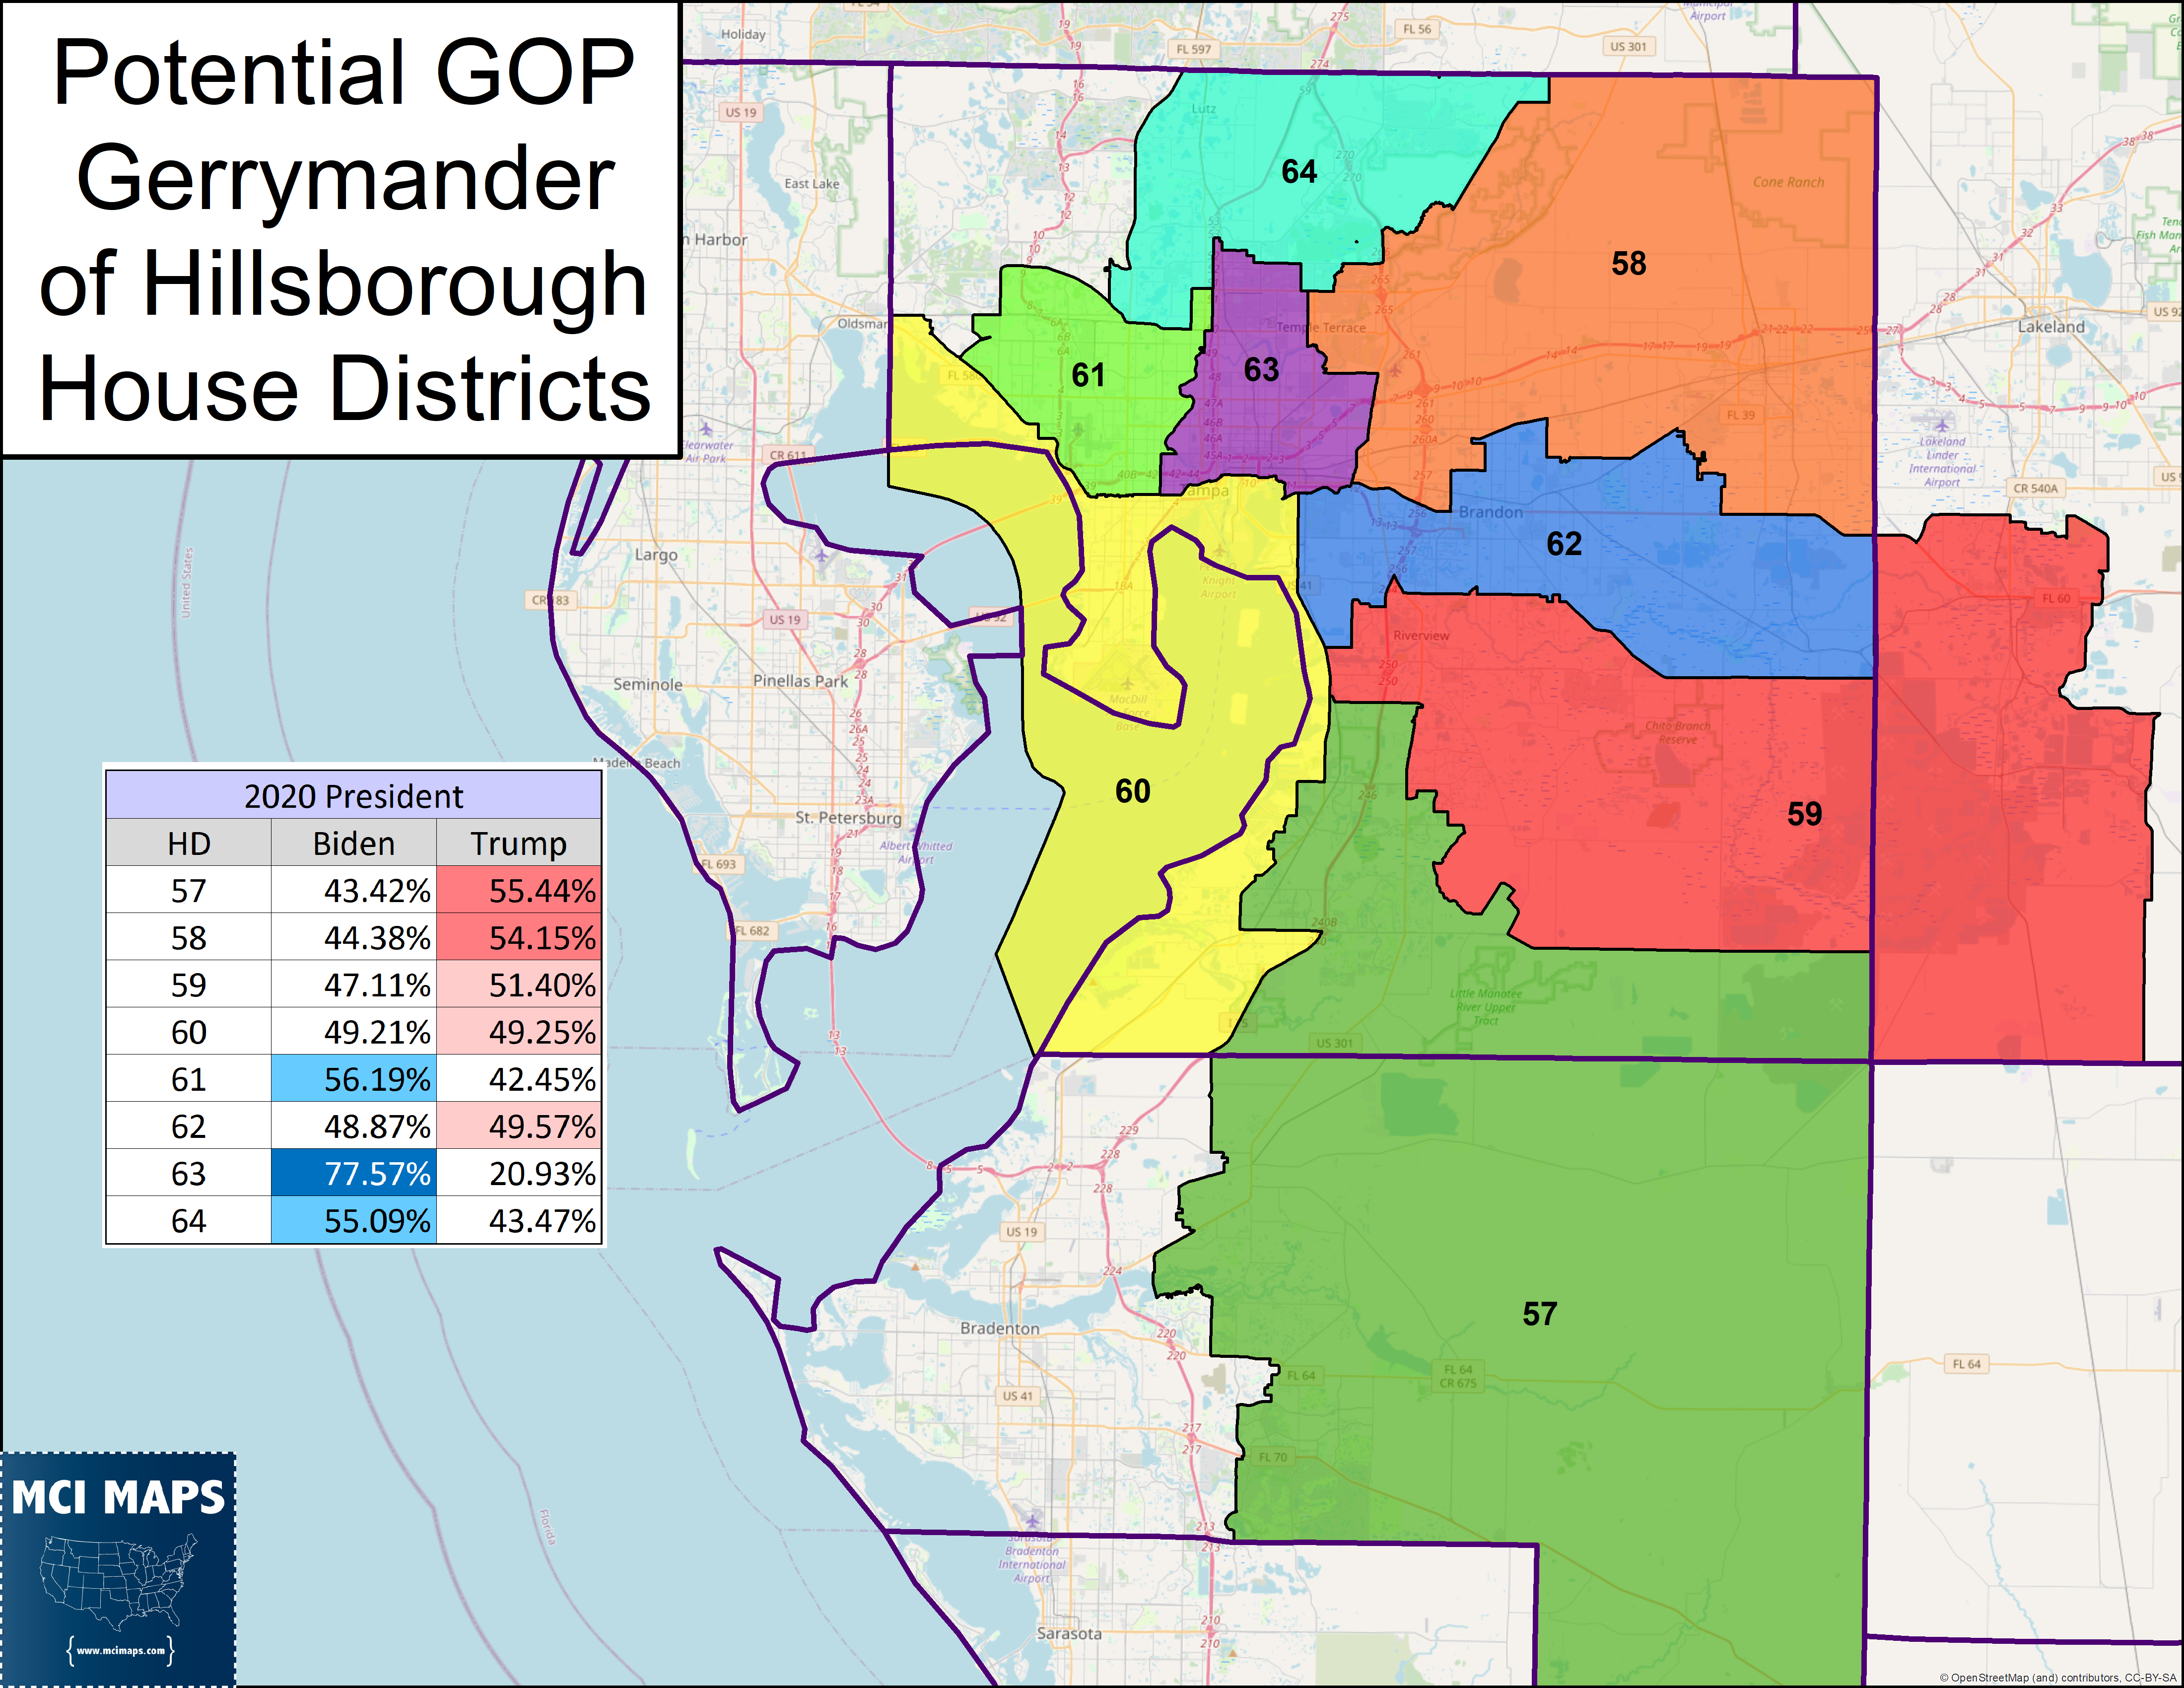
Republicans can get rid of the two narrow Obama districts along I-75. However, districts 62 and 59 are not safe and could easily turn blue as population growth continues.
At that point, you wonder if the GOP might like my idea about an African-American access seat. While this would create a new deep-blue seat, that would be better than two lean-blue seats, or two lean-GOP seats they have to constantly worry about. The creation of the access seat could give them more options further into east Hillsborough – keeping the area at 6 Biden seats (like it is now).
As for Pinellas – we’ve already delved into HD70 plenty. The big issue will by HD68, which is located in the northeastern end of St Pete. The seat is currently heavily Democratic. Republicans could try and mess with the district by adding some of its precincts to 70 and otherwise moving its borders further inland to grab GOP areas.
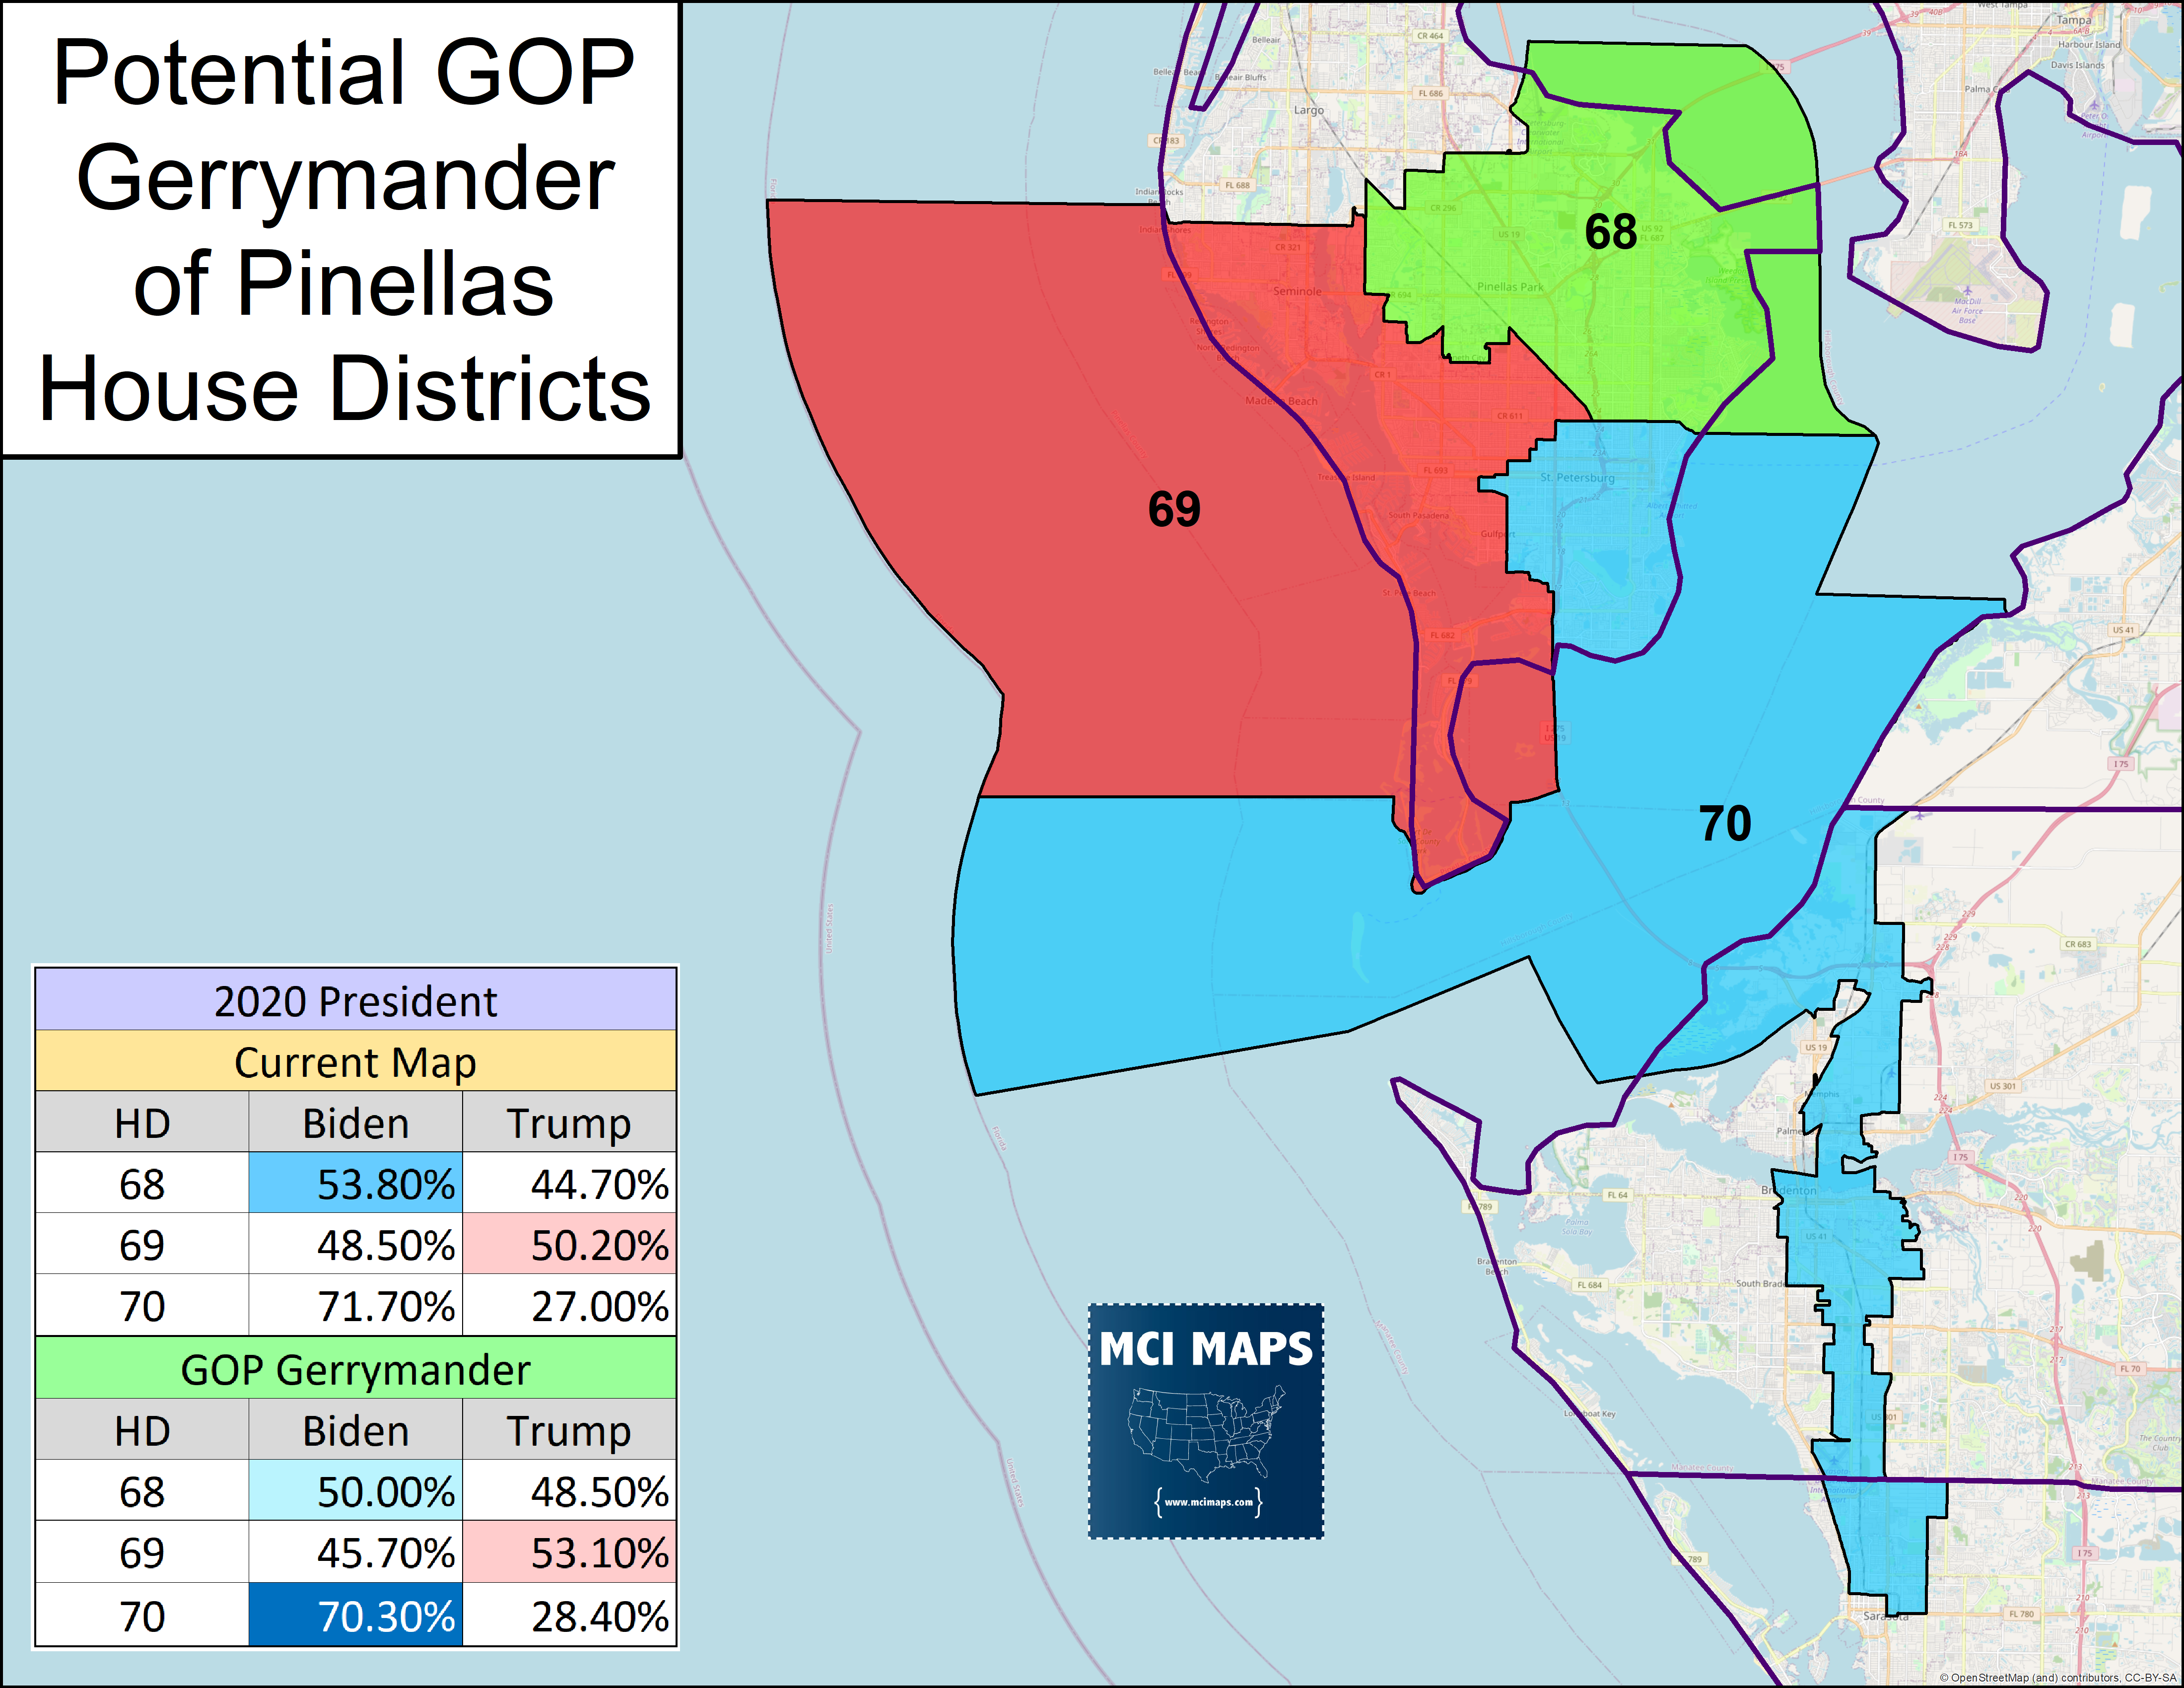
This plan would make 68 a narrow Biden seat, which would be harder for Democrats to defend in a midterm. Other plans to could make it a narrow Trump seat. This plan also made HD69 more red as well. This could leave Pinellas with just HD70 as a Democratic seat.
Conclusion
The Tampa Bay region has a great deal of potential regarding how its lines will be drawn. The big question will be, do the Republicans draw a map that reflects the diverse growth in the Hillsborough area?
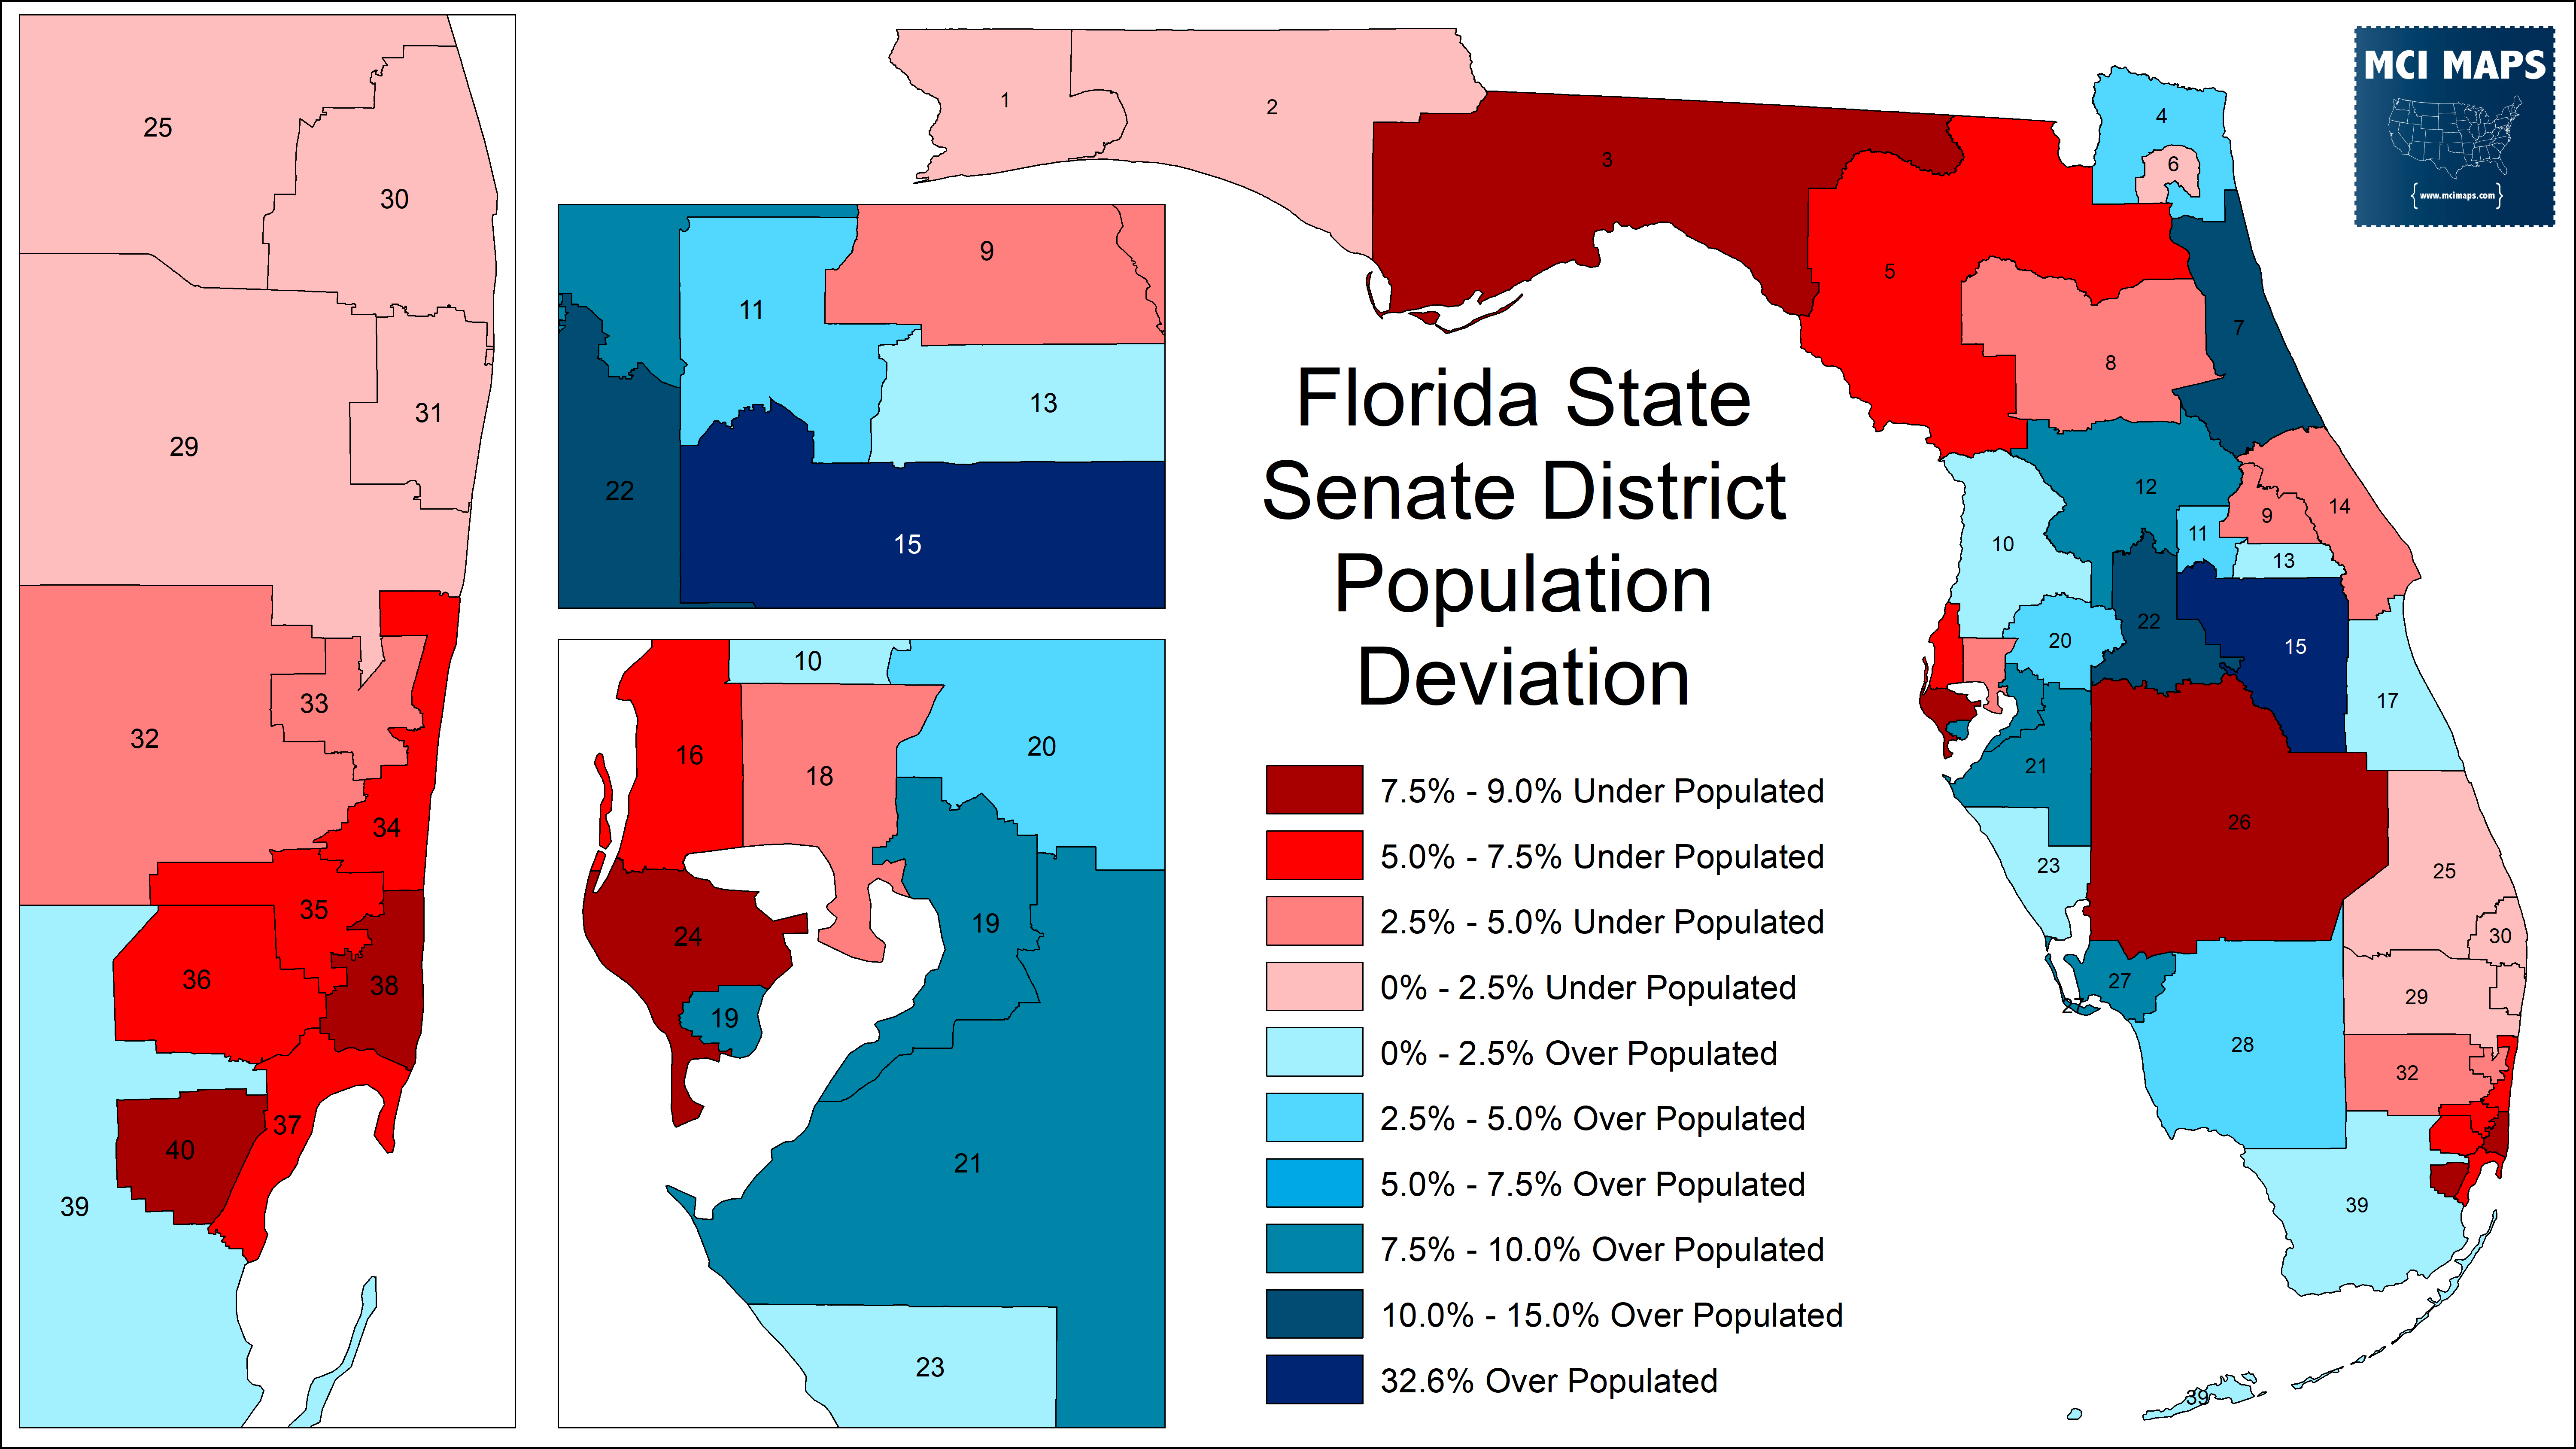
On this very topic, we will spend the next article looking at the Florida Senate districts in the Tampa Bay region.