This week marks article #2 in my series on redistricting possibilities across Florida. Each week I will look at an area of Florida and hypothesize how the maps may turn out.
Series Explainer
The goal of this series is to take a look at different areas in Florida and see how the legislative lines may end up. These articles will focus on how lawmakers may draw districts to accommodate changing populations. I will talk about different areas, what mandates (namely minority representation) they have, and what might need to happen due to population changes. I will also, at times, examine what efforts to gerrymander a region will look like. After the 2012 gerrymandering was discovered by a Florida Court, I believe it is appropriate to treat legislative intent with some healthy skepticism. “Fair maps” can – at times – be in the eye of the beholder, but the goal will be to identify what would likely be partisan decisions by lawmakers.
I highly recommending reading my History of Florida Redistricting series – as many mandates and norms we have in our maps are a product of that history. Prerequisite reading is absolutely my 2022 Primer Article – which covers which districts are under-populated and what the racial benchmarks are.
The full spreadsheet of district stats – including population and racial makeup – can be found here.
An important glossary to remember:
- BVAP = Black Voting-Age population
- HVAP = Hispanic Voting-Age Population
- Functional Analysis = using political turnout data to confirm minority performance in a district. Utilizing both general election and primary election performance for parties and racial groups.
Lets begin this series by looking at Orlando’s metro state house!
Orange State House
This article will focus on the metro Orlando area state house map. This will broadly look at the counties of Seminole, Orange, Osceola, and Polk – counties all part of the infamous I-4 corridor. For a political background on the I-4, read this article I wrote in 2020.
Population Changes
The Orlando metro zone, and the I-4 broadly, have been the home to massive population gains. Osceola’s 44% population increase is the largest in the state.
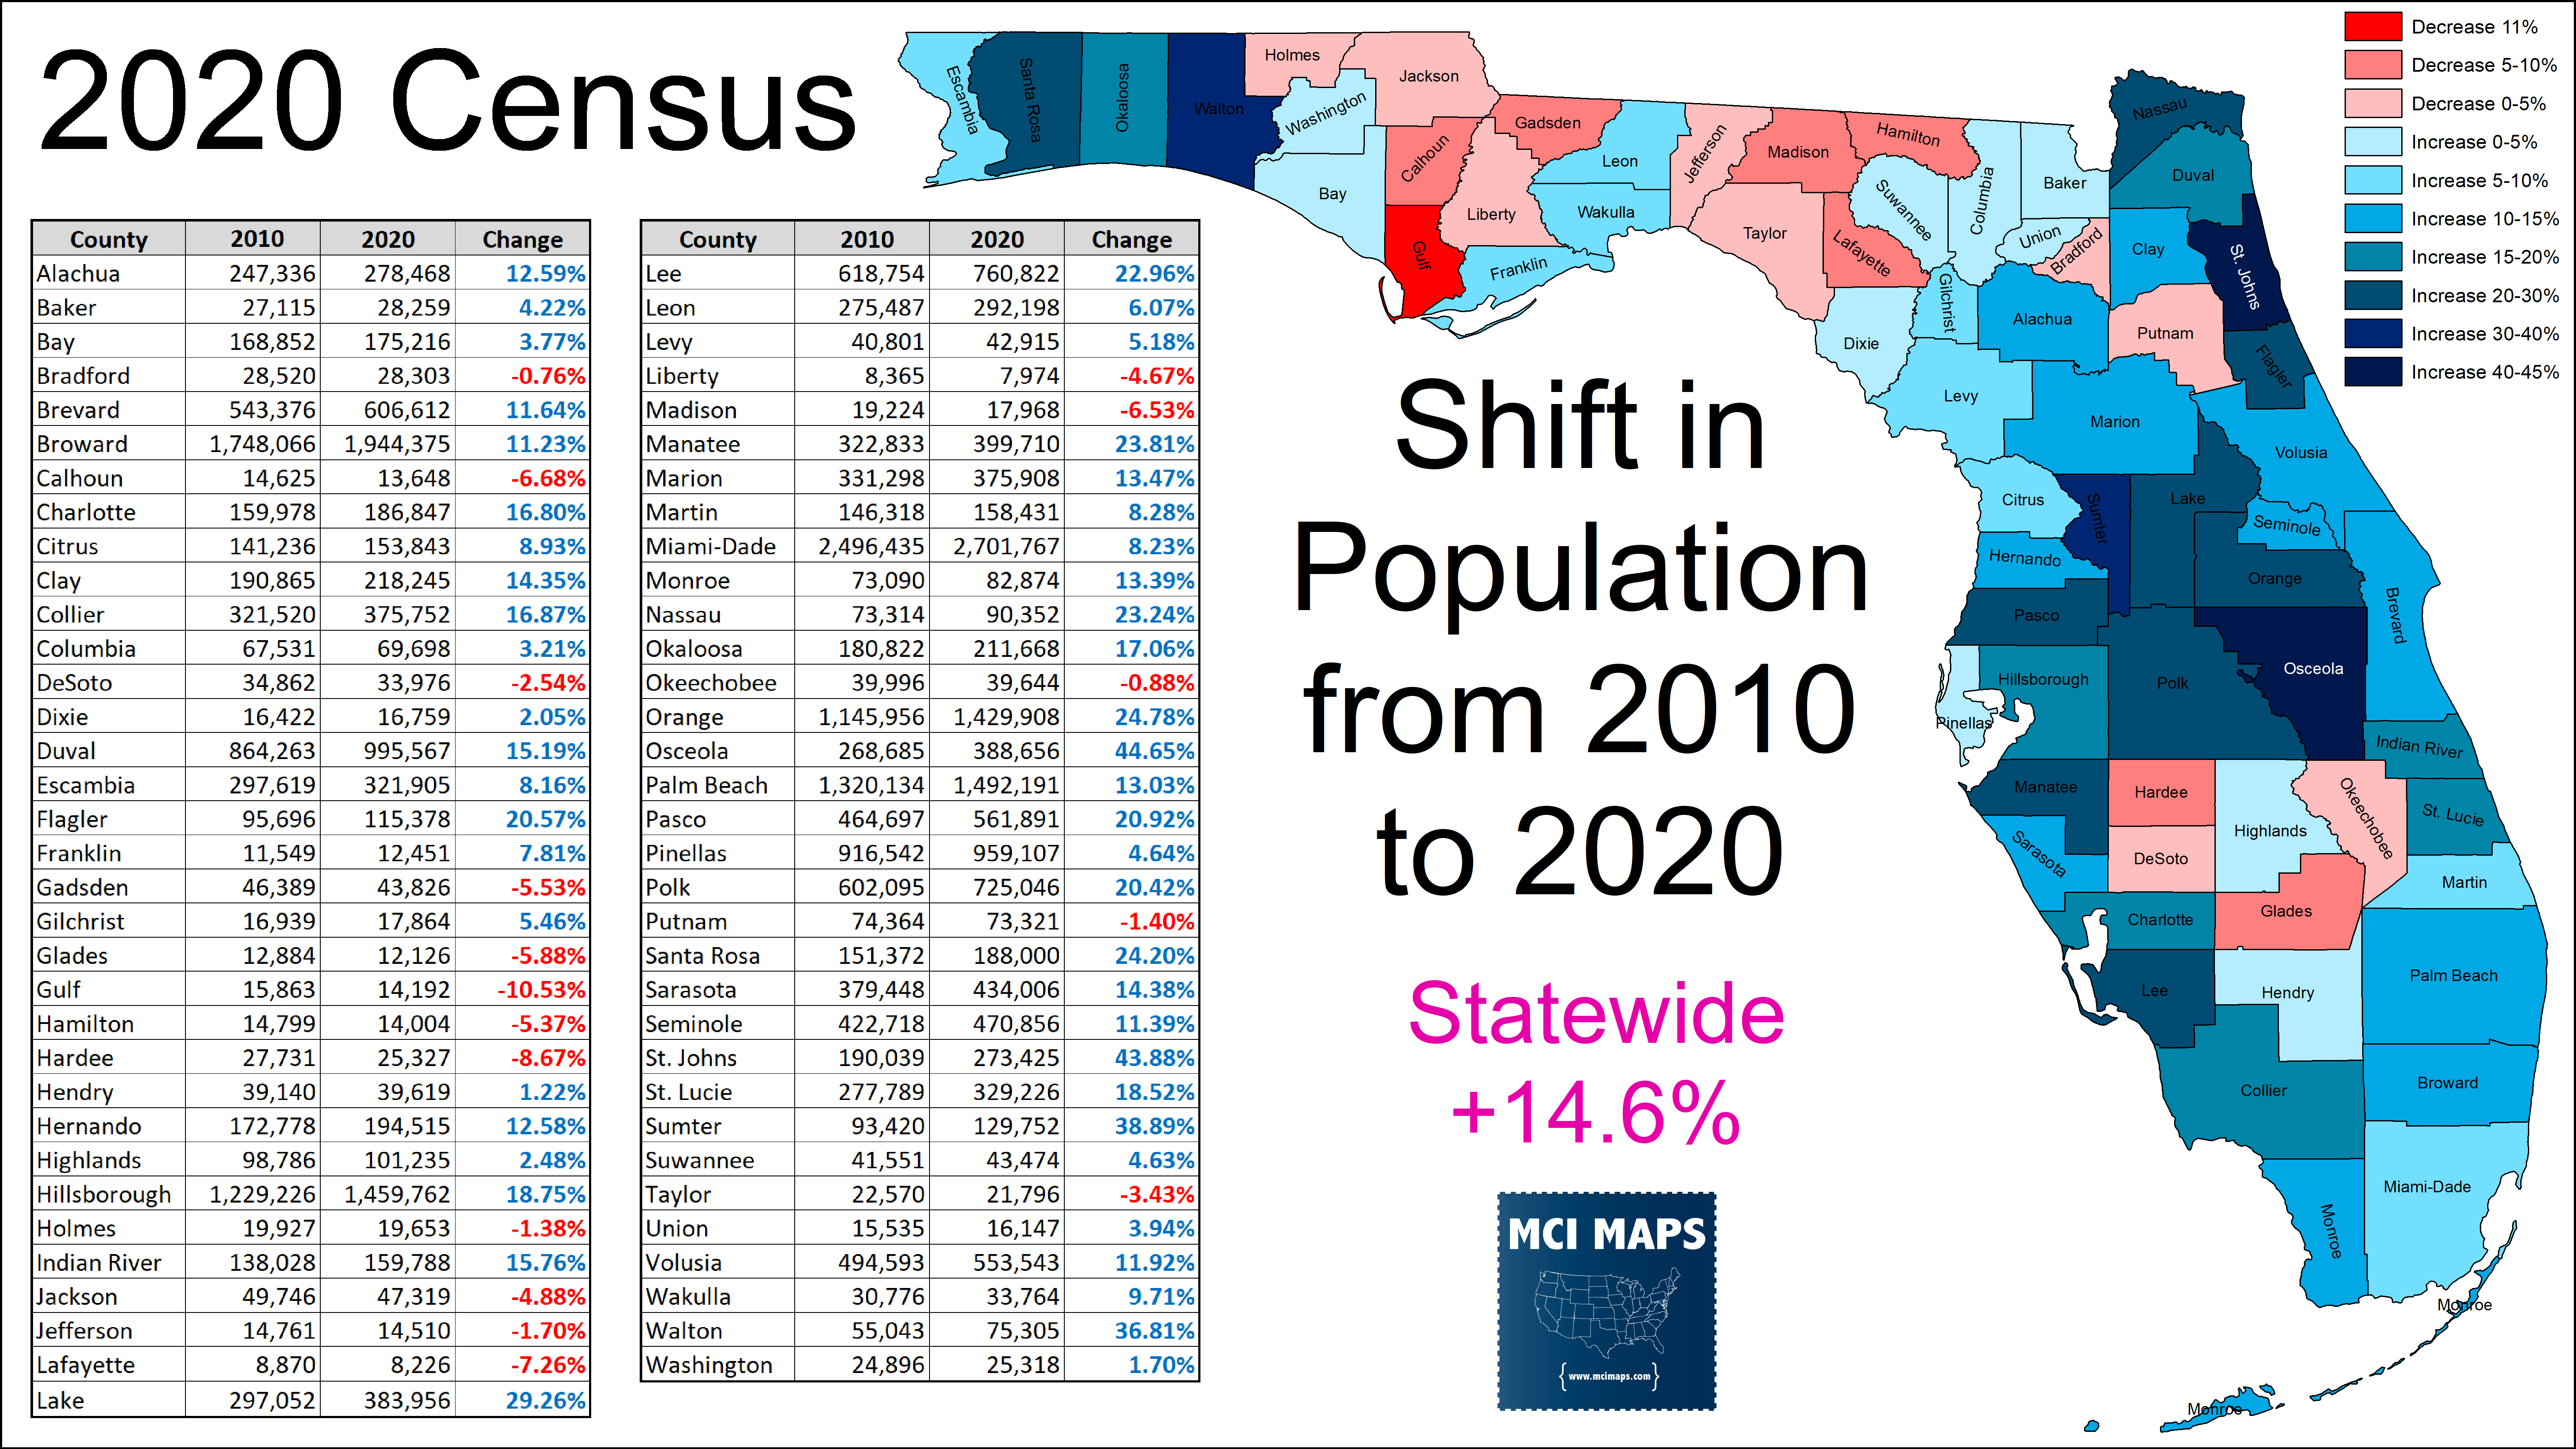
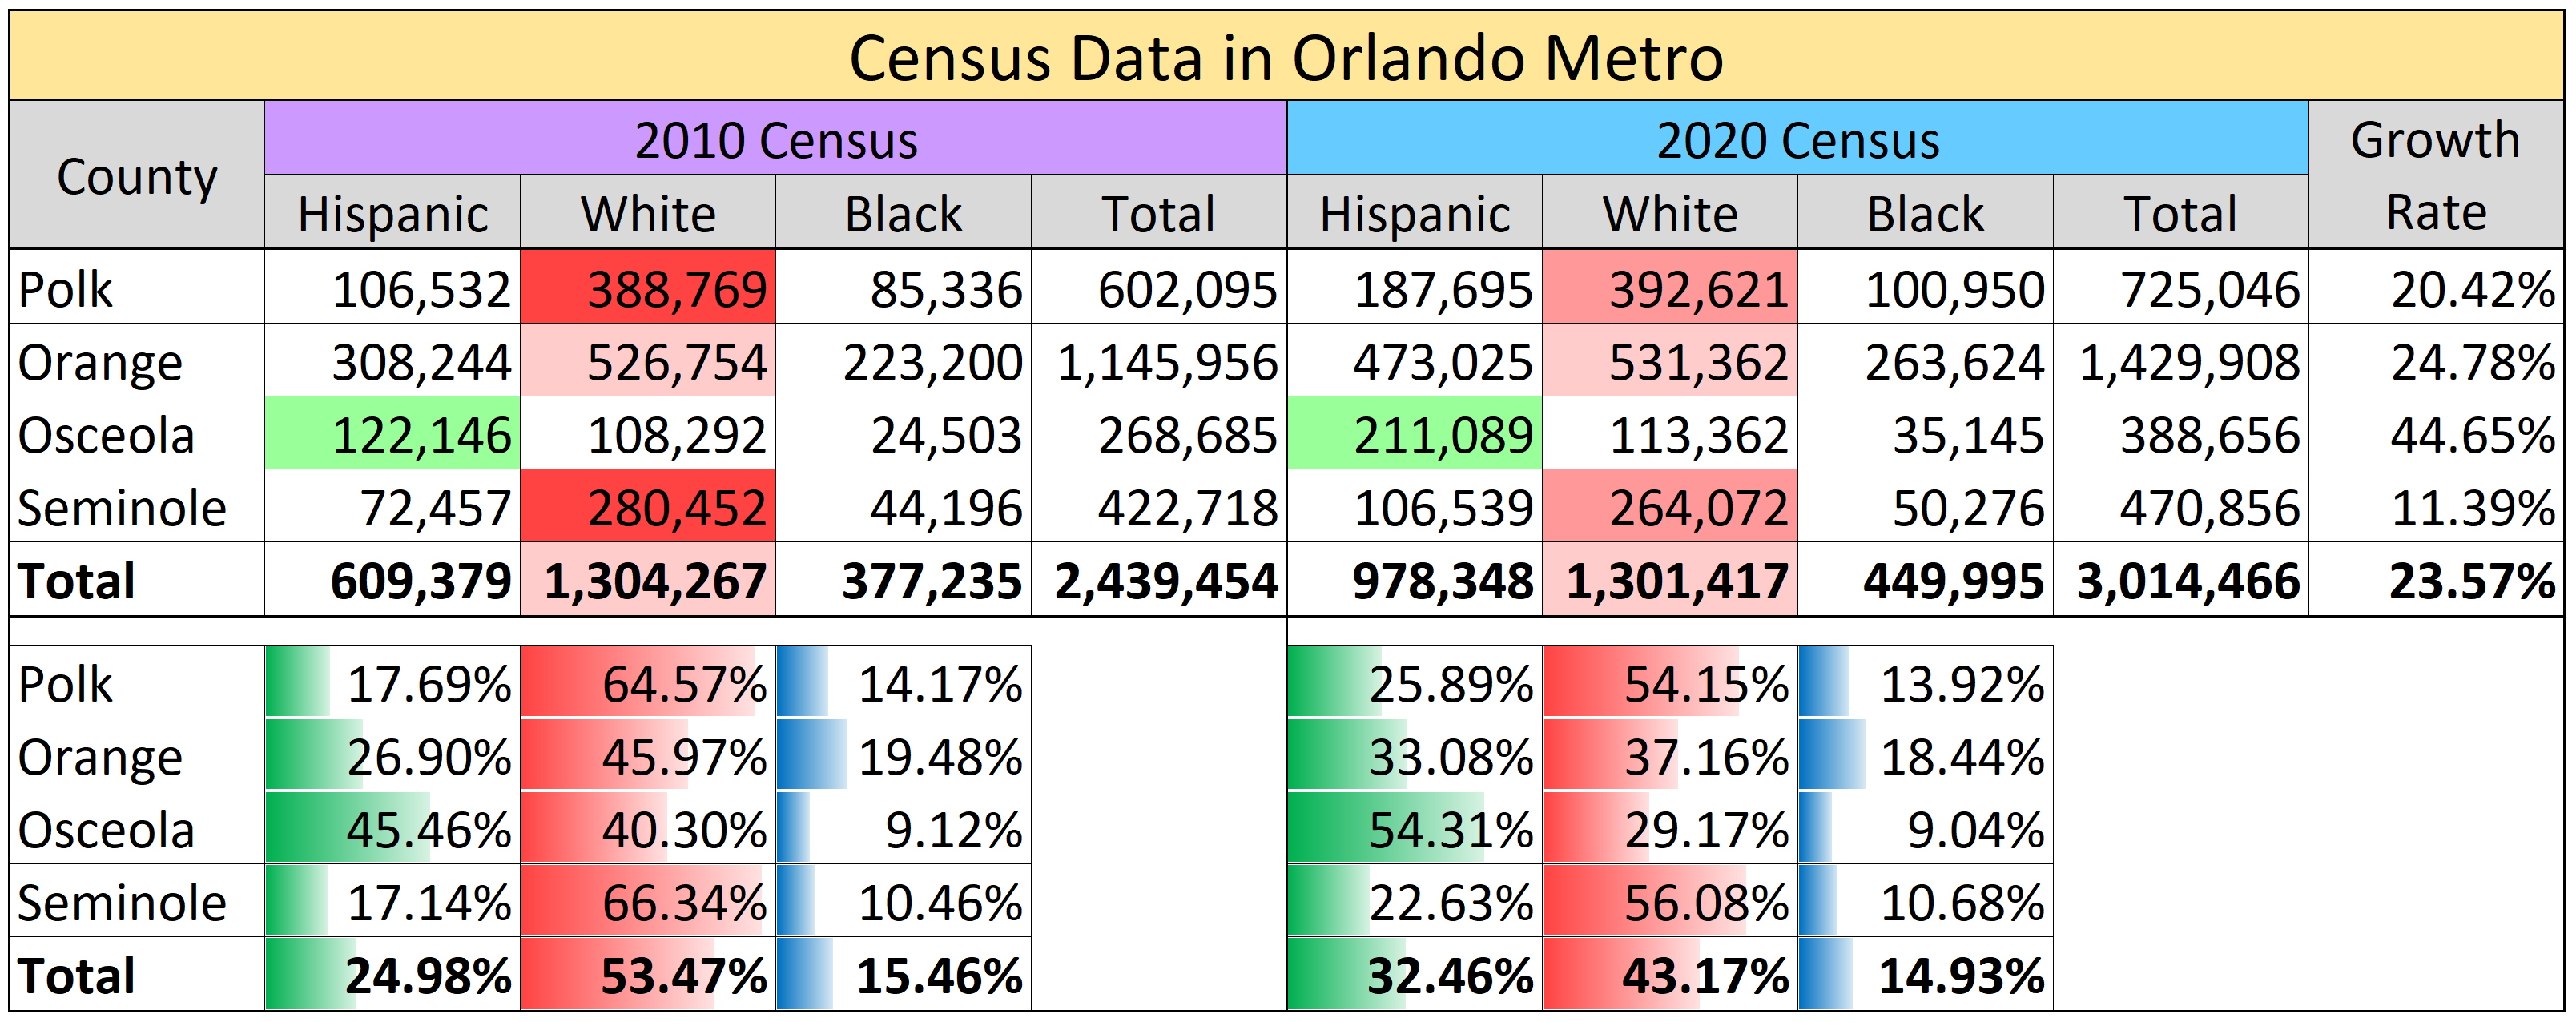
These four counties I will be covering all increased their population by 24%. With that growth has come increased racial diversity. In these metro zone, the population is no longer majority white. Hispanic residents have gone from 25% to 32% of the population.
Hispanic growth in the region has already been seen at the voter registration level. A corridor of Hispanic, largely Puerto Rican, voters exists along the Orlando to Kissimmee region.
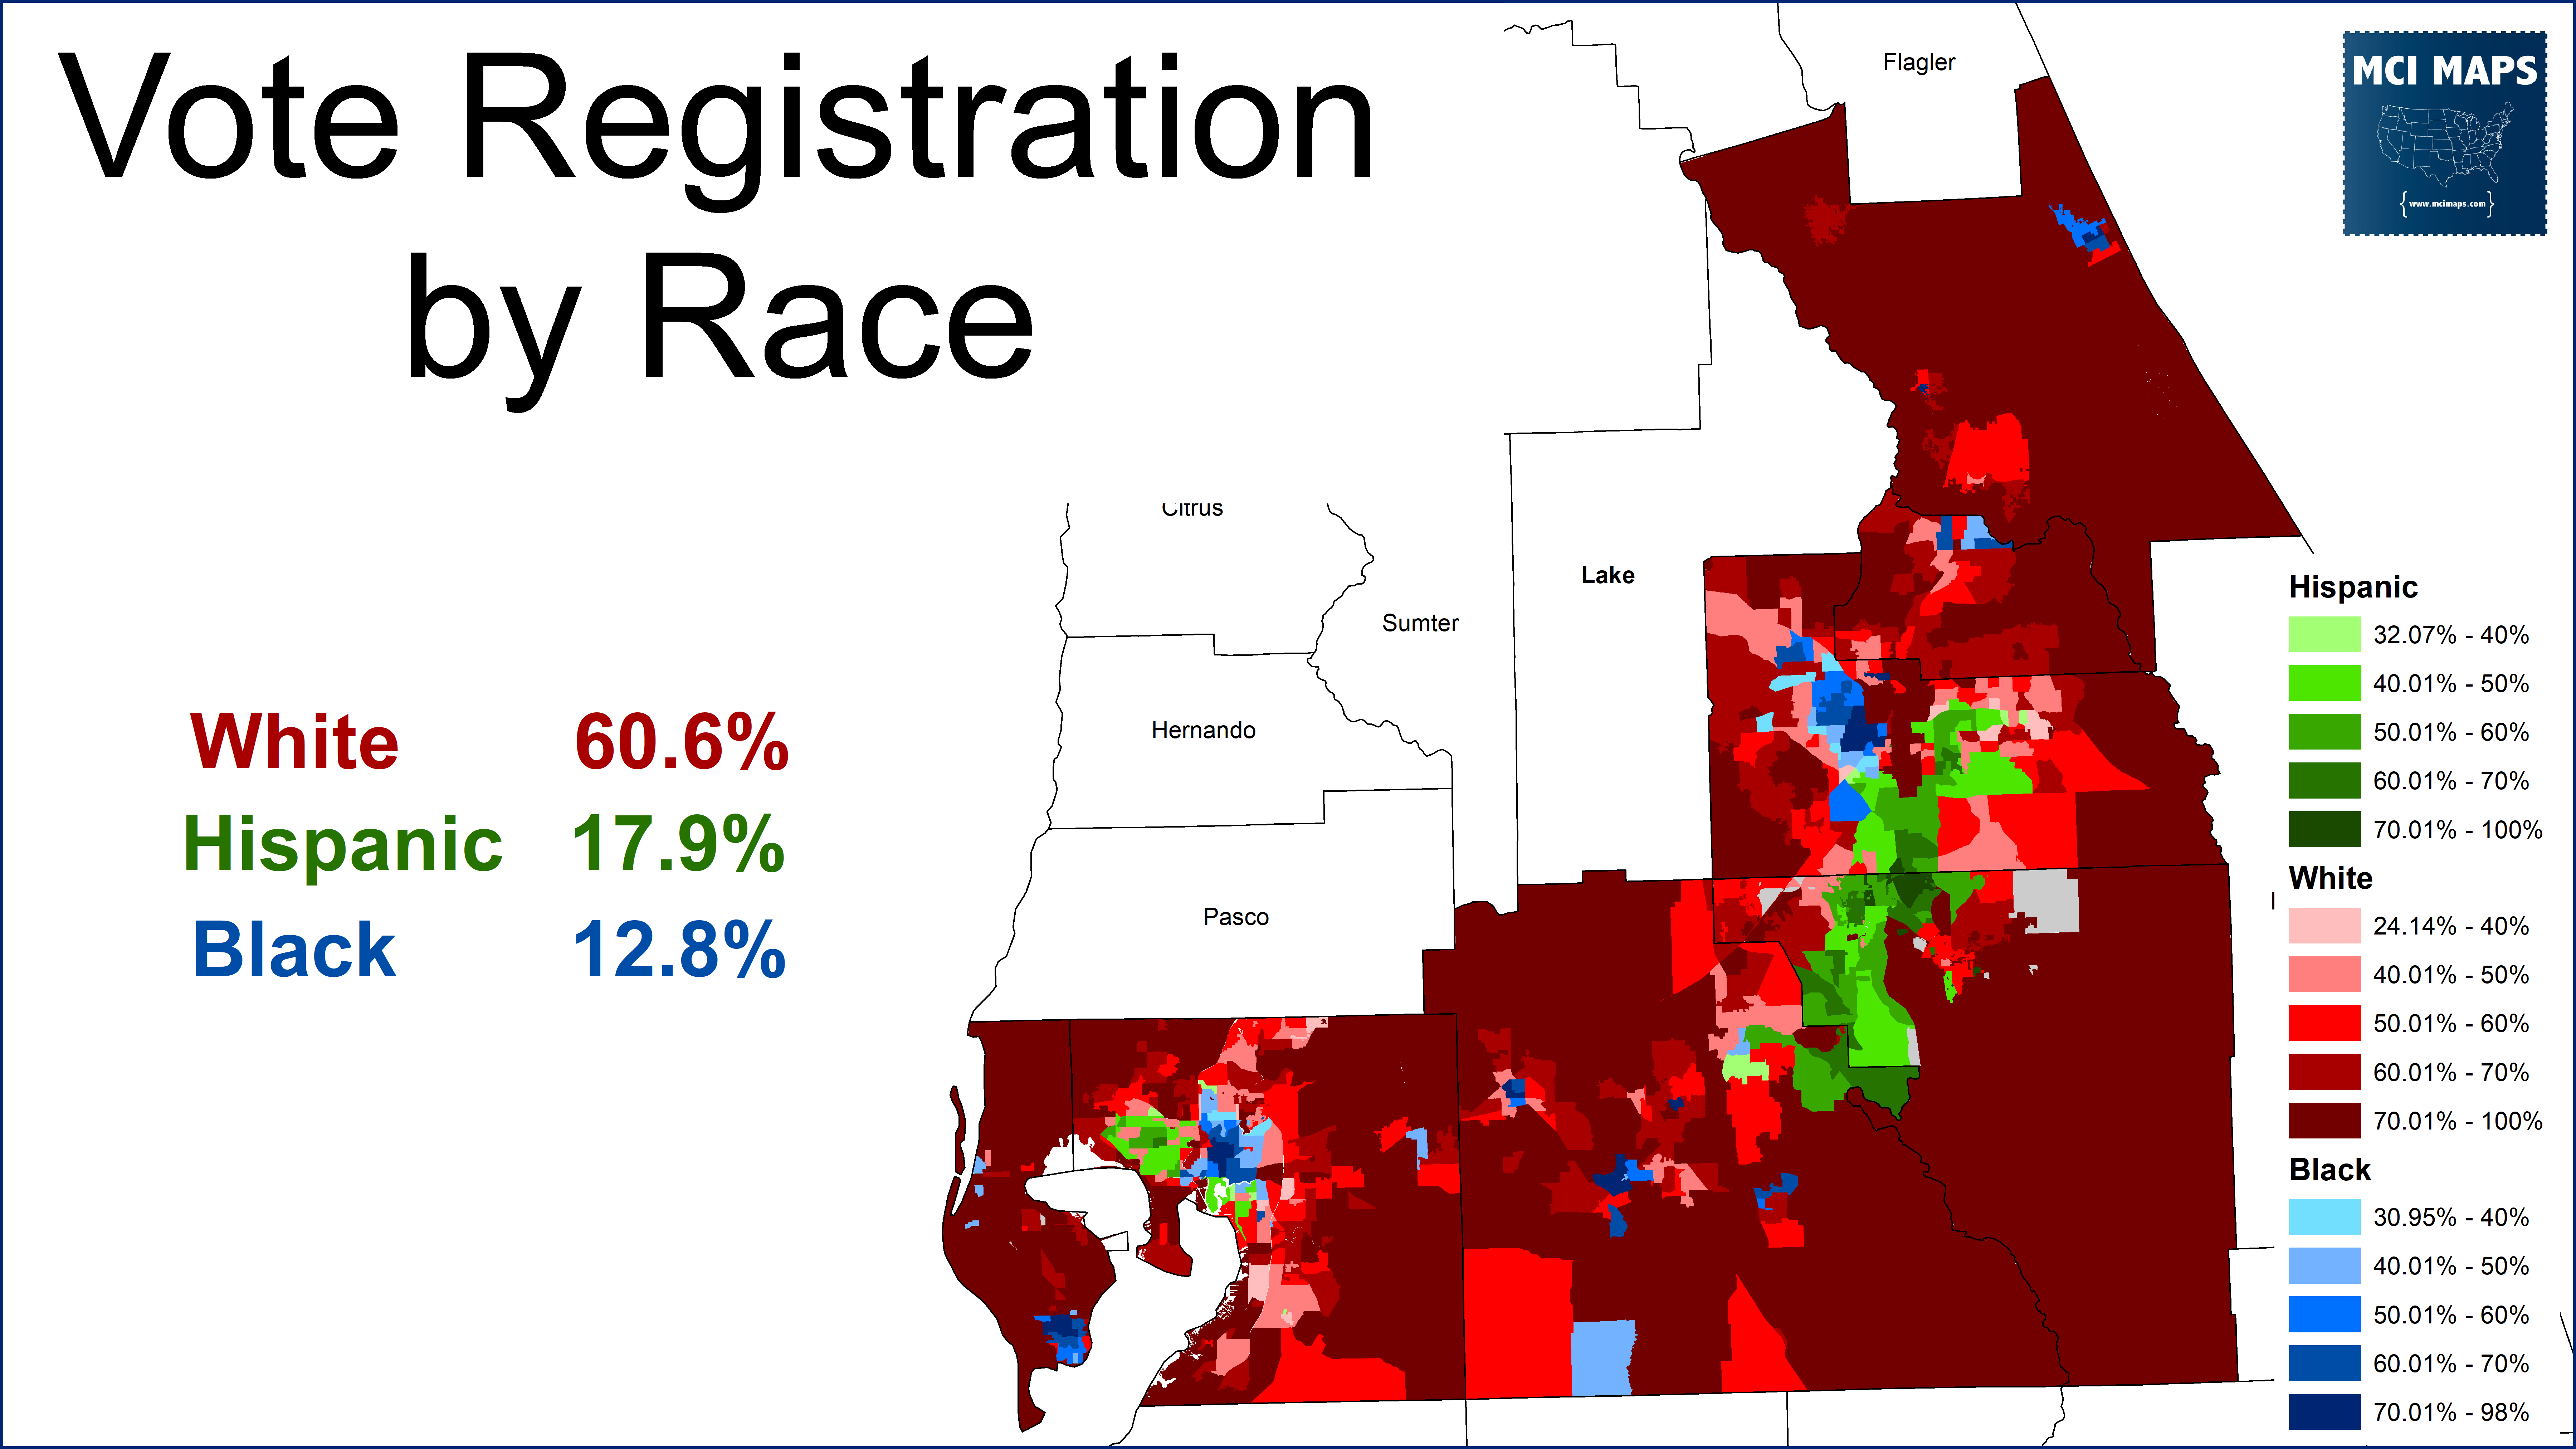
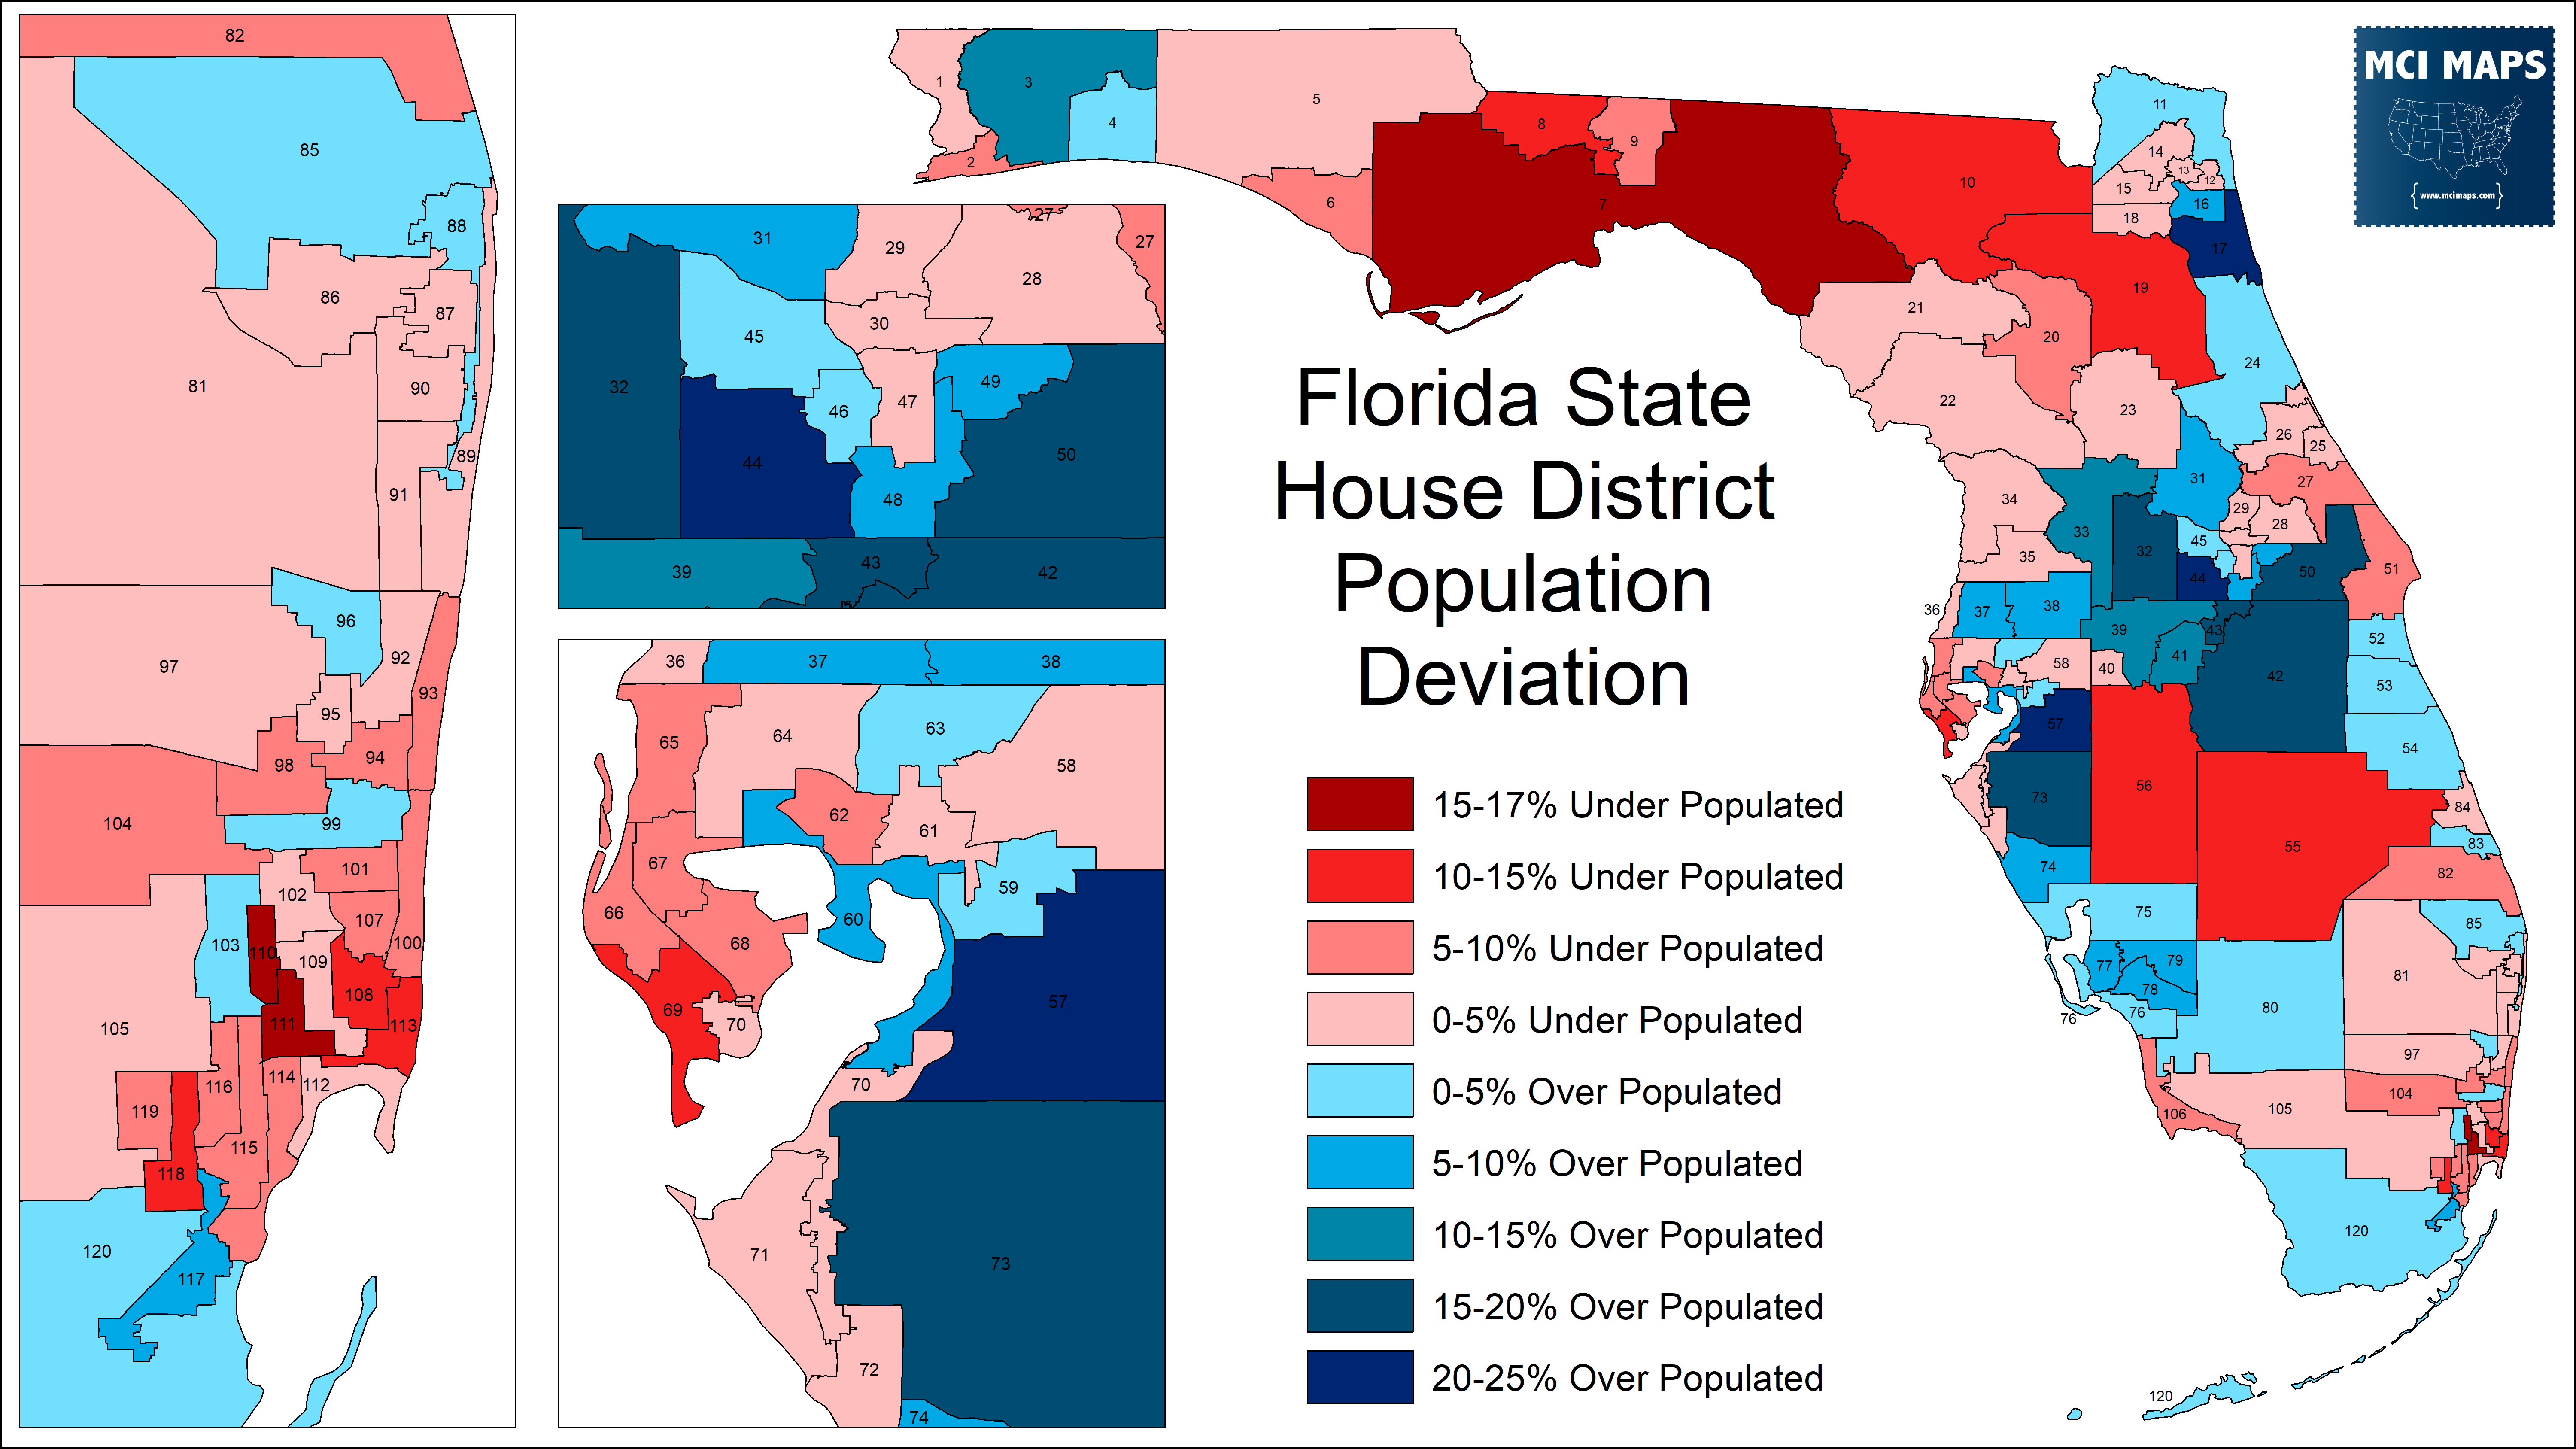
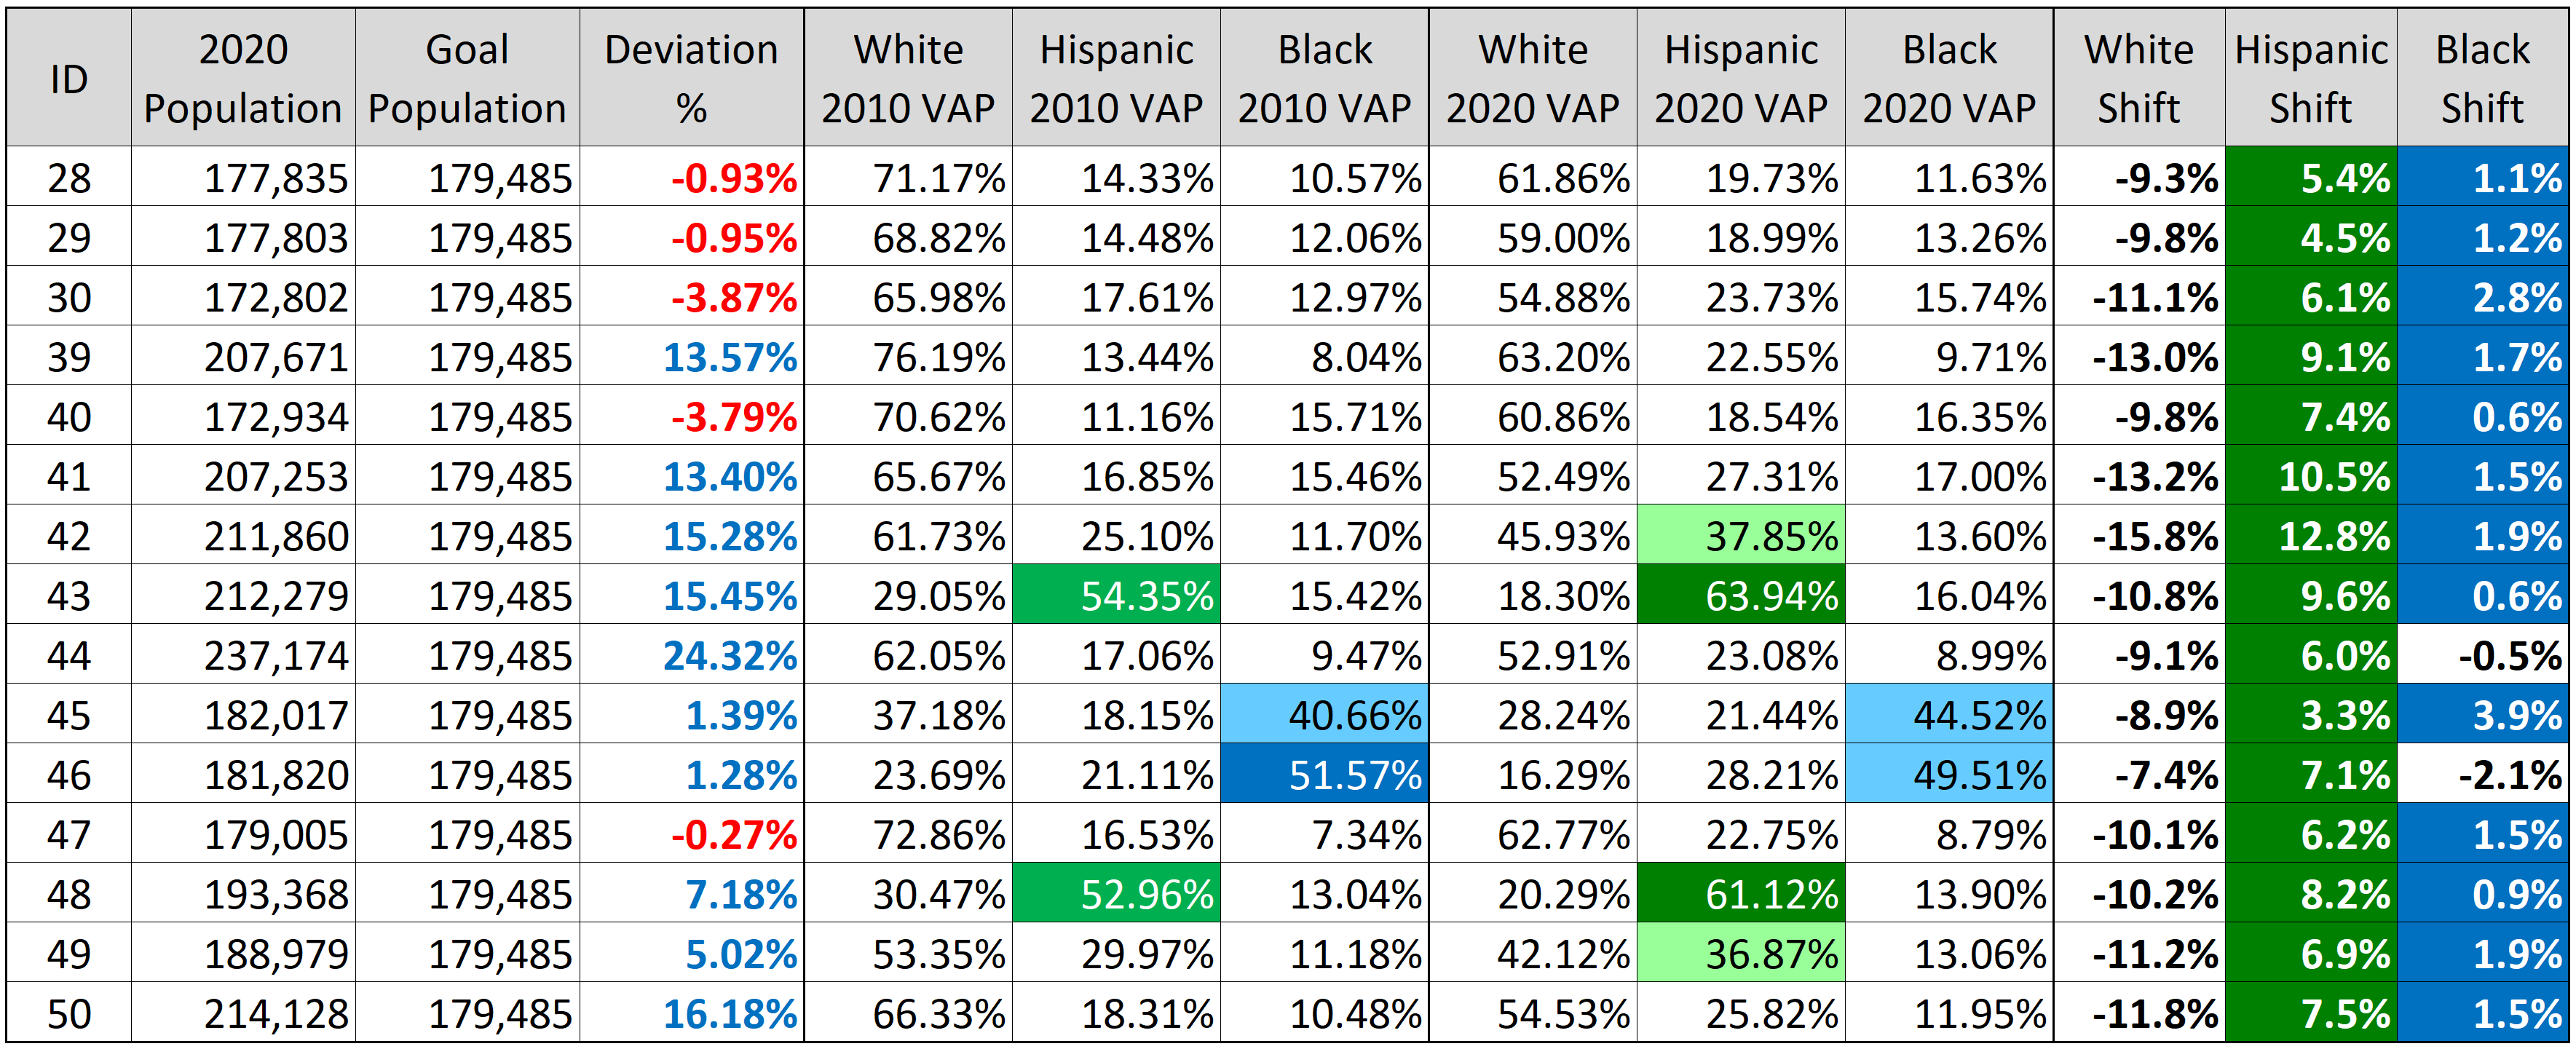
The growth in population and Hispanic population means that all state house districts within the four counties saw an increase in their Hispanic makeup. The 2010-2020 population data for the below house districts shows that the two majority-Hispanic districts in 2010 have now surged in Hispanic makeup. Most districts are also overpopulated, some by large %.
The four covered counties have seen so much growth that they are entailed to an entirely new state house district. The four counties could previously hold almost 16 districts within their border. Now they can fit just around 17.
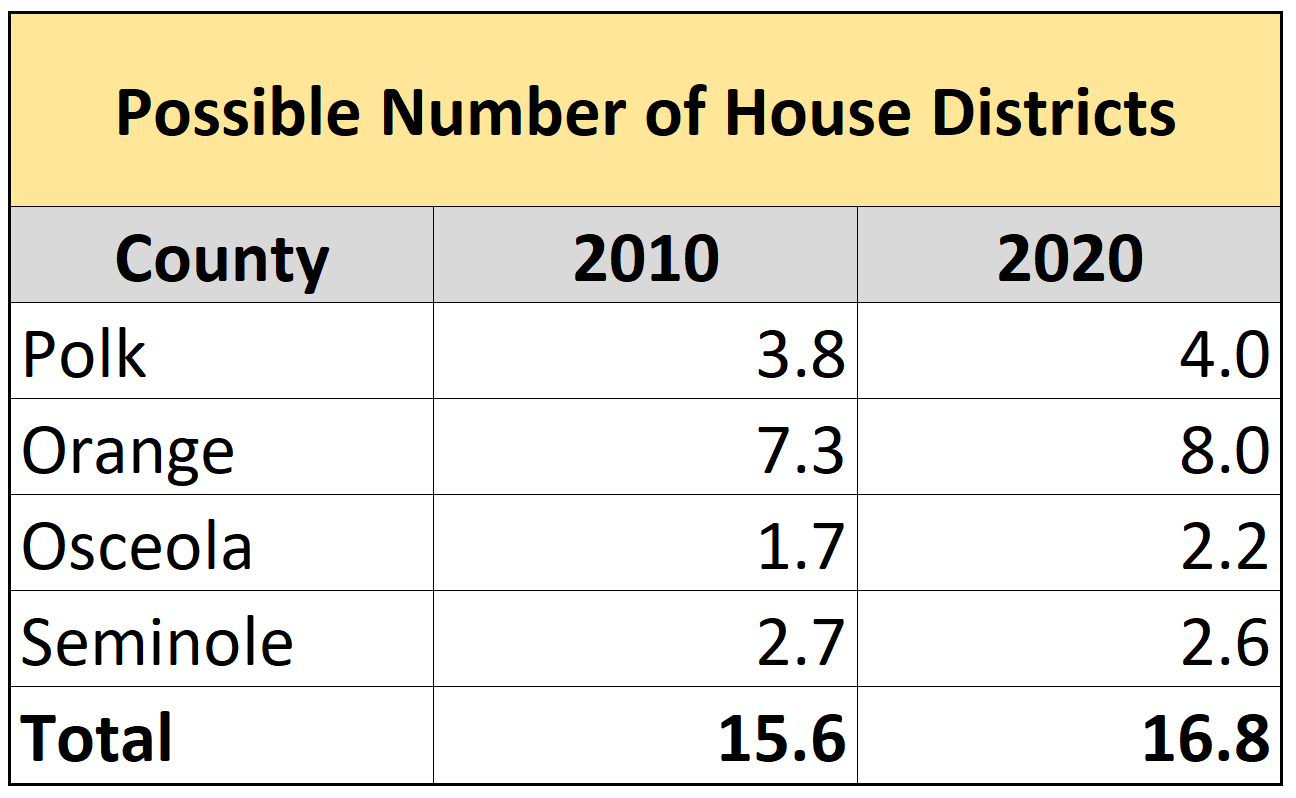
Obviously how districts line up with county borders can alter their numbers – but the data shows a region that is going to have more districts within or overlapping with its borders.
Possible Fair Map
In working on a draft map for the Orlando metro region, I had the goal to preserve minority districts where they existed, but also I aimed to increase minority districts in-line with population changes. The Hispanic community is undoubtedly entitled to additional districts. After a great deal of time, the districts below are what I come up with.
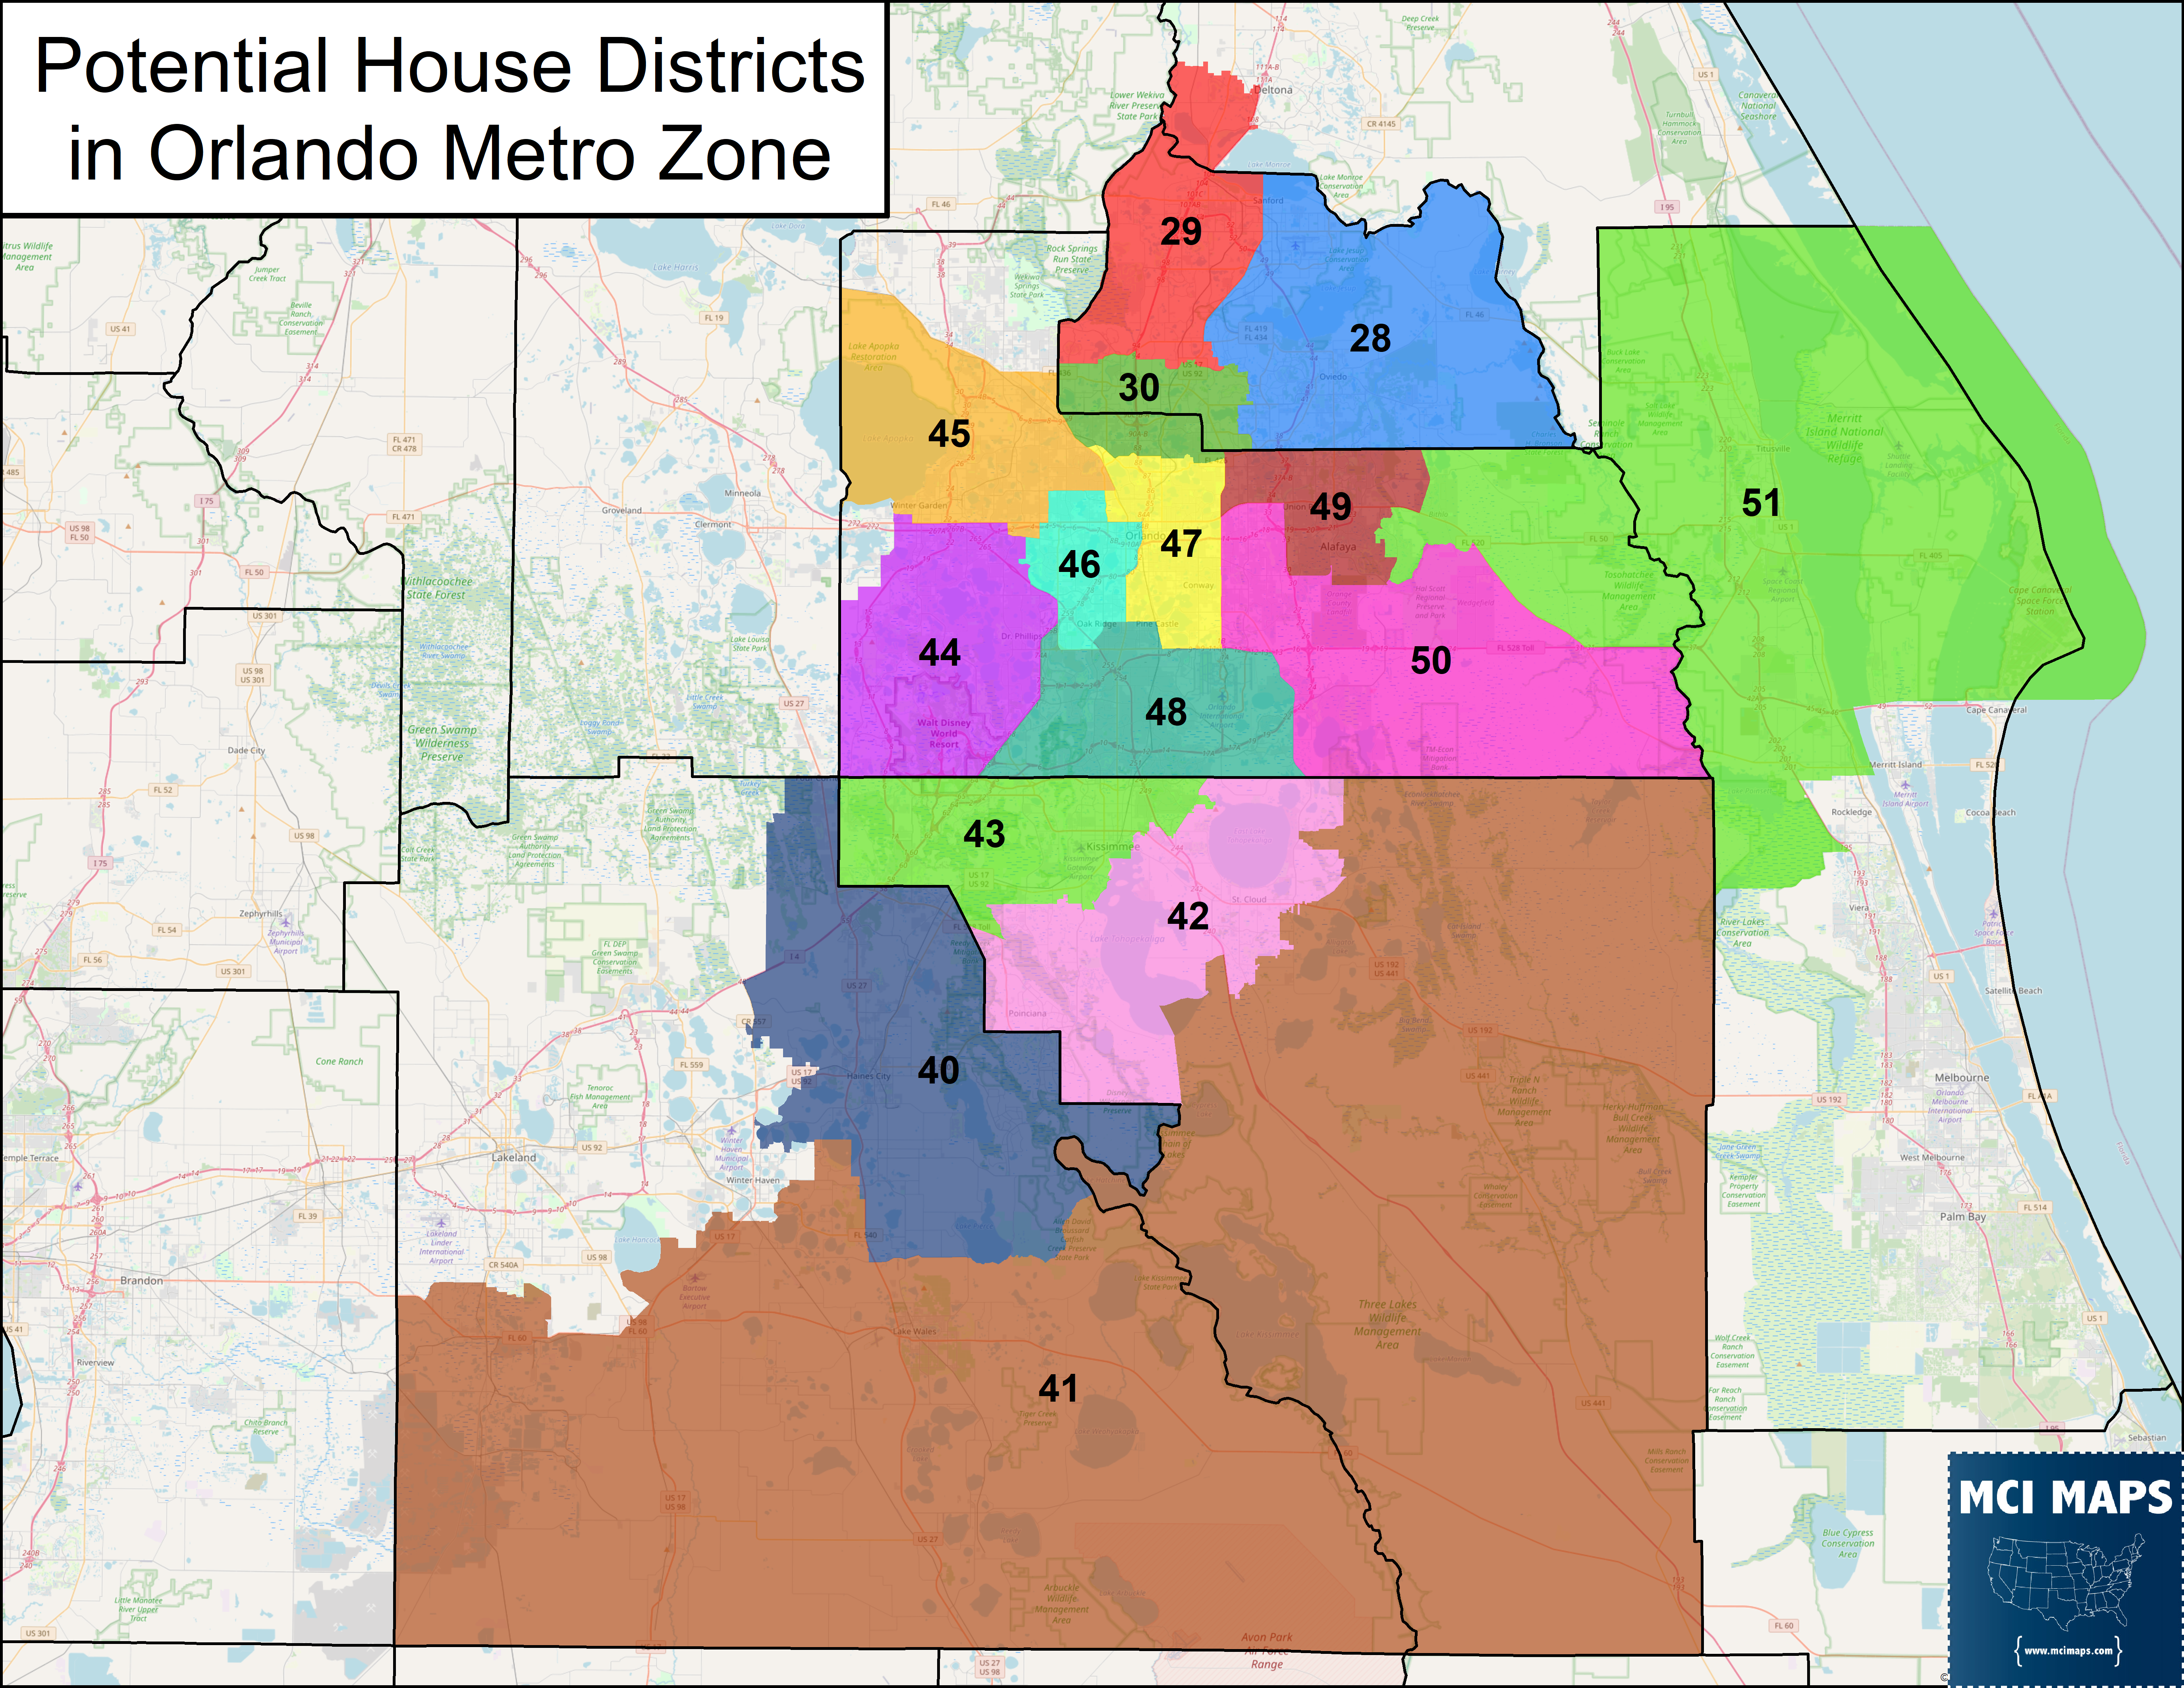
The map may look similar to the current plan in specific areas. Districts around Seminole and NW Orange could be left in some form similar to their current makeup. Orange county gets the extra district while Osceola gets two seats nestled within its borders.
The racial makeup of the plan is below. The map has FOUR Hispanic-majority districts, up from the TWO in the current map.

In my redistricting history series, I talked about the need for super-majority Hispanic % in many Miami-Dade districts. The situation in Dade was that large refugee populations meant a large non-voting population. In Orlando this is less of an issue – as Puerto Rican immigrants are US citizens and eligible to vote. Turnout dynamics are still a concern – as Hispanics have weaker turnout than white and black voters. What gave me confidence in my Hispanic numbers was that they are close to the same % that the original HD43 and HD48 had in 2010 – and both those districts performed as Hispanic the entire decade.
I also took account of voter registration data. Since all four of these districts would be Democratic, I looked to confirm if Hispanics would make up a majority or the largest block of Democrats in the district.
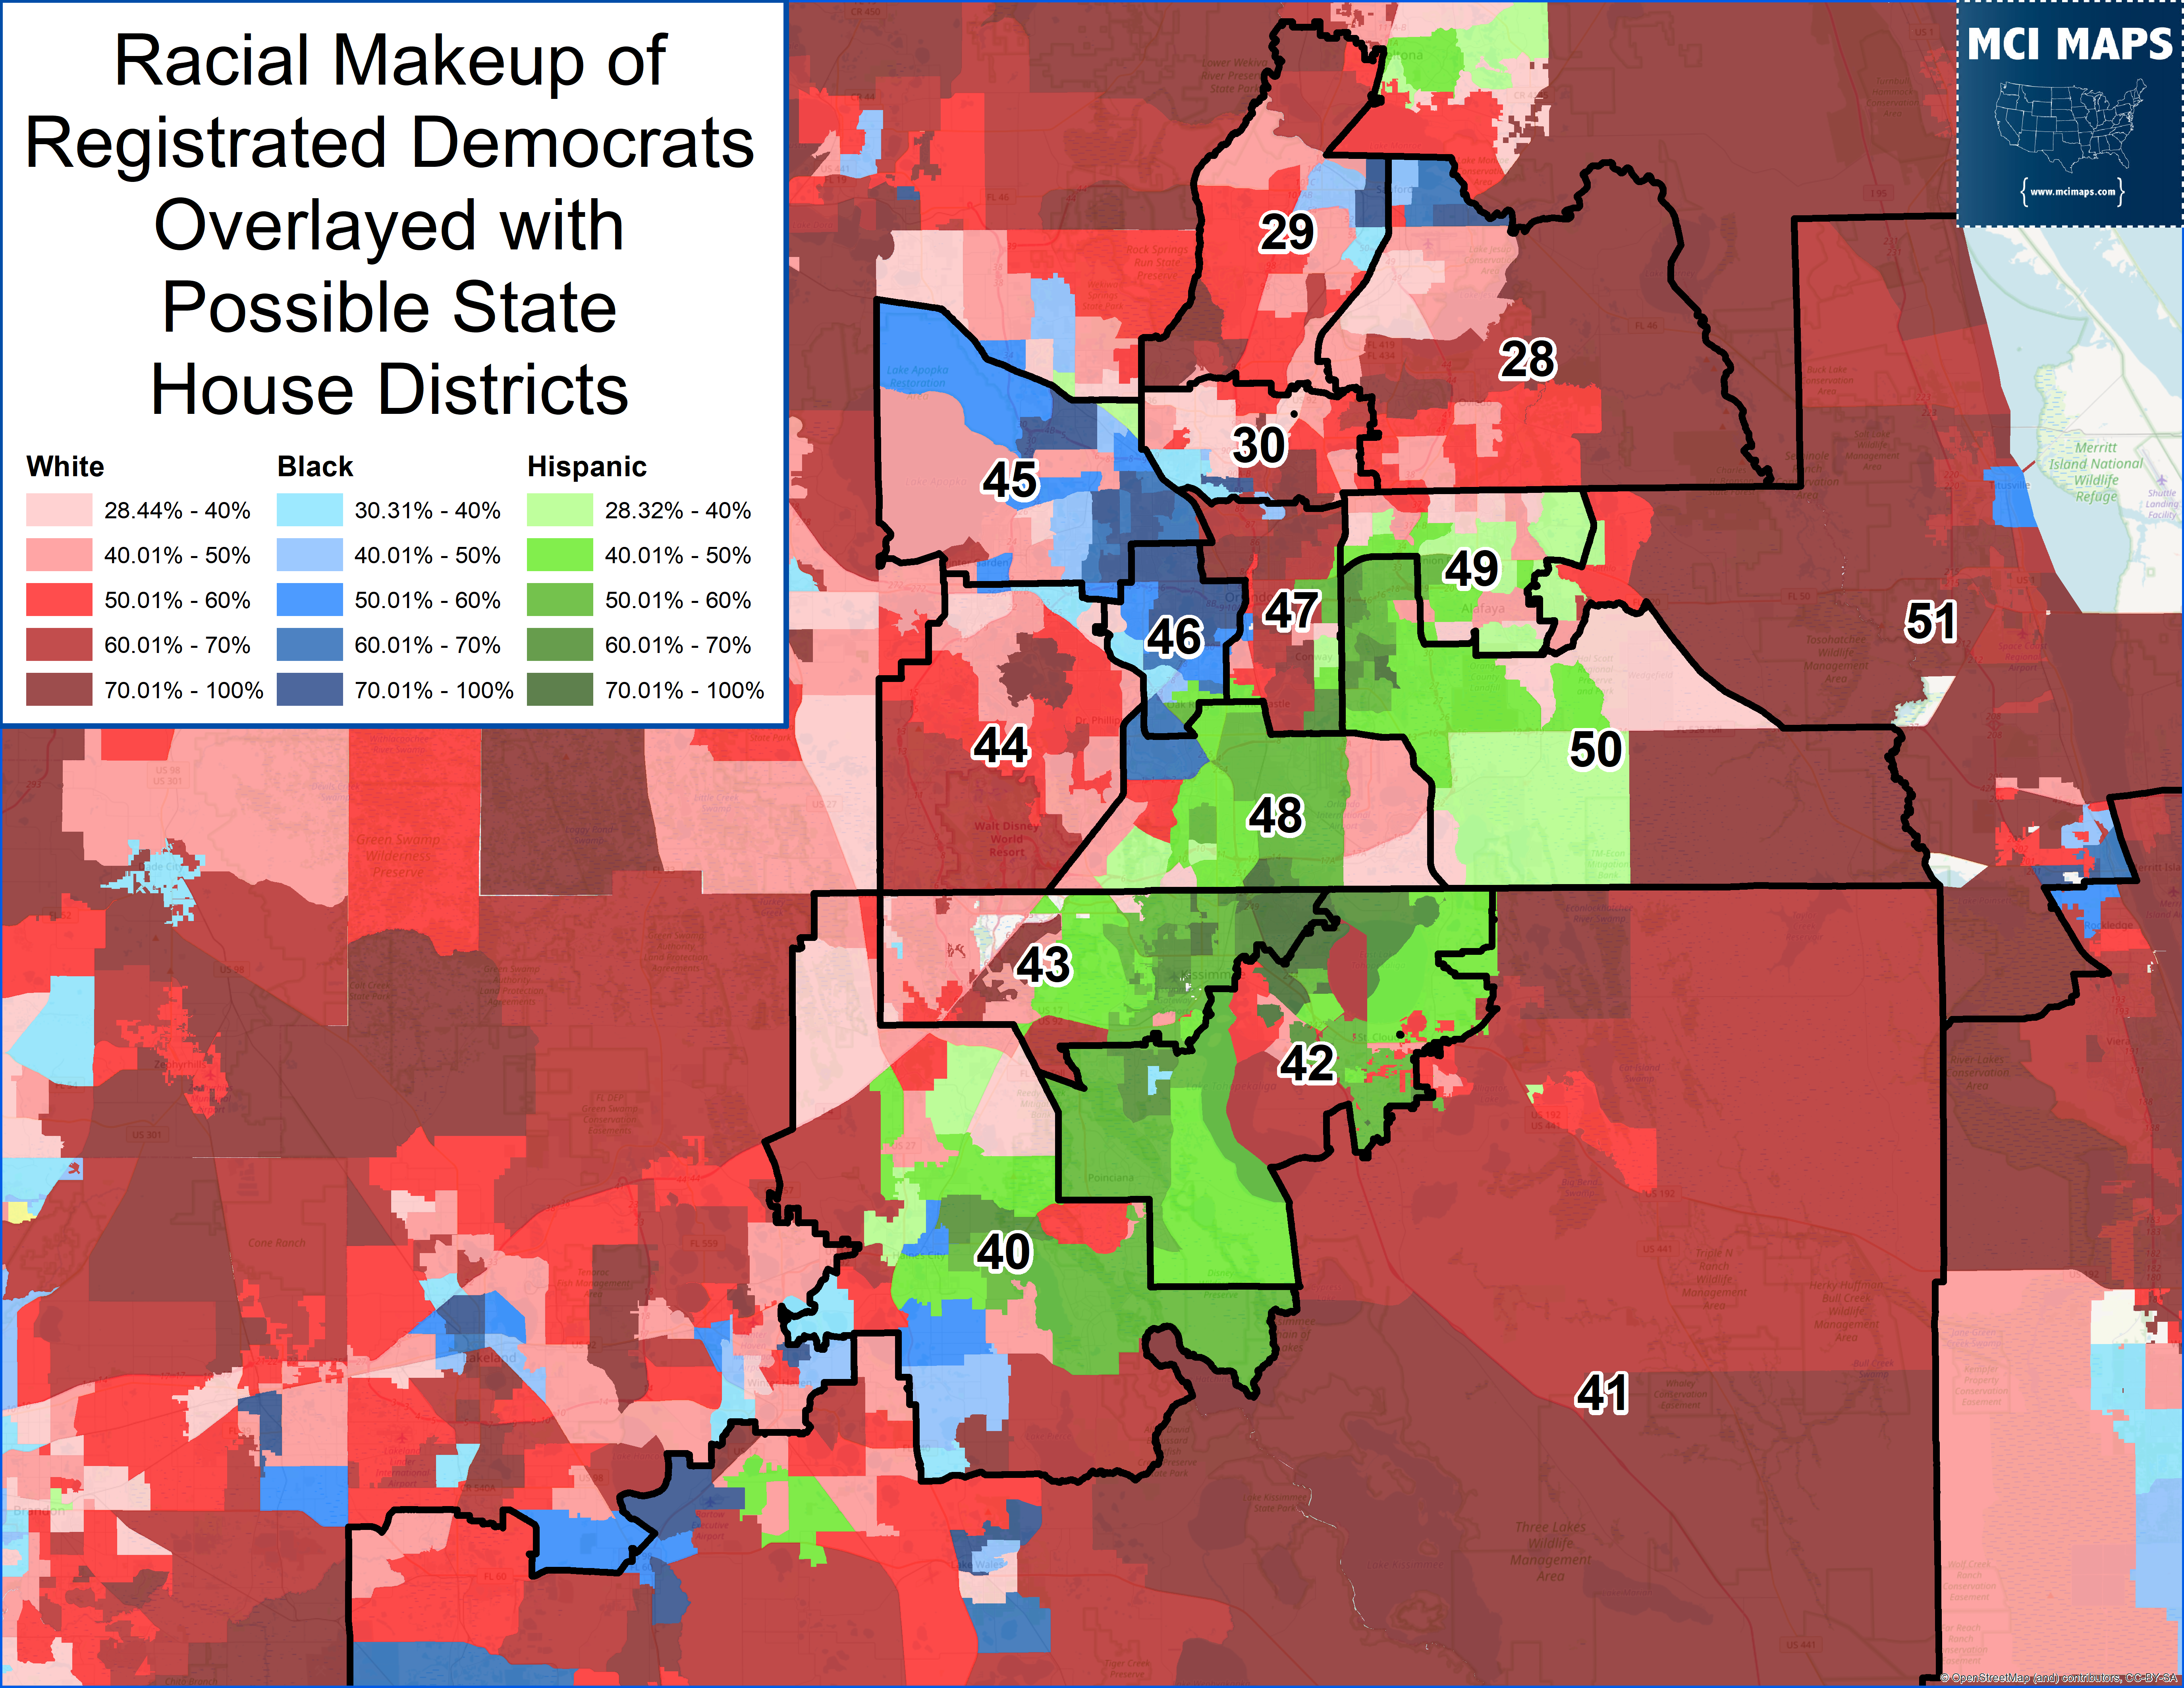
The 45th and 46th, meanwhile, would easily remain African-American performing districts. HD49 and HD40 would be Hispanic access seats.
District Breakdowns
Let me also lay out details for each district
- HD28 – Based out of eastern Seminole, it would remain a competitive suburban seat, just like now
- HD29 – Like its current district, this remains in western Seminole and now expands into DeBary in Volusia County
- HD30 – Continues to be based around Maitland and Altamonte Springs on the Seminole/Orange Border
- HD40 – Anchored around Haines City – this NE Polk district covers the growing Hispanic population that is links with Osceola County. This would be an Hispanic access seat that could easily grow into an Hispanic majority seat over the next decade.
- HD41 – The rural seat is somewhat of a continuation of the current HD42, which covers rural Osceola and Polk, but its lost much of its Hispanic population
- HD42 – This Hispanic-majority seat is based on NW Osceola and covers Kissimmee
- HD43 – This Hispanic-majority district covers St Cloud and the central Hispanic corridor of Osceola
- HD44 – This seat covers the growing suburbs around Disney World. This seat was massively overpopulated and must shrink. Remains majority white the growing more diverse.
- HD45 – An African-American district located around Pine Hills. Largely retains its 2010 shape.
- HD46 – An African-American district covering western Orlando. Largely retains its 2010 shape.
- HD47 – This white enclave in the middle of Orlando is growing more diverse. Will largely retain a similar shape from 2010 as the regions around it saw the most growth.
- HD48 – This district grew so much that it largely loses its eastern areas. Hispanic-majority seat.
- HD49 – Continues to be a plurality-white, Hispanic-access district located around University of Central Florida.
- HD50 – Our NEW DISTRICT – a Hispanic-majority district located in eastern Orange County
- HD51 – More of the successor to the old 50th – a majority-white seat that goes from eastern Orange and into Brevard
This is my layout. I think it is a solid plan that accounts for minority growth.
A Possible GOP Gerrymander
In my North Florida article, I pointed out how population changes could actually help the GOP – namely thanks to making SD3 more Republican and limiting the ability to have two Democratic seats around Gainesville. In Orlando, the population changes are bad for the GOP. The growth their is at their expense. The question is, can the Republicans preserve their numbers there? The two new Hispanic seats I drafted would both by Democratic. Can the GOP stop such a map?
Republicans have to be careful here if they decide to be aggressive. Short-circuiting an increase in Hispanic districts could result in a strong VRA-lawsuit, which would put the rest of the plan at legal risk. I tried to think of what GOP gerrymander could be achieved that also tried to avoid a VRA complaint (though it still could get one).
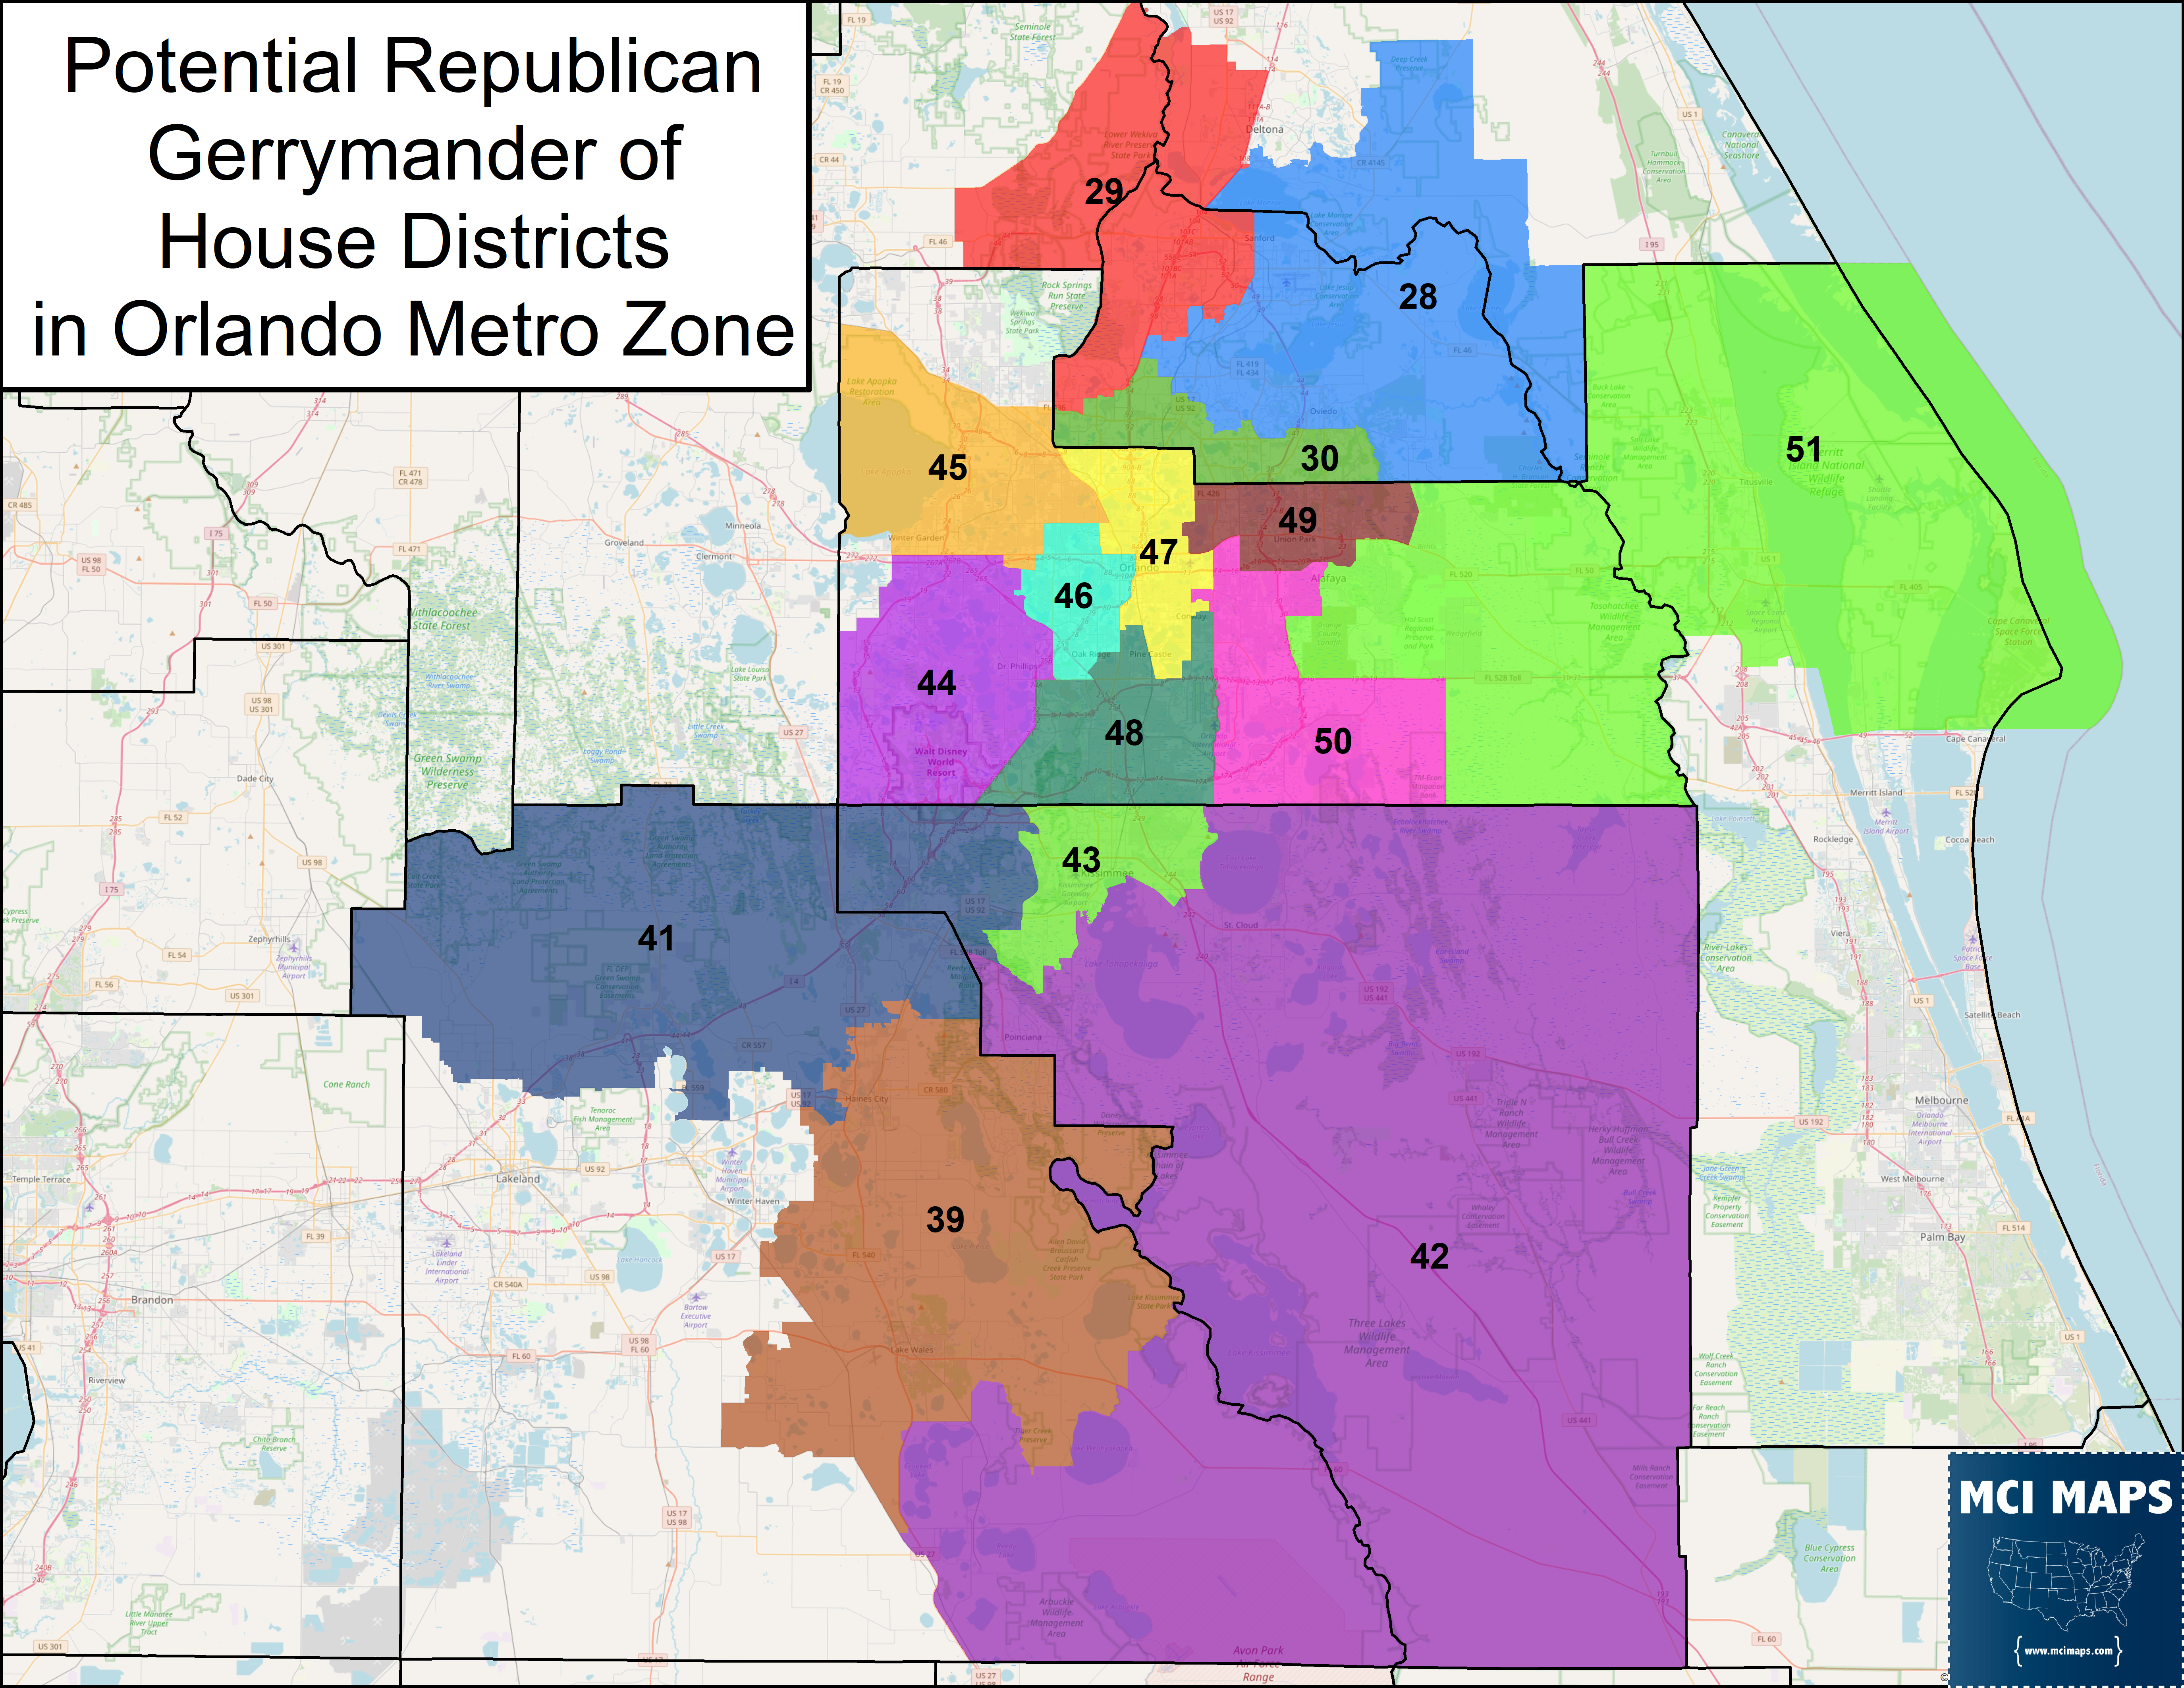
One possible plan they could put forward is in the style seen below.
Racial makeup below.
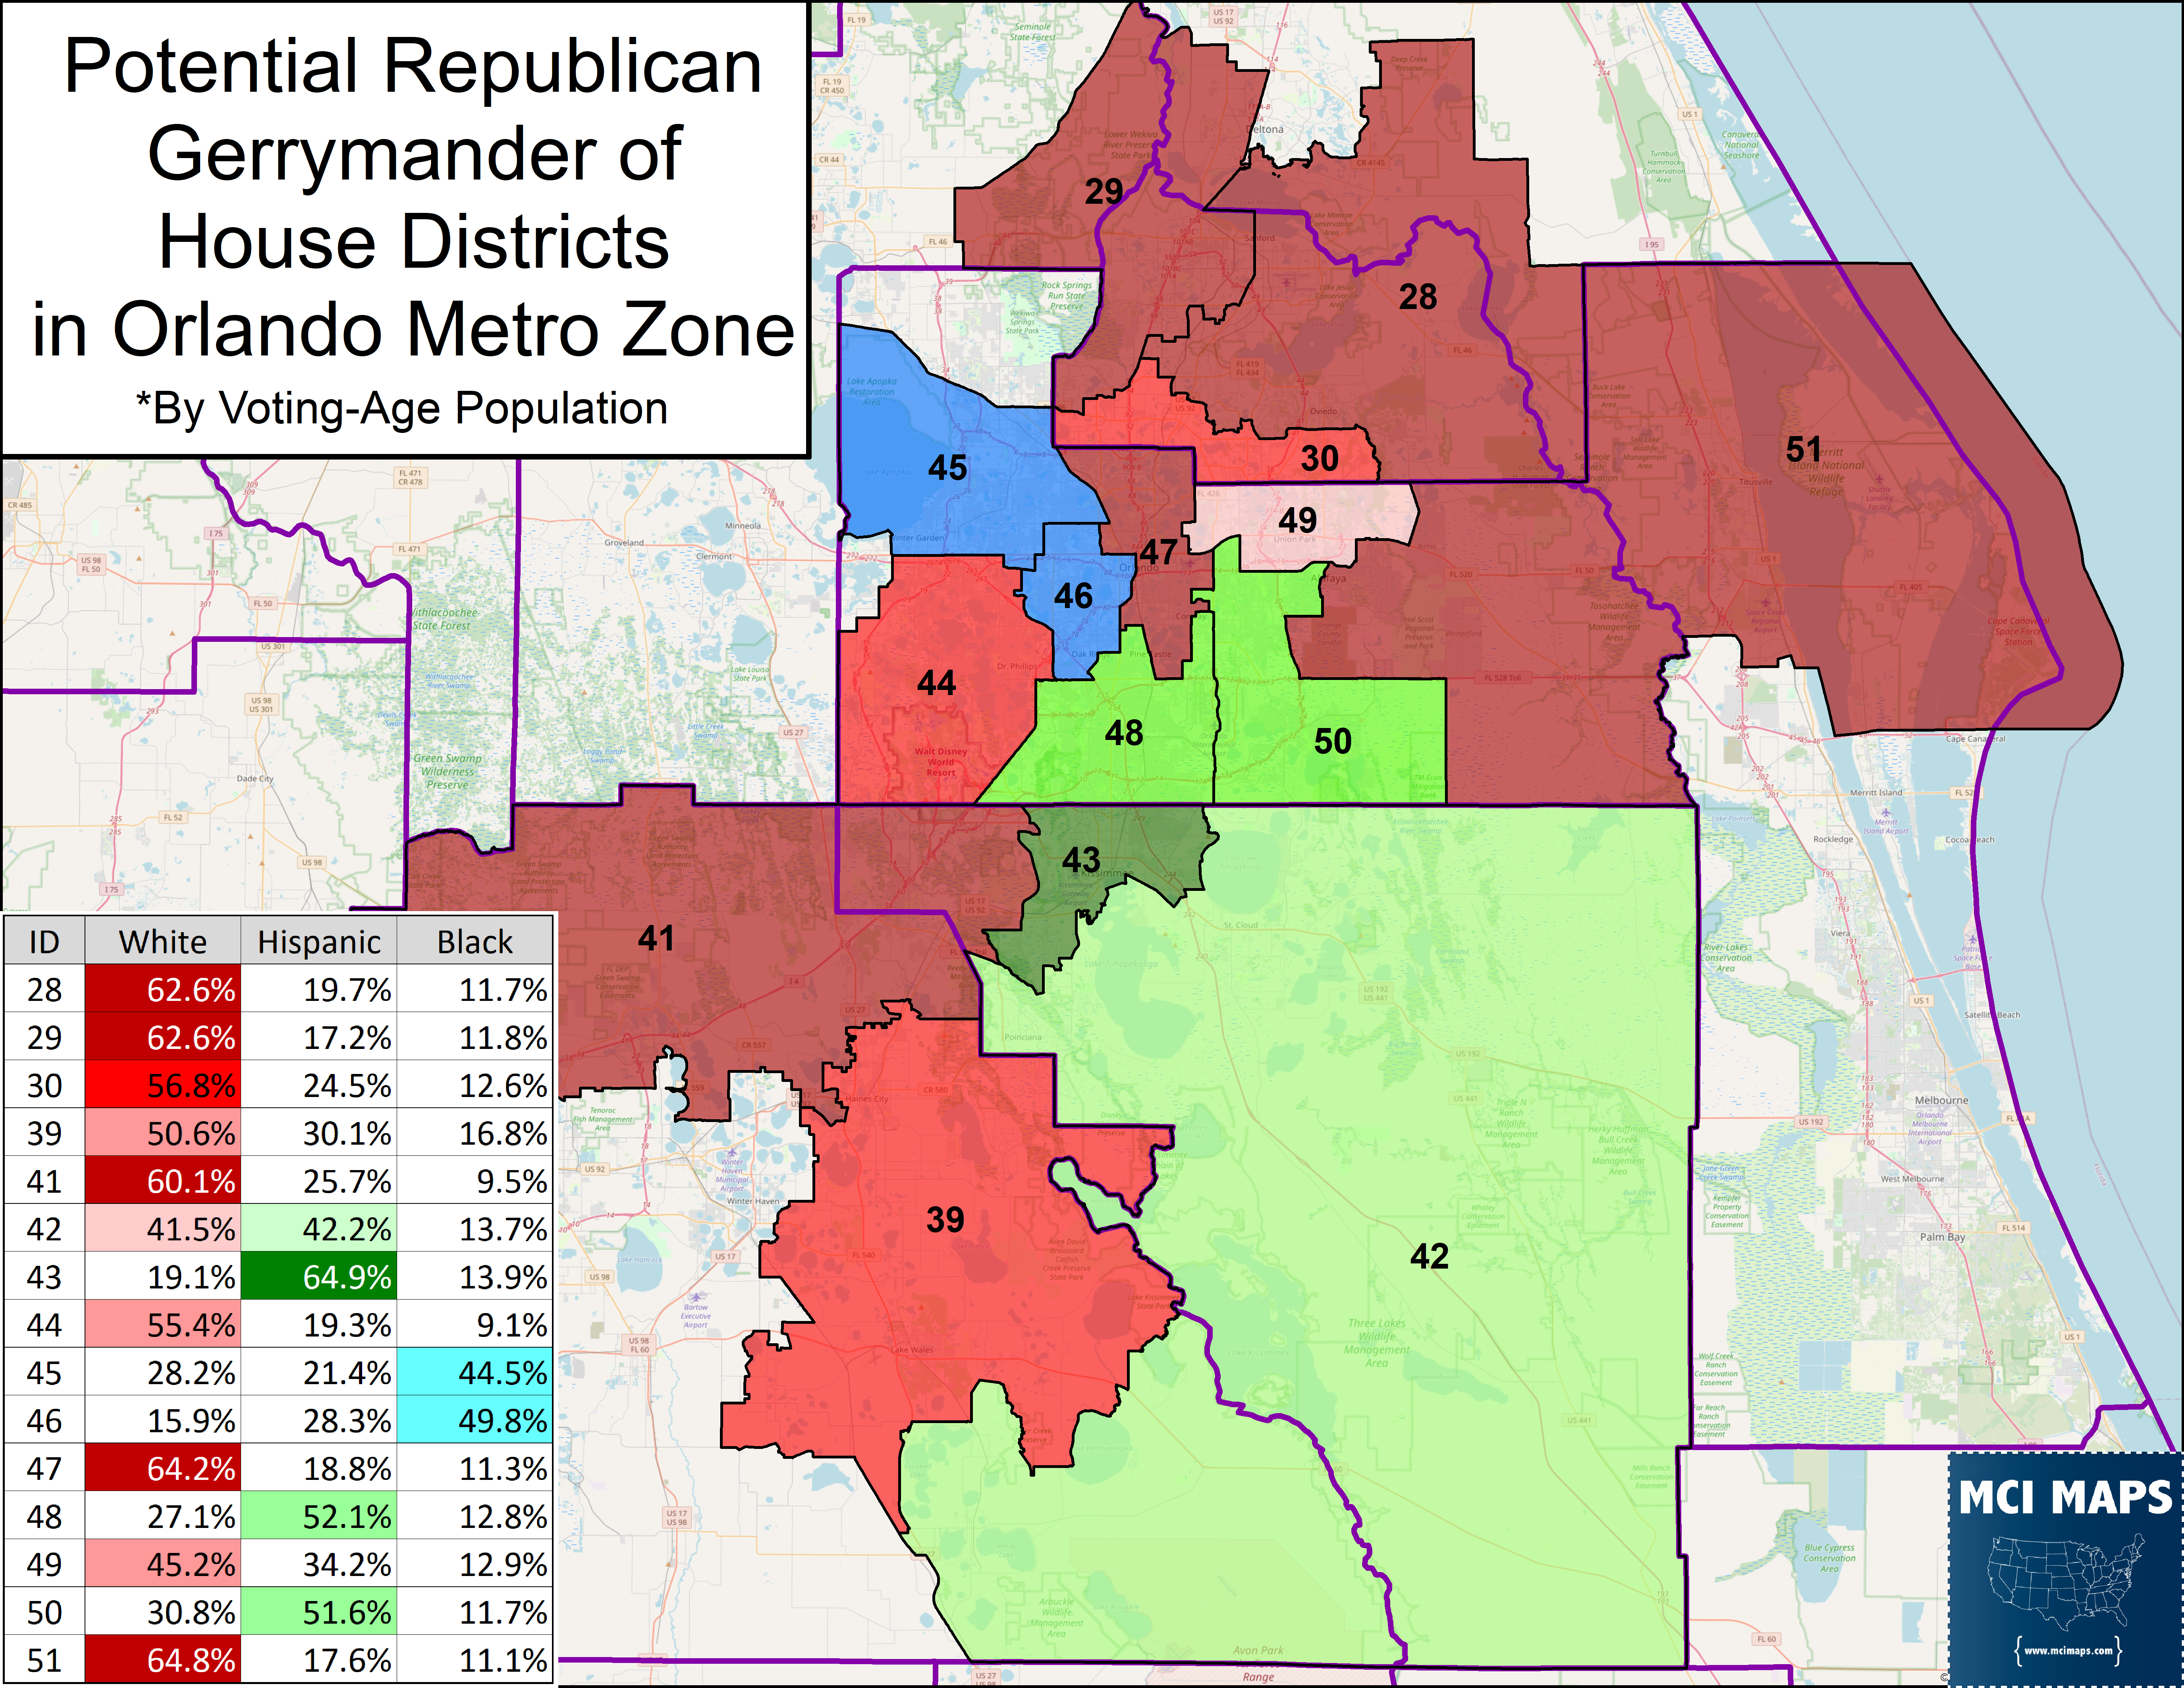
So lets talk about this plan and what it aimed to do.
- HD28 and HD29 are sent into Volusia and Lake to grab more voters. This makes them more steadily Republican, less competitive than the current map.
- HD30 is pushed into all-Seminole so that it can suck up Democratic voters and aid the 28th and 29th in being GOP
- HD41 does what the current 39th does, help split Osceola three ways. Take Democratic-voters and links them with Republican-minded Polk voters
- HD43 packs every Hispanic Democrat it can – leaves HD42 as barely Hispanic plurality and more GOP friendly.
- HD48 and HD50 – Republicans accept another Orange Hispanic district is impossible to stop – accept that loss.
The map, in essence, gives the Democrats the 50th to claim – but tries to prevent the 42nd from being as much of a given. That would be a competitive district under this plan. Also, my plans HD40, the Hispanic access seat in Polk, would have been modestly Democratic. With their 40th, the area remains Republican. The map creates a 3rd Hispanic-majority seat, giving the GOP a key talking point. However, it short circuits a 4th Hispanic-majority seat and kills off the Polk-based access seat.
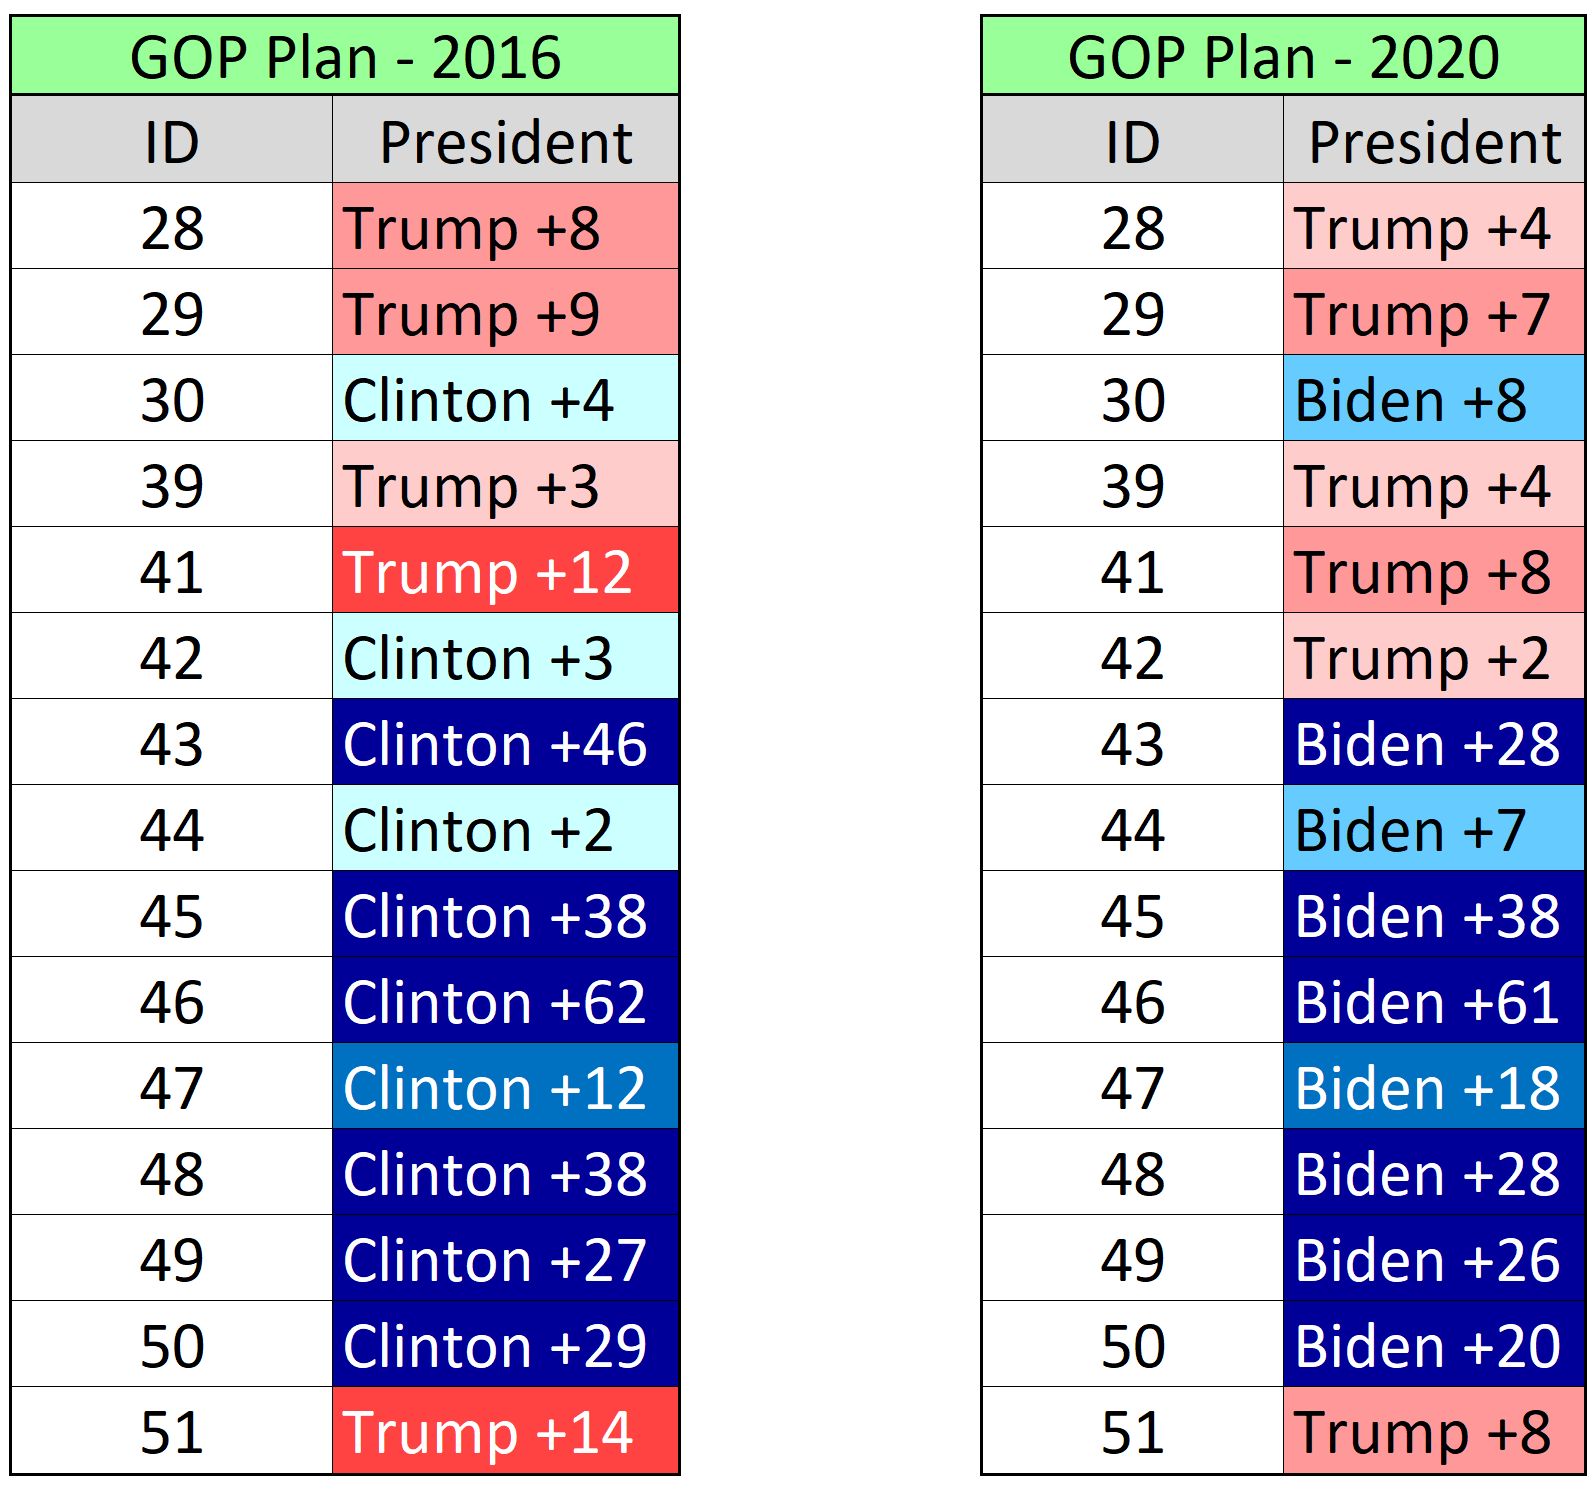
Comparing the Presidential results in each plan.
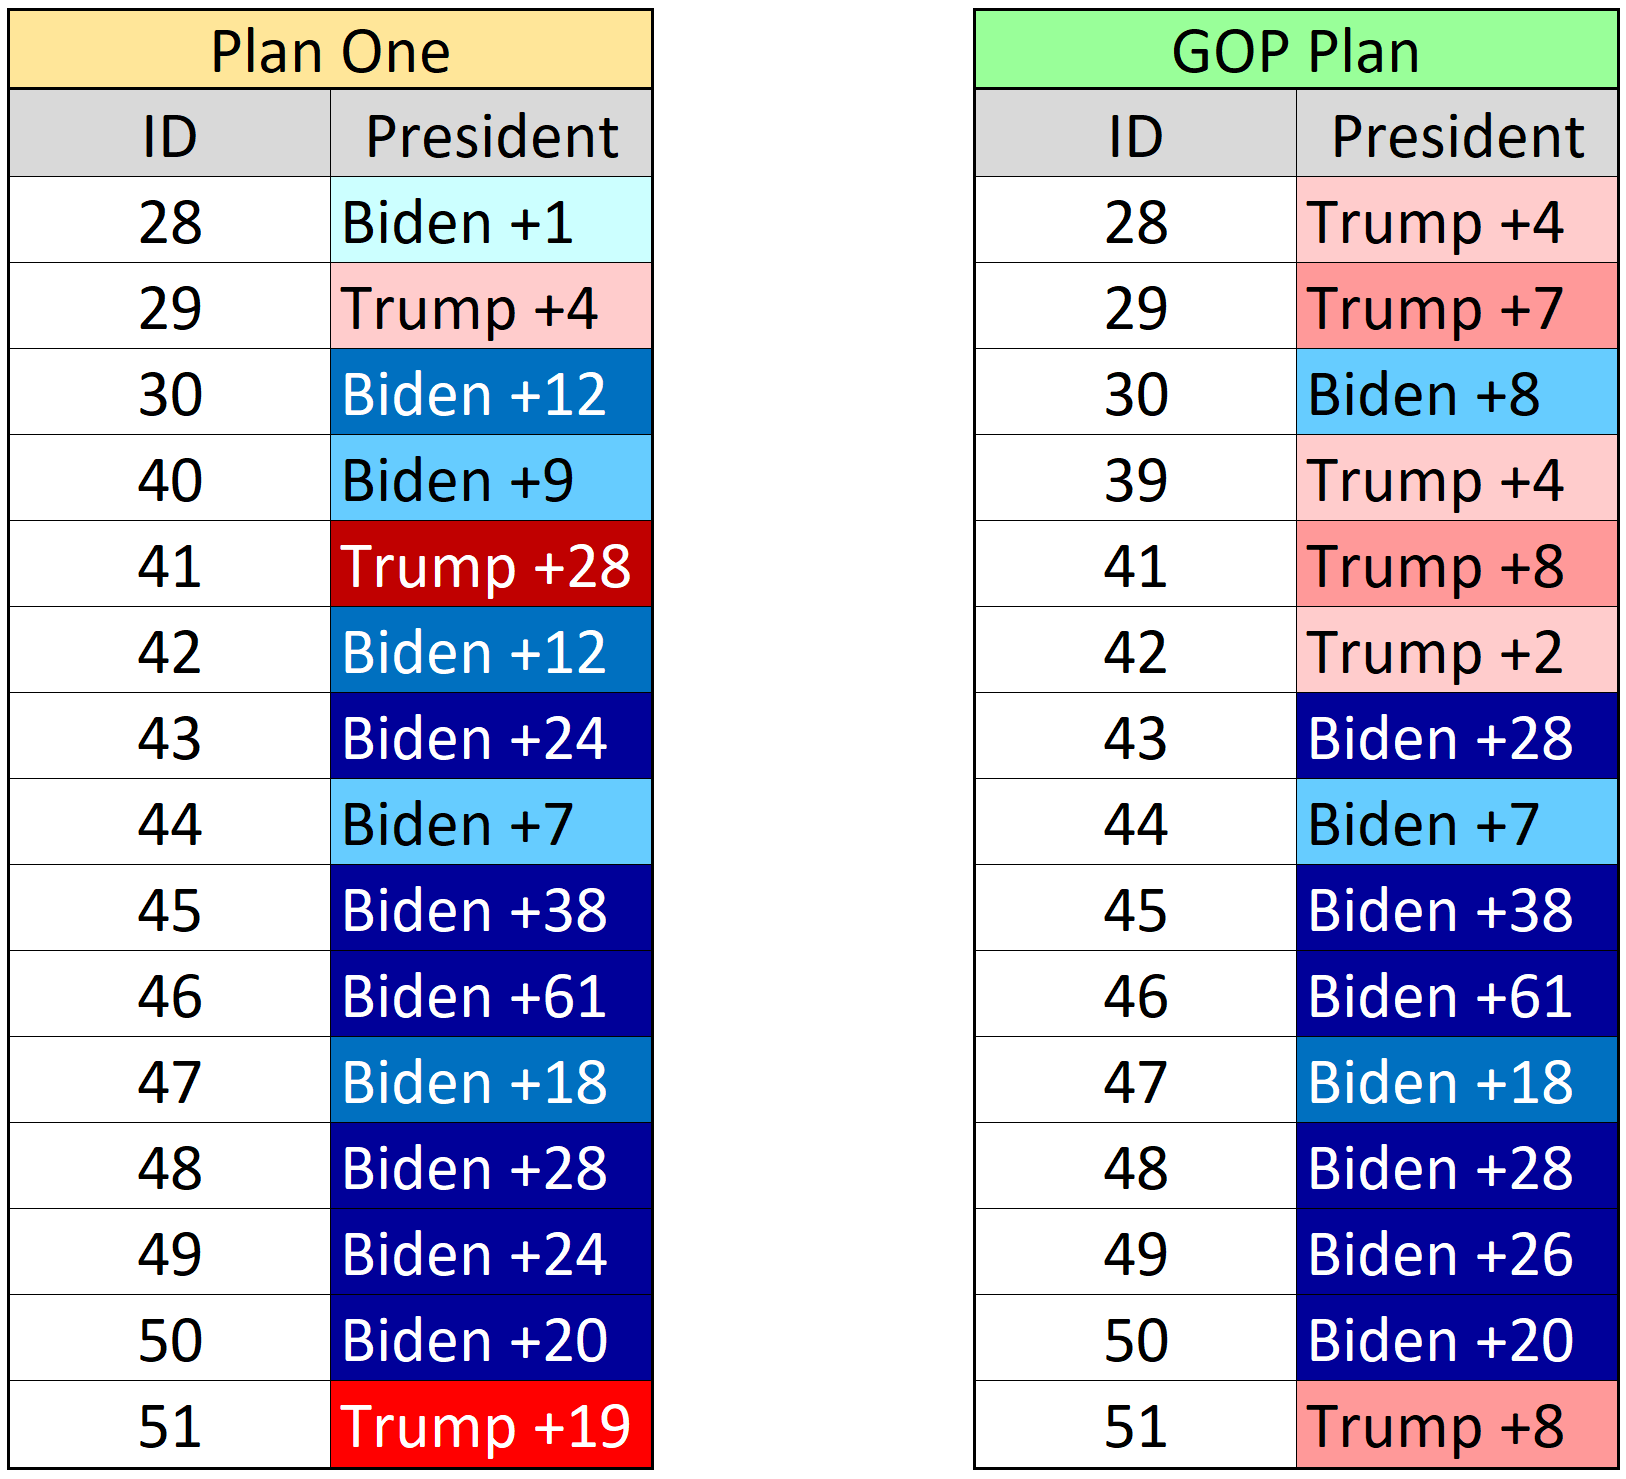
The plan spreads out GOP voters more and gives the Republicans several narrow districts. It also shores-up their Seminole seats.
GOP “Dummymander” Risks
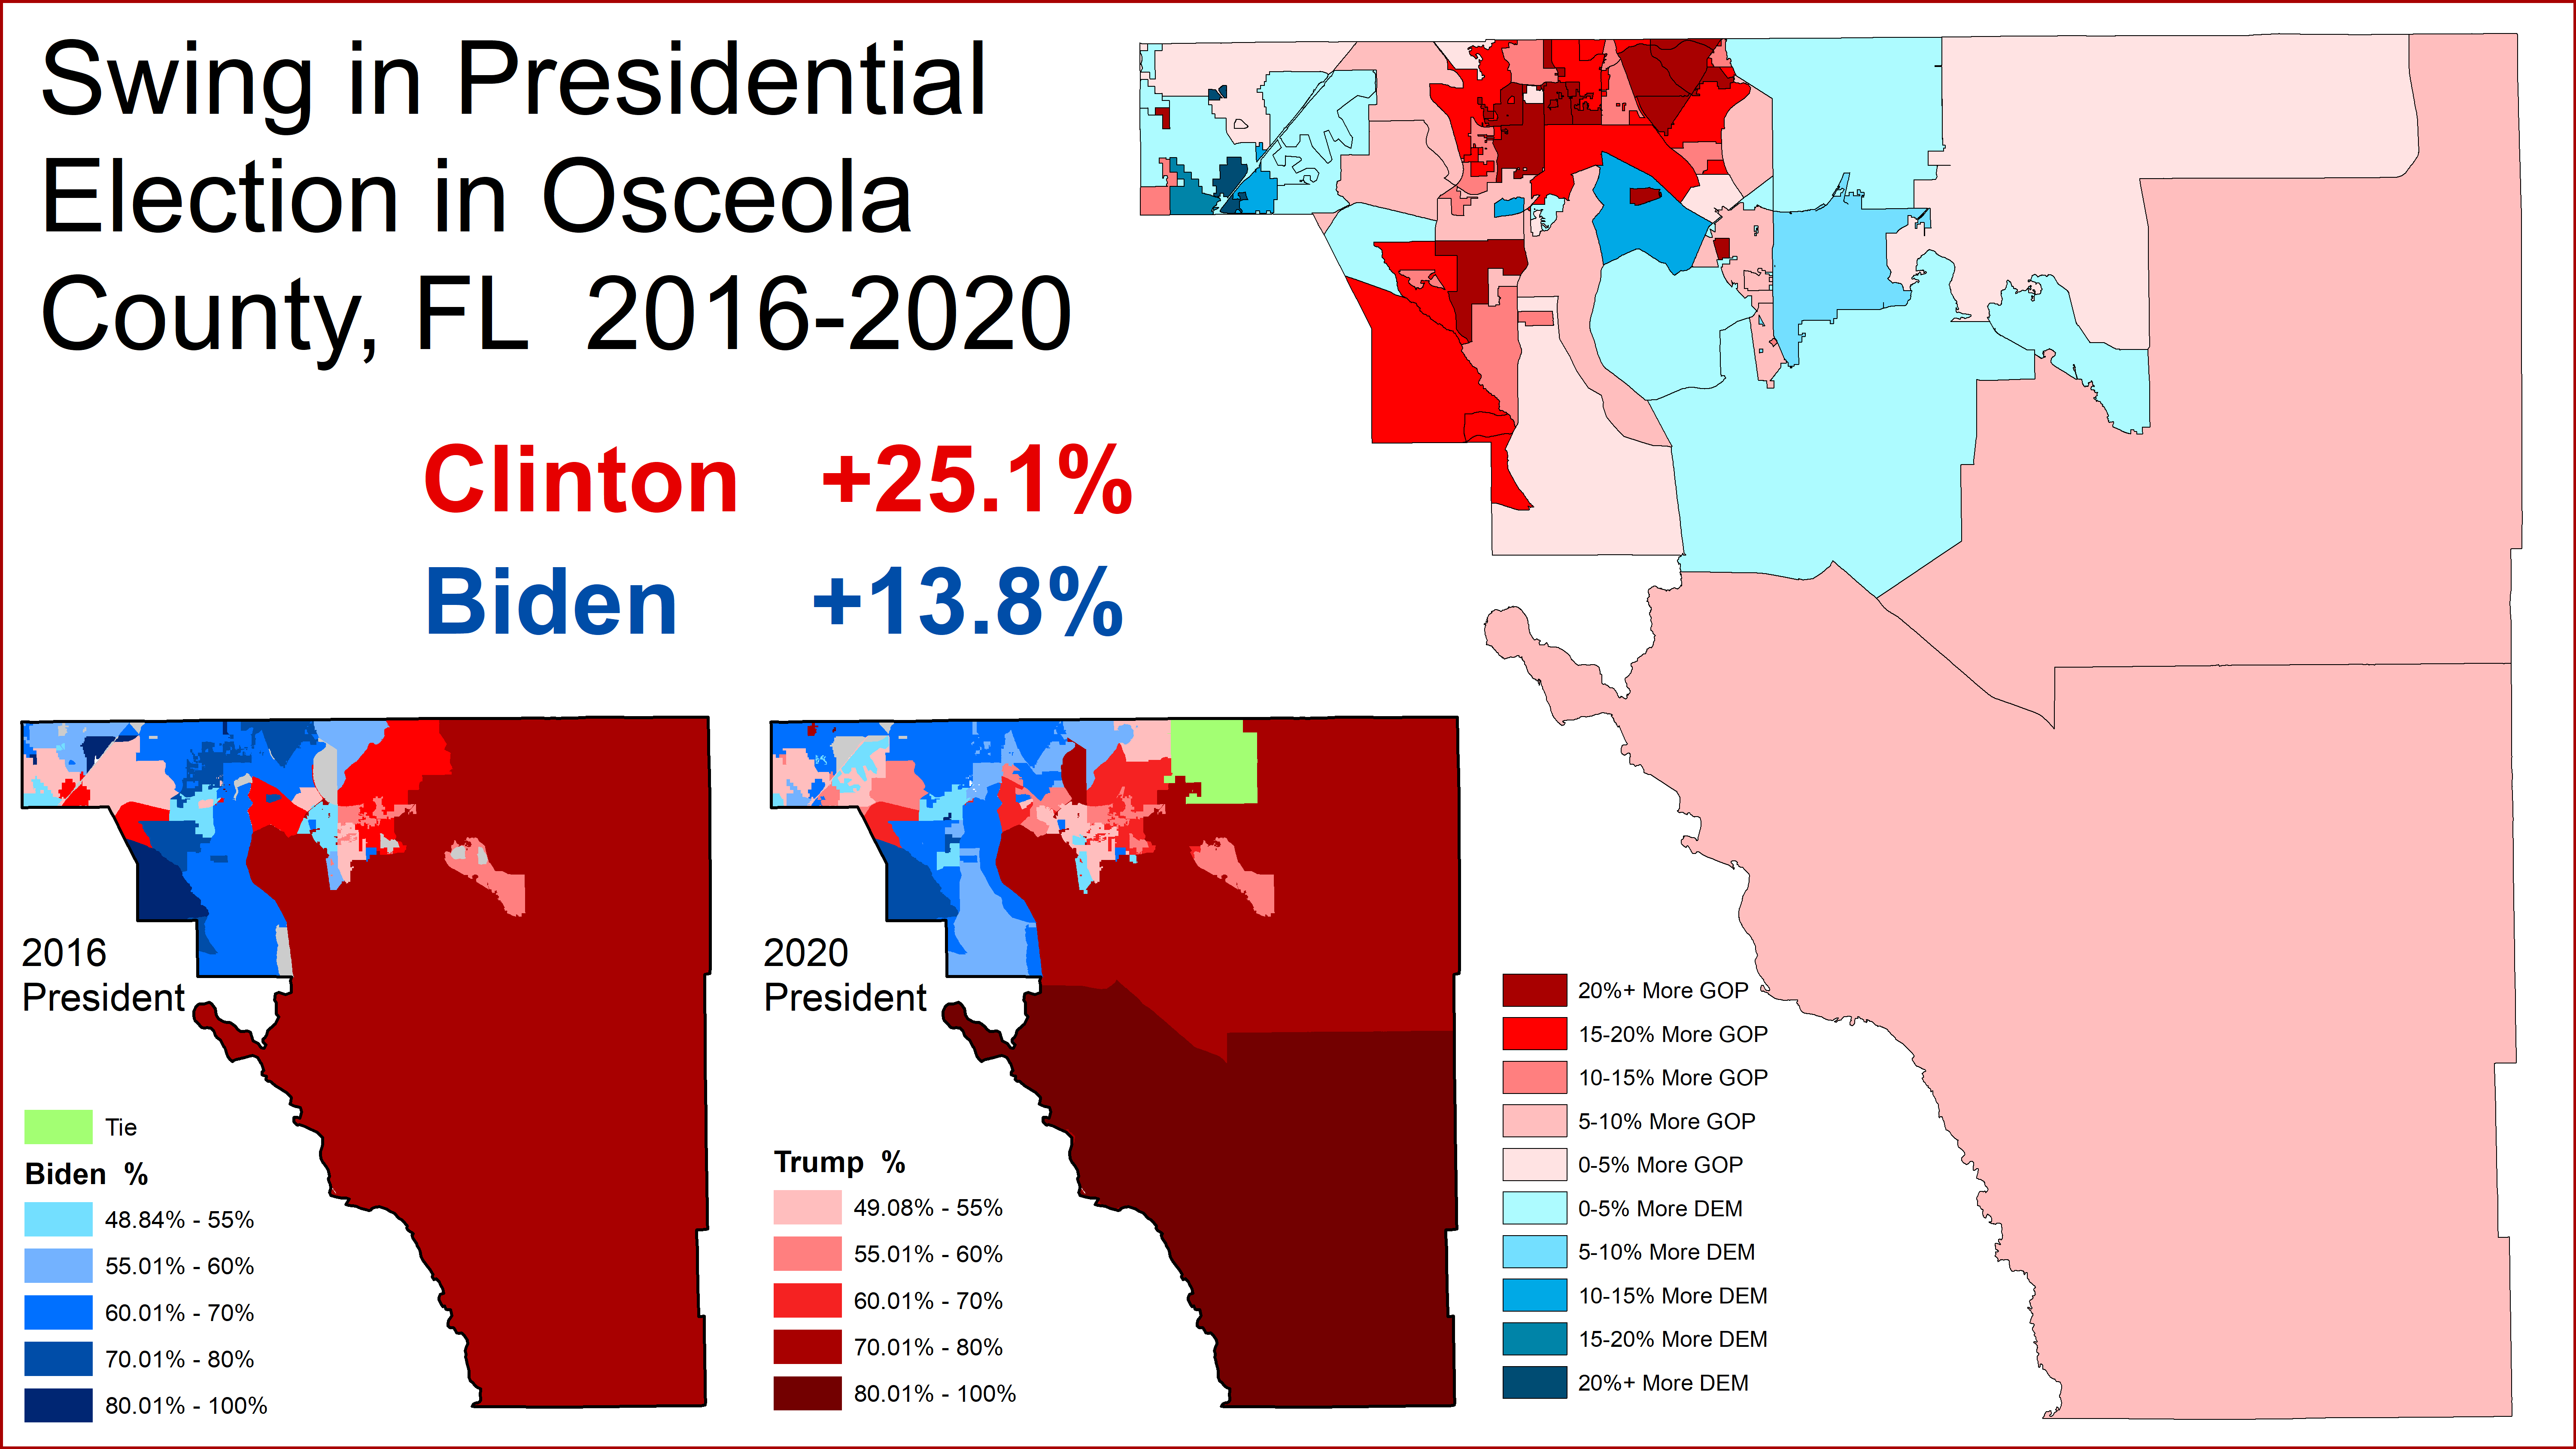
One Republican risk if they go with this course of action would be the risk spreading themselves too thin. The 42nd under the GOP plan, for example, would be a Clinton seat in 2016. The region has seen a tremendous amount of swing in recent years – as Republicans make gains with Hispanics but Democrats make gains with suburban whites.
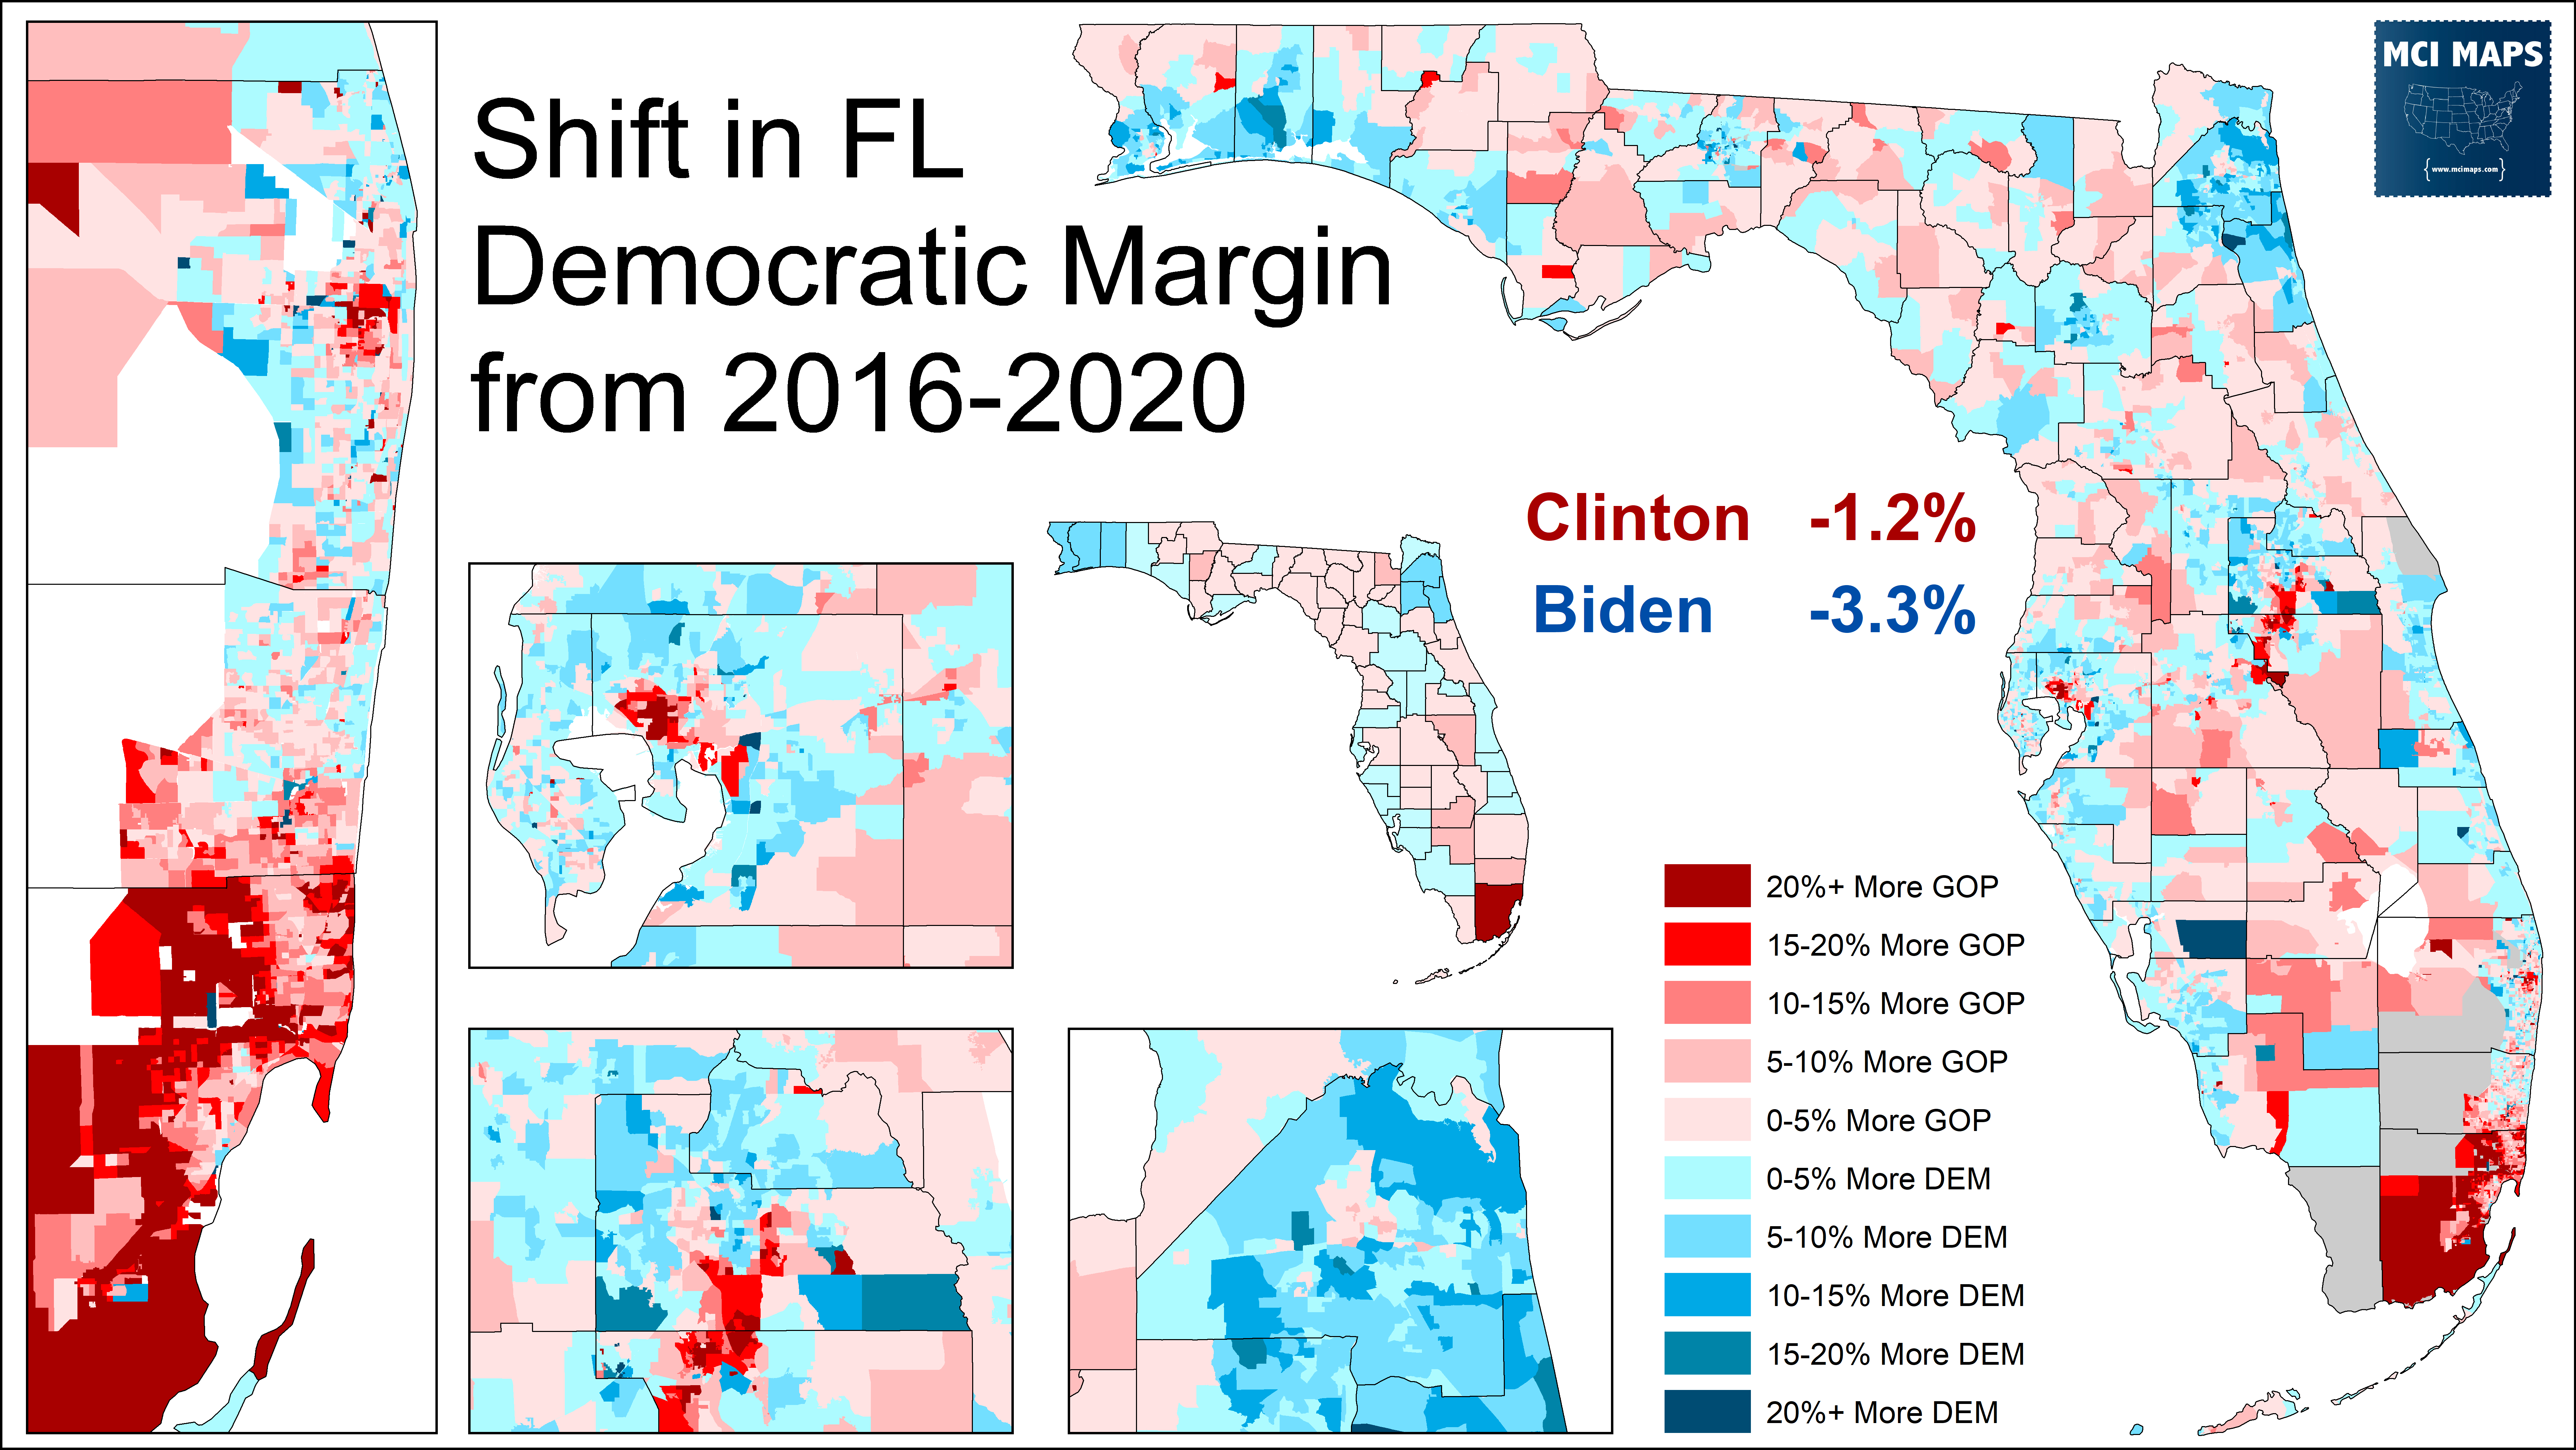
Osceola, for example, went from Clinton +25 to Biden +14. This is a large swing – heavily driven by Hispanic swings.
So how would a partisan map-drawer interpret these changes? Do you assume 2020 is the new normal? Do you worry about a slide back, or assume the trend continues?
Republicans could opt to do shore-up just one of the districts, like 39 or 42, instead of both. Of course, Republicans, with infinitely more money than Democrats, could also feel they are in a stronger position to hold tossup seats than Democrats are.
Of course, they could also not do any of this and instead draw a plan to realizing Hispanic growth in the region.
Conclusion
How the Orlando house map is drawn will depend on the partisan desires of the map-drawers. Realistically any above-board map should see four majority-Hispanic districts, or 3 districts and a solidly Hispanic access seat or two. Packing Hispanic voters is not needed in Orlando – but it could be a GOP talking point to justify a gerrymander.
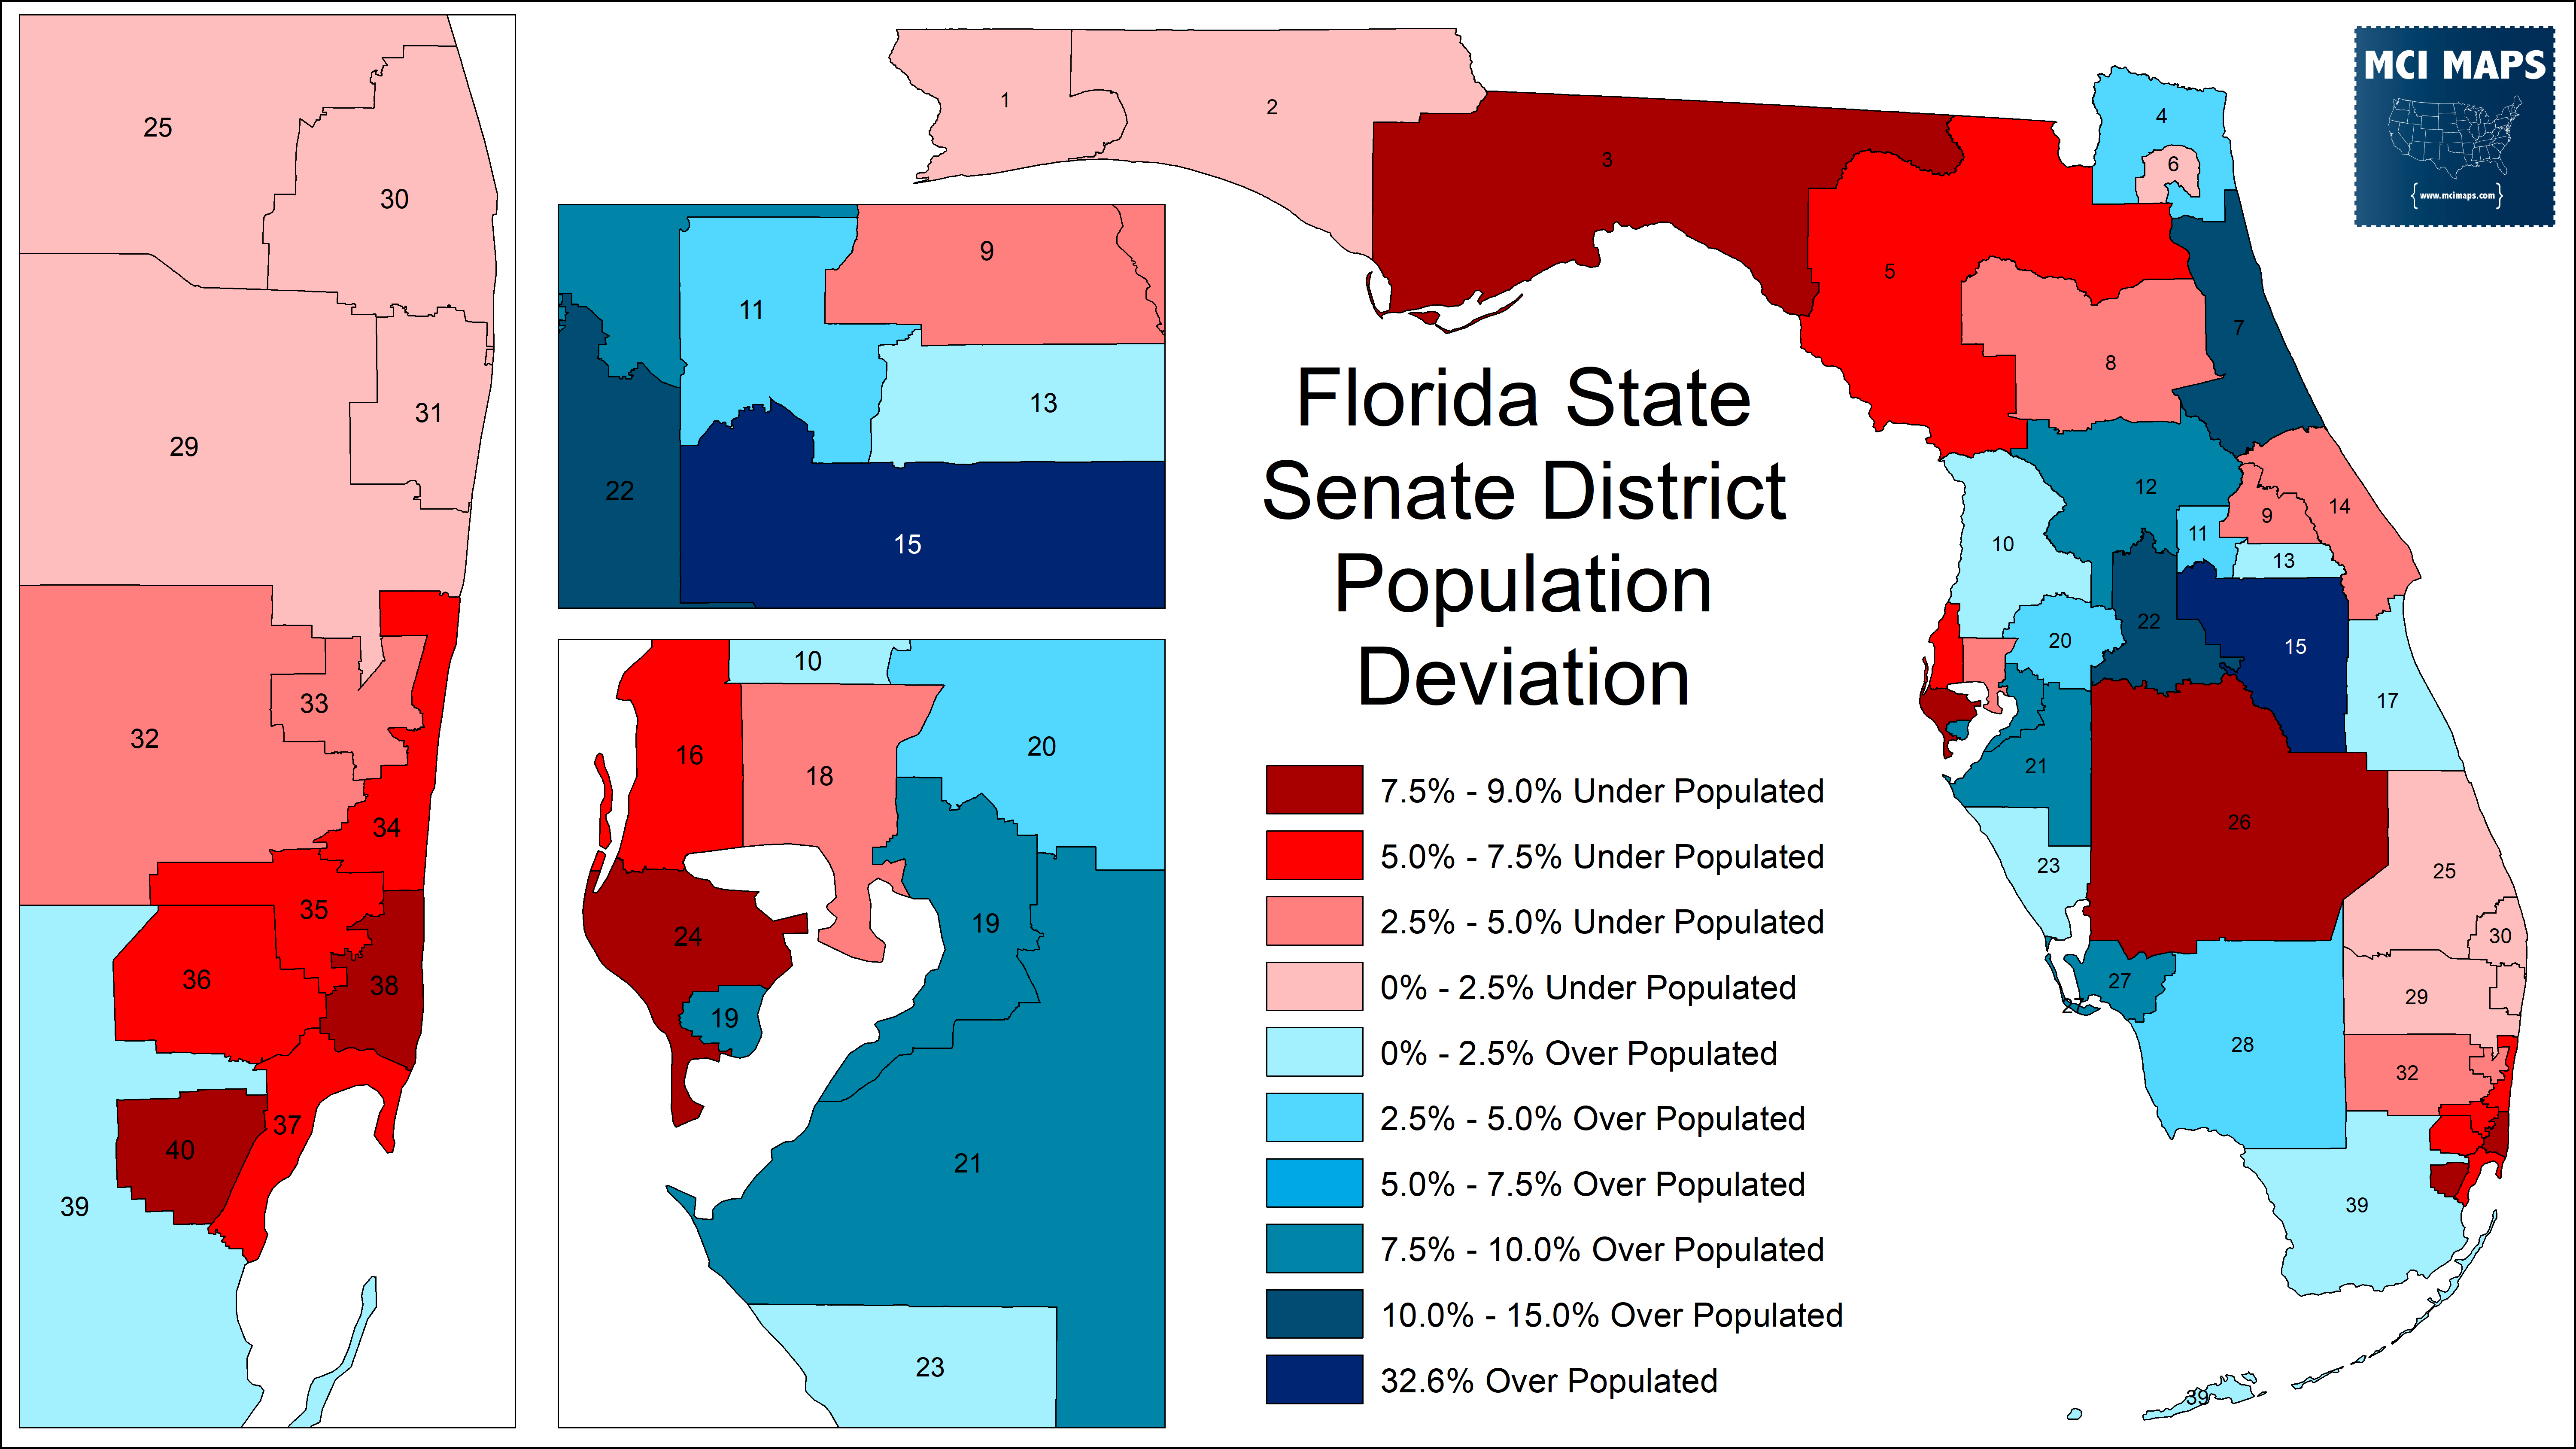
We will continue this discussion next week with a look at the Orlando area State Senate map.