This week marks article #10 in my series on redistricting possibilities across Florida. Each week I will look at an area of Florida to discuss redistricting implication.
Series Explainer
The goal of this series is to take a look at different areas in Florida and see how the legislative lines may end up. These articles will focus on how lawmakers may draw districts to accommodate changing populations. I will talk about different areas, what mandates (namely minority representation) they have, and what might need to happen due to population changes. I will also, at times, examine what efforts to gerrymander a region will look like. After the 2012 gerrymandering was discovered by a Florida Court, I believe it is appropriate to treat legislative intent with some healthy skepticism. “Fair maps” can – at times – be in the eye of the beholder, but the goal will be to identify what would likely be partisan decisions by lawmakers.
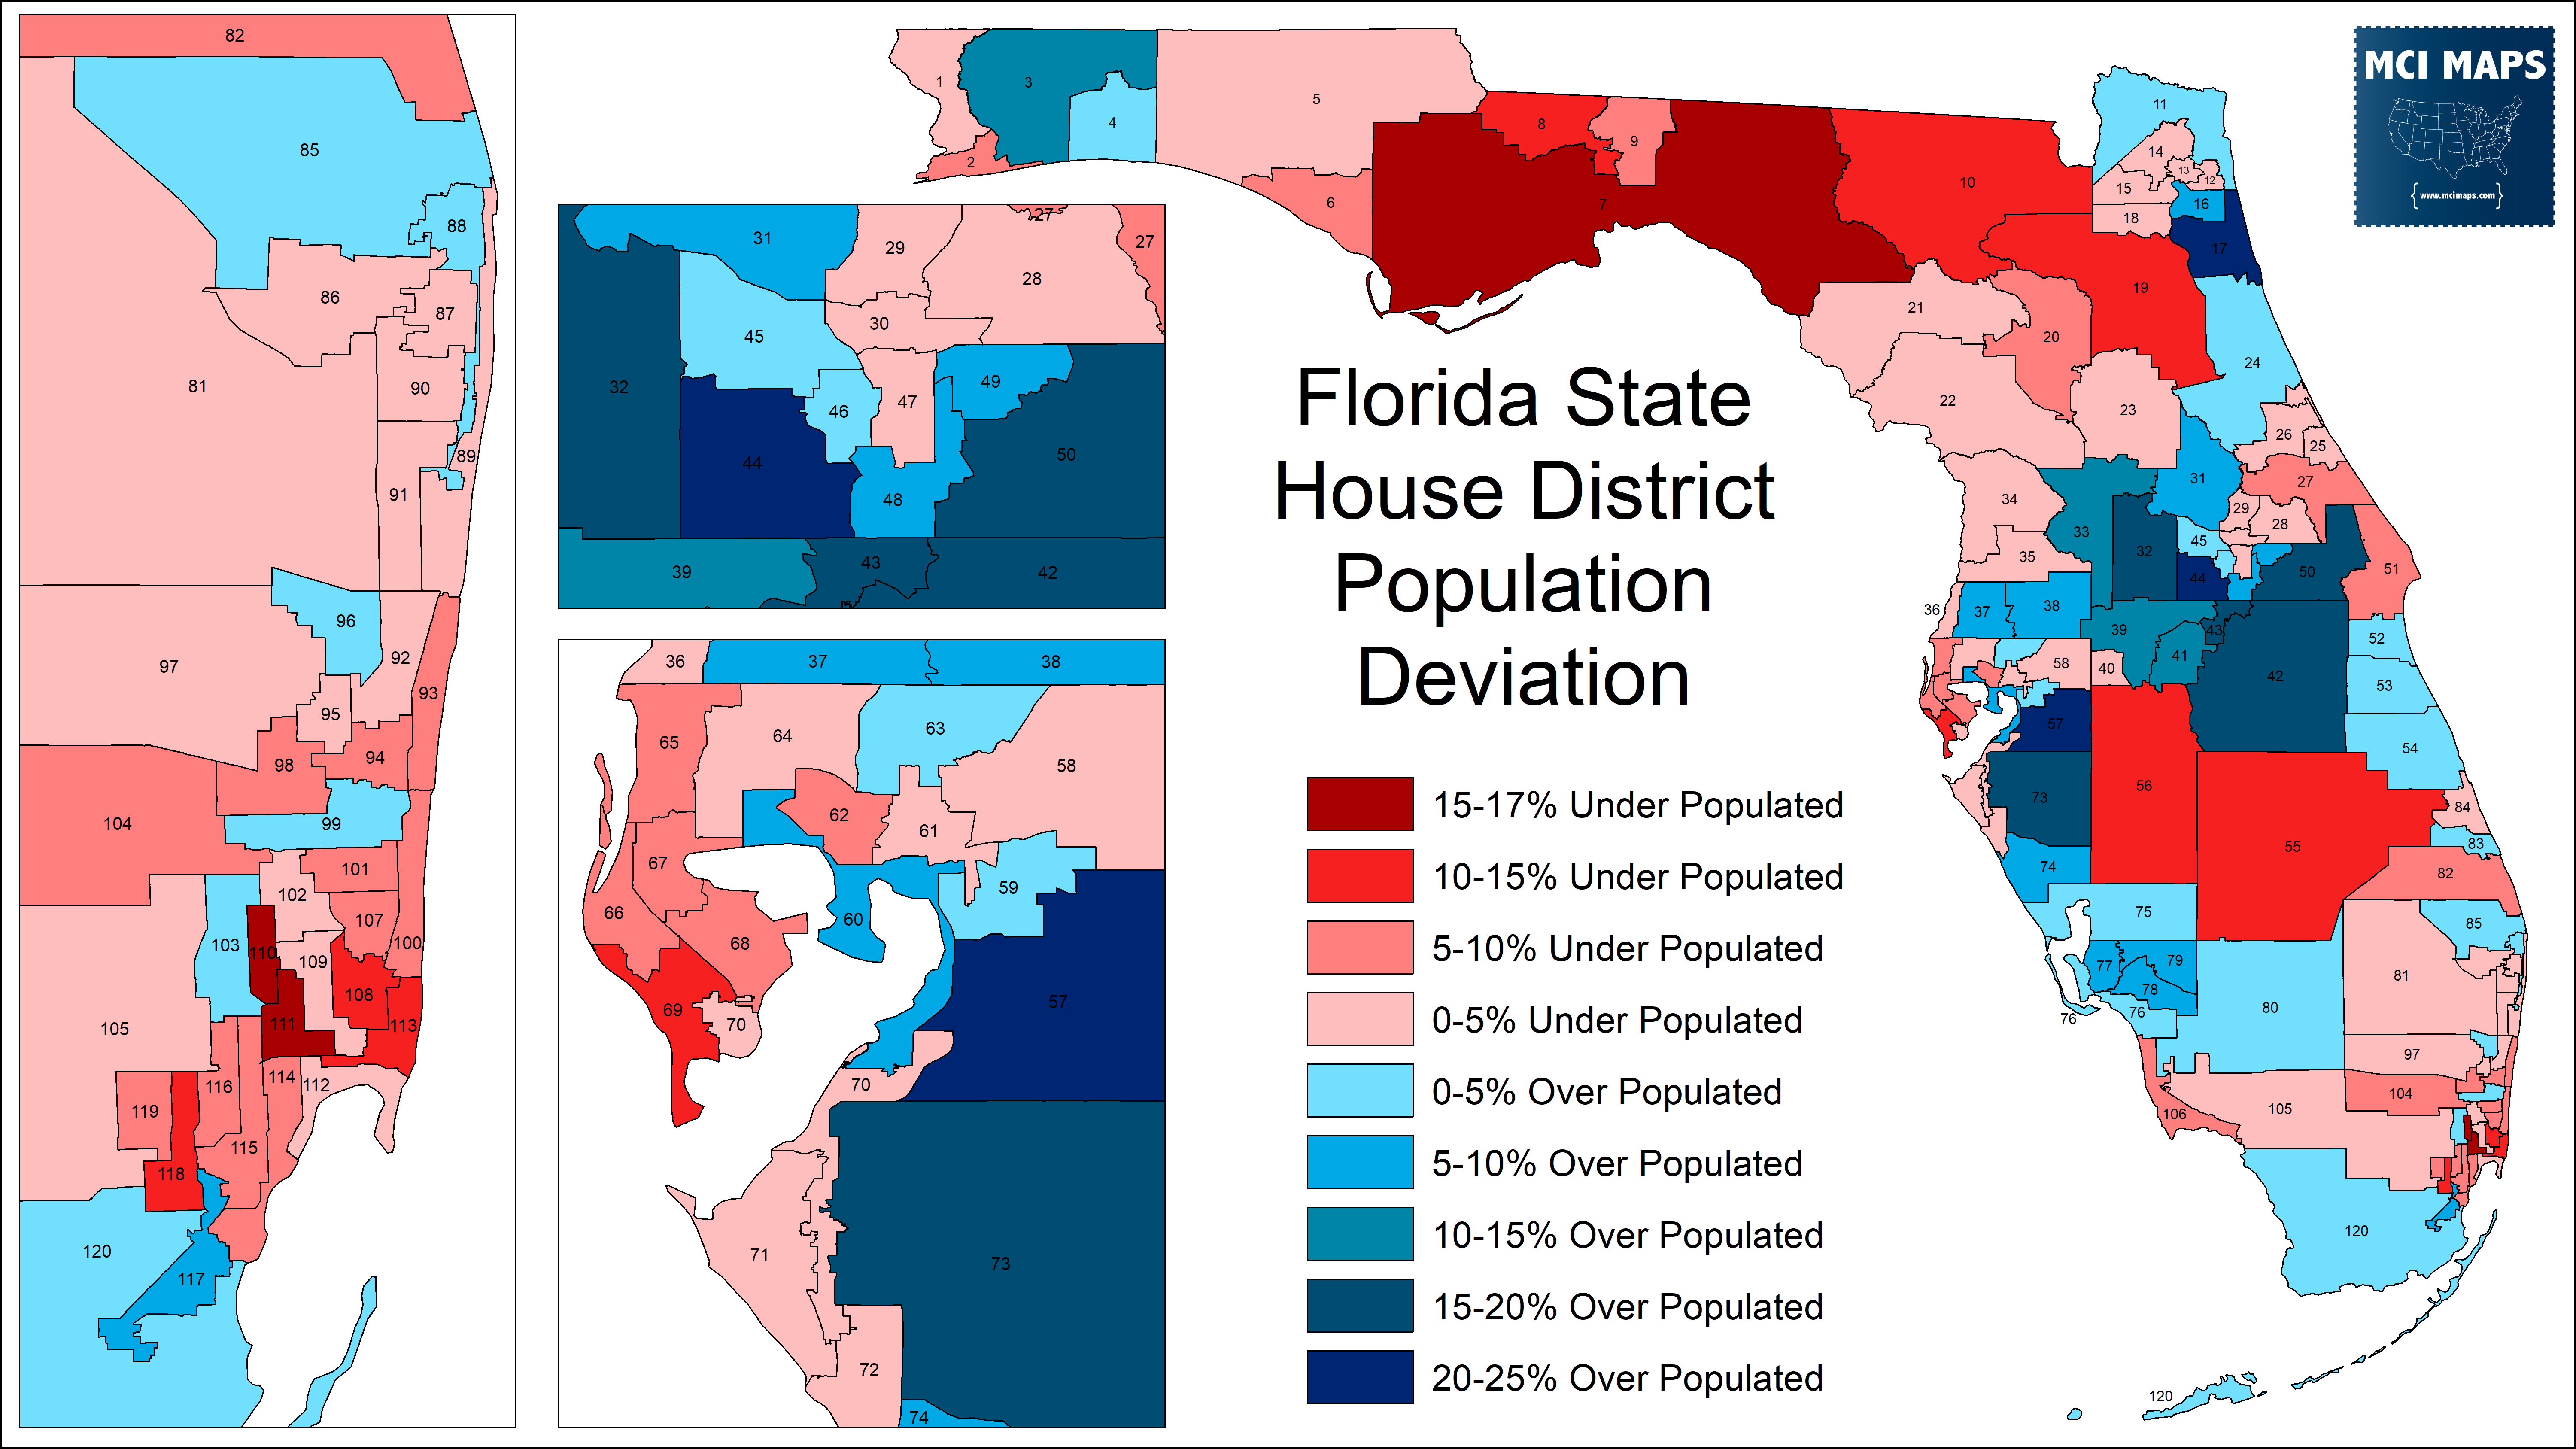
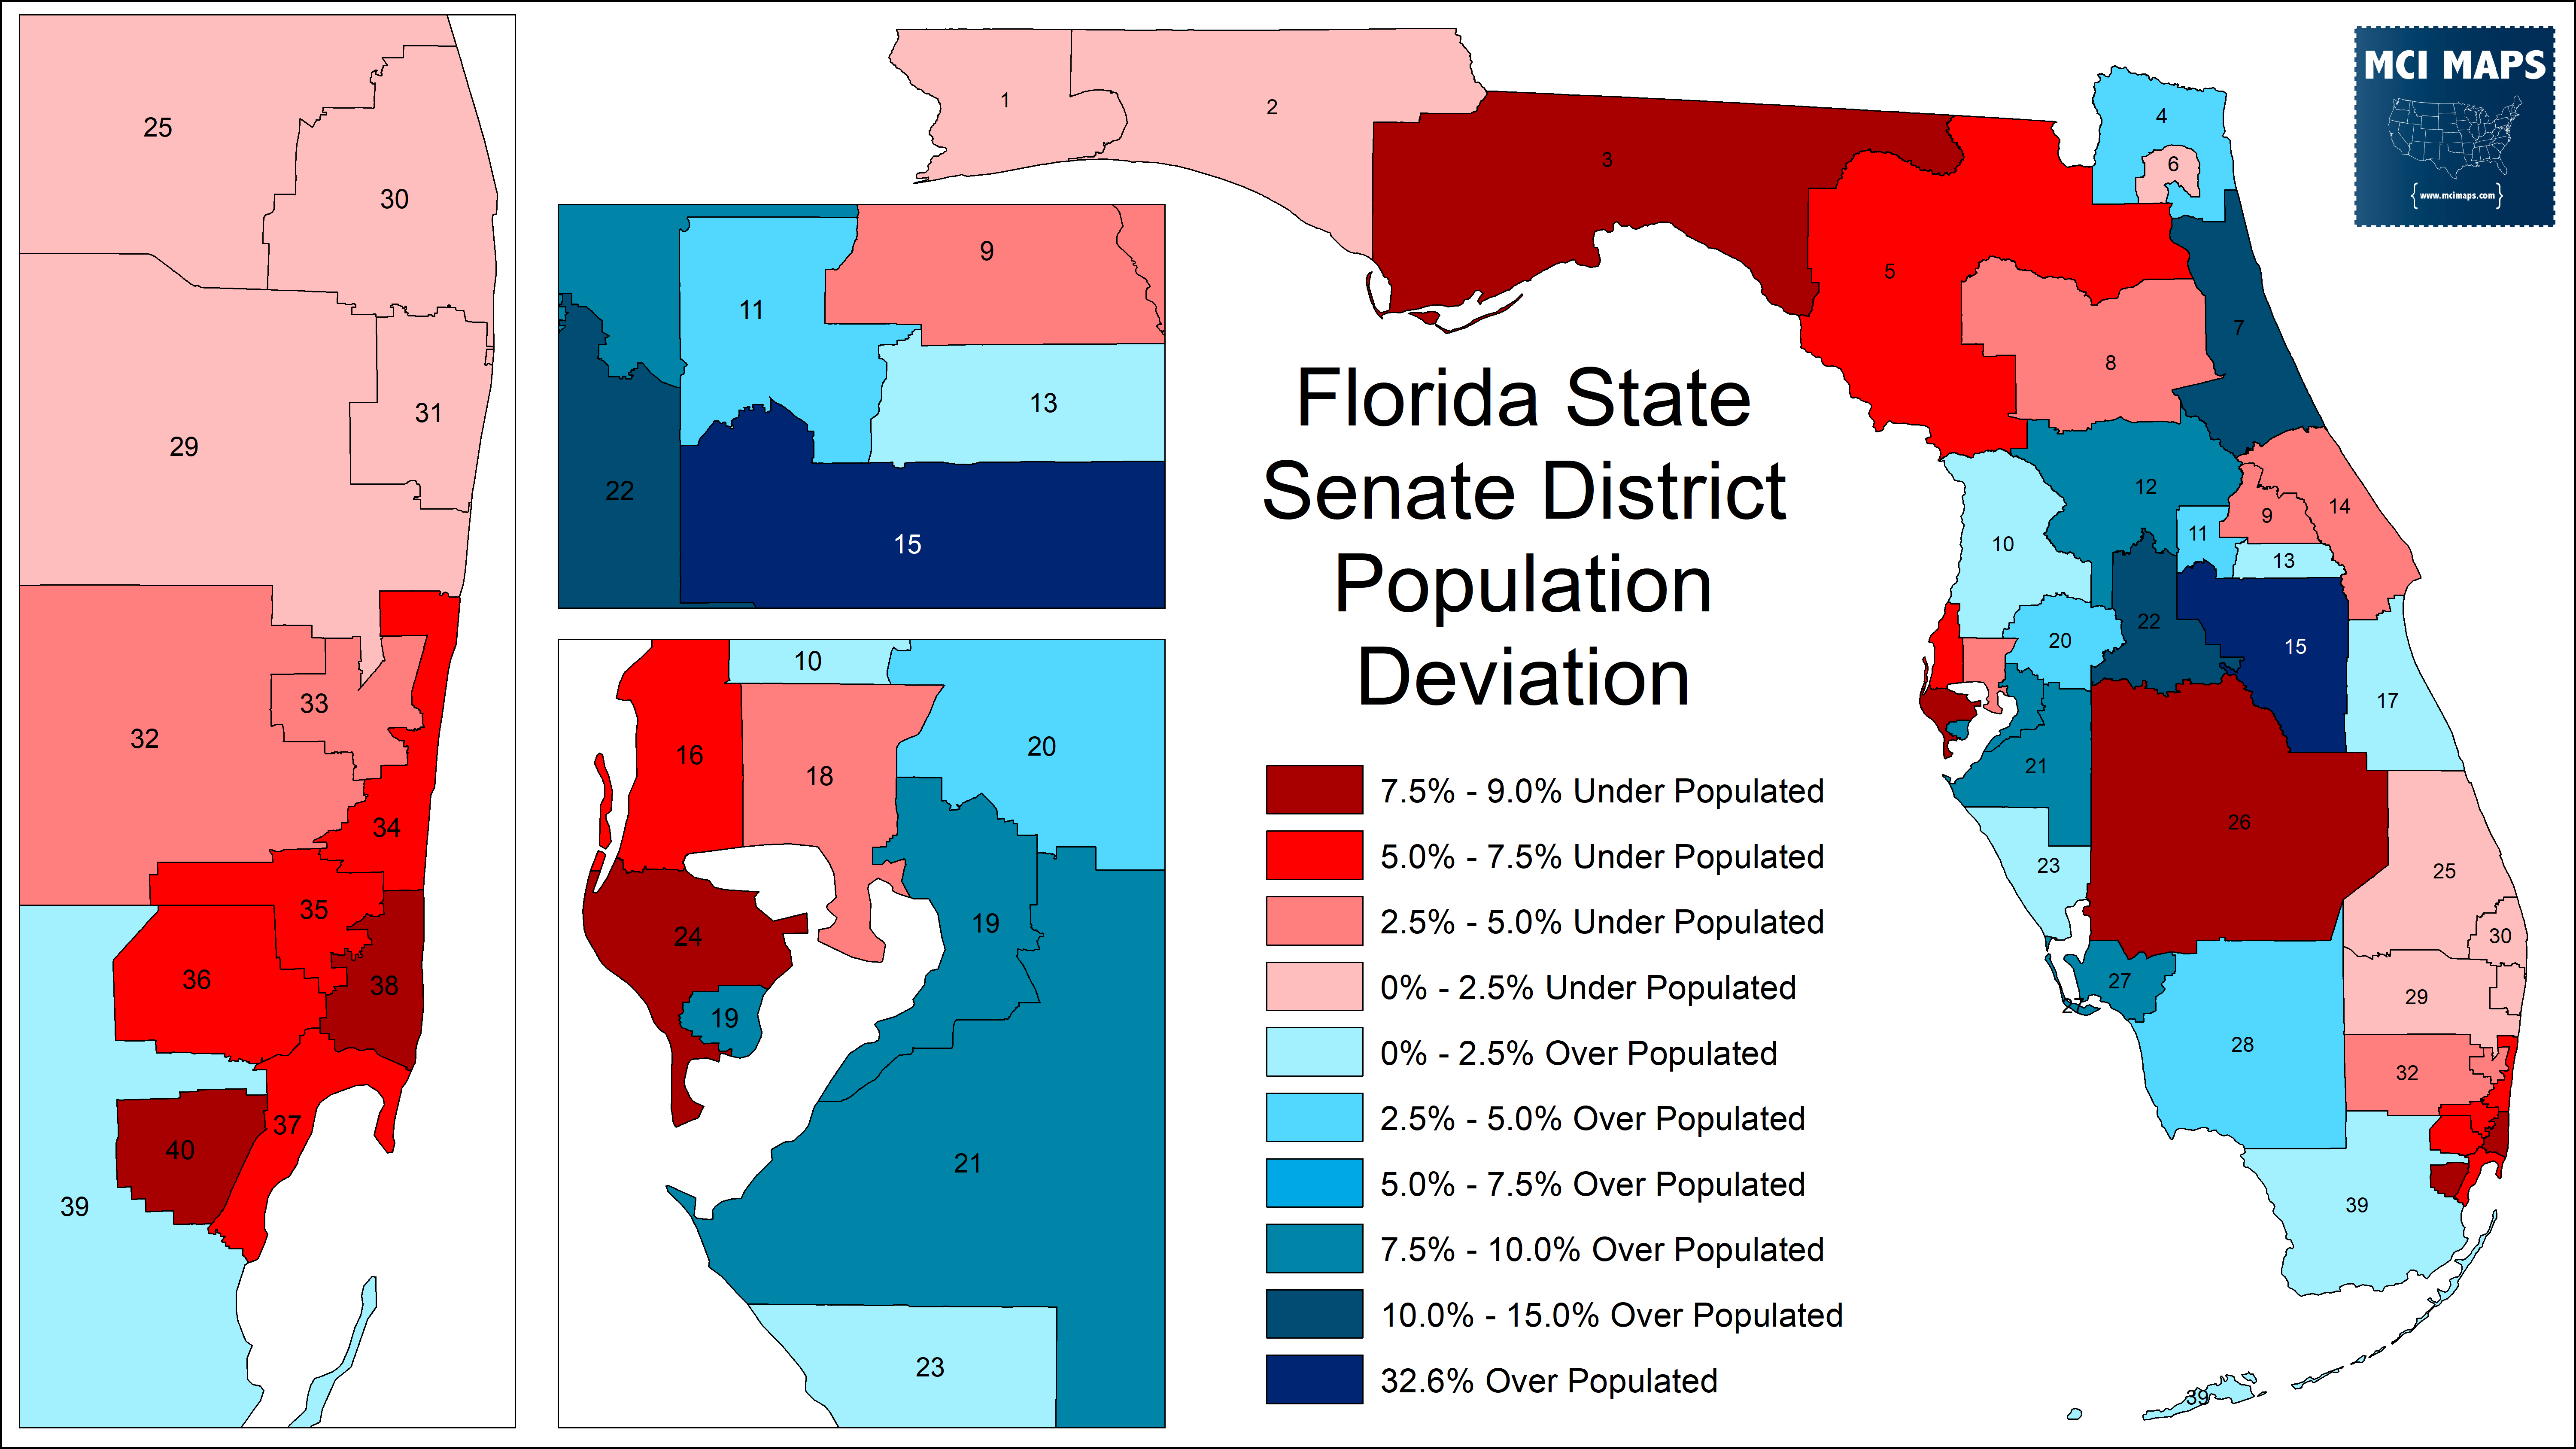
I highly recommending reading my History of Florida Redistricting series – as many mandates and norms we have in our maps are a product of that history. Prerequisite reading is absolutely my 2022 Primer Article – which covers which districts are under-populated and what the racial benchmarks are.
The full spreadsheet of district stats – including population and racial makeup – can be found here.
An important glossary to remember:
- BVAP = Black Voting-Age population
- HVAP = Hispanic Voting-Age Population
- Functional Analysis = using political turnout data to confirm minority performance in a district. Utilizing both general election and primary election performance for parties and racial groups.
Lets continue this series by looking at the southeast Florida state senate region!
Update! State House Maps Released
Over the last few weeks, we started seeing redistricting drafts emerge from the state senate. On November 29th, the State House released their first draft maps. I discussed the gerrymandering of the Congressional map in this substack post. For this article, we are discussing the state house plans.
Both plans give the GOP a decent advantage in the chamber. Biden won just 50/120 districts in plan 8005, while he got 52/120 in plan 8007.

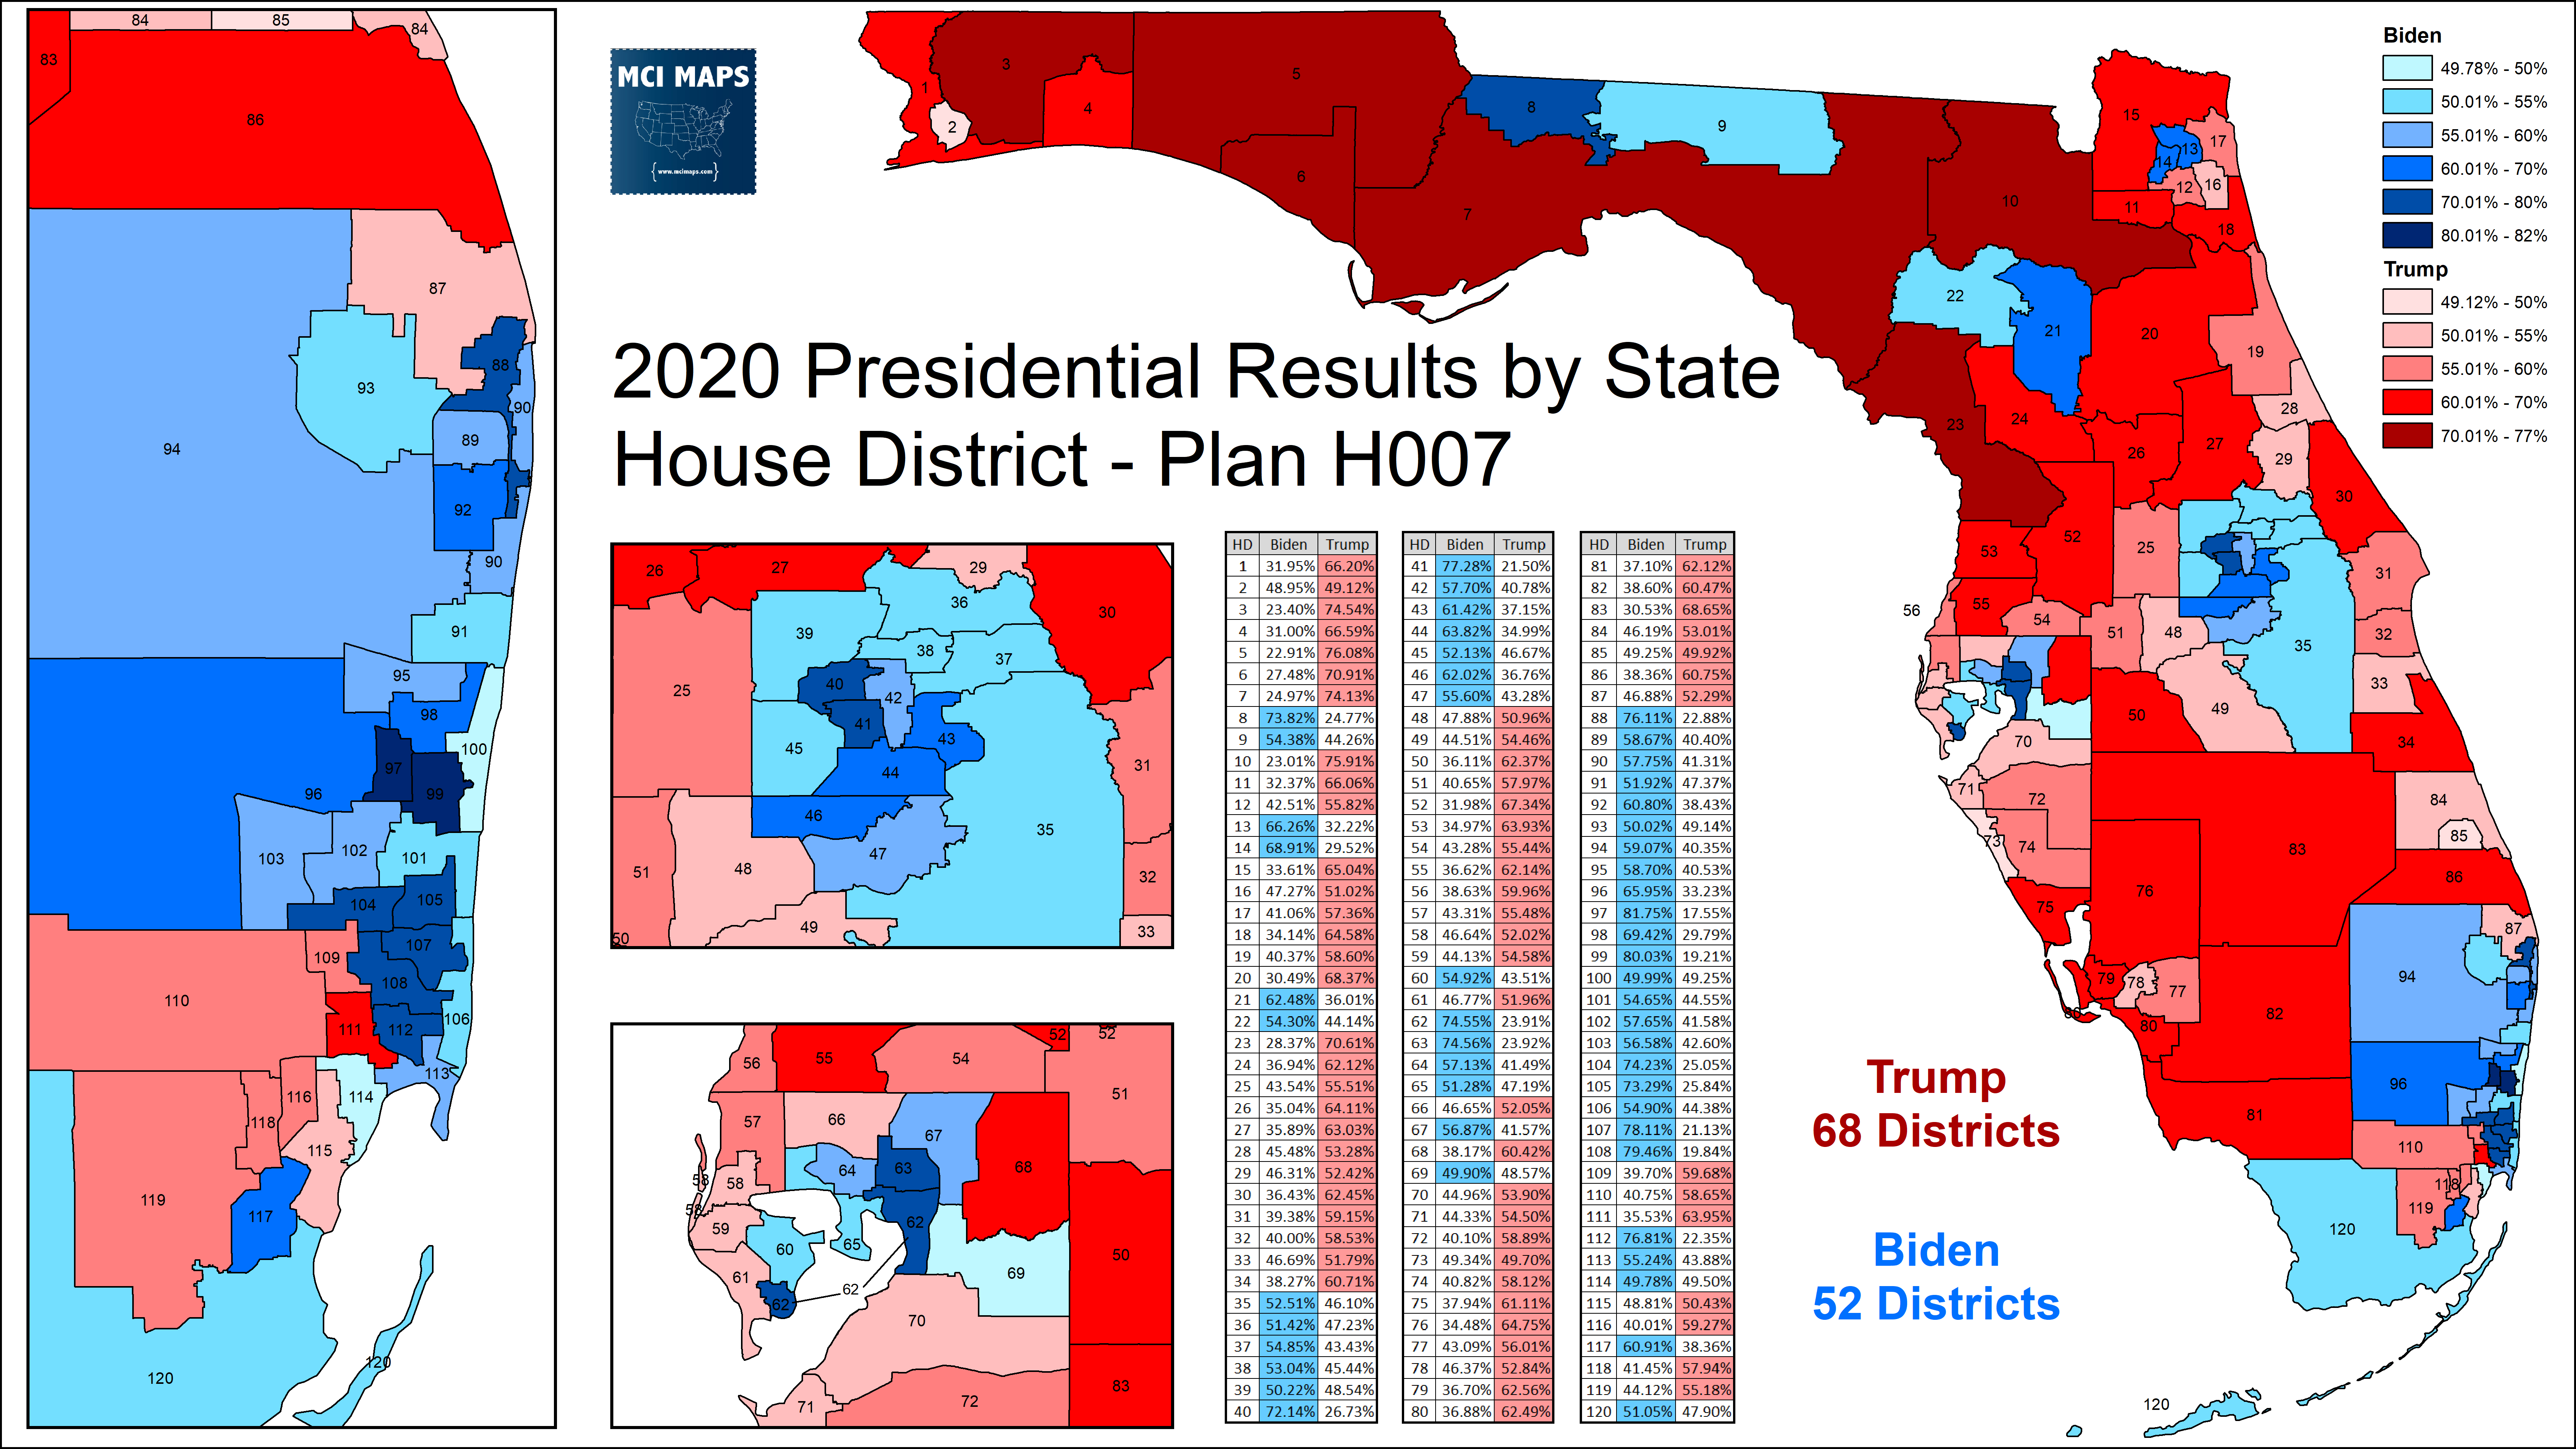
Biden did especially poor due to his collapse with Hispanic voters. In the races for Governor and Senator from 2018, the breakdowns were closer.

The plans do give Republicans key advantages, namely with Democrats winning several very narrow races while the GOP has fewer “at risk” seats. Democrats do get new districts, especially around Orlando, thanks to the massive population growth in the region.
Plan 8005 is a more aggressive plan in different parts of the state; though there is some trade-off in different regions. I will be going through multiple regions of the state over multiple articles; examining what these drafts (and any future drafts) are doing.
This article will cover the plans for the Polk County. I want to give focus to an area less covered in redistricting. A vast majority of attention centers on the dense regions – where many districts are located. However, smaller and medium counties need to be focused on as well.
The “Sandboxes” of the Florida House Drafts
As mentioned, the state house has released two drafts for their chamber. Looking closer at the drafts, we see that several districts are the same in both plans. Other regions of the state are isolated as “sandboxes” – where certain geographies have alternative borders internally – but a static outside border. The map below shows these sandboxes. As the map shows, the state is actually divided into several regions. Some seats are the same in both plans (and hence filled in with colors). Otherwise, some areas are set up for alternative lines of two or more seats. This is a similar story to what the state senate has done – which I covered here.
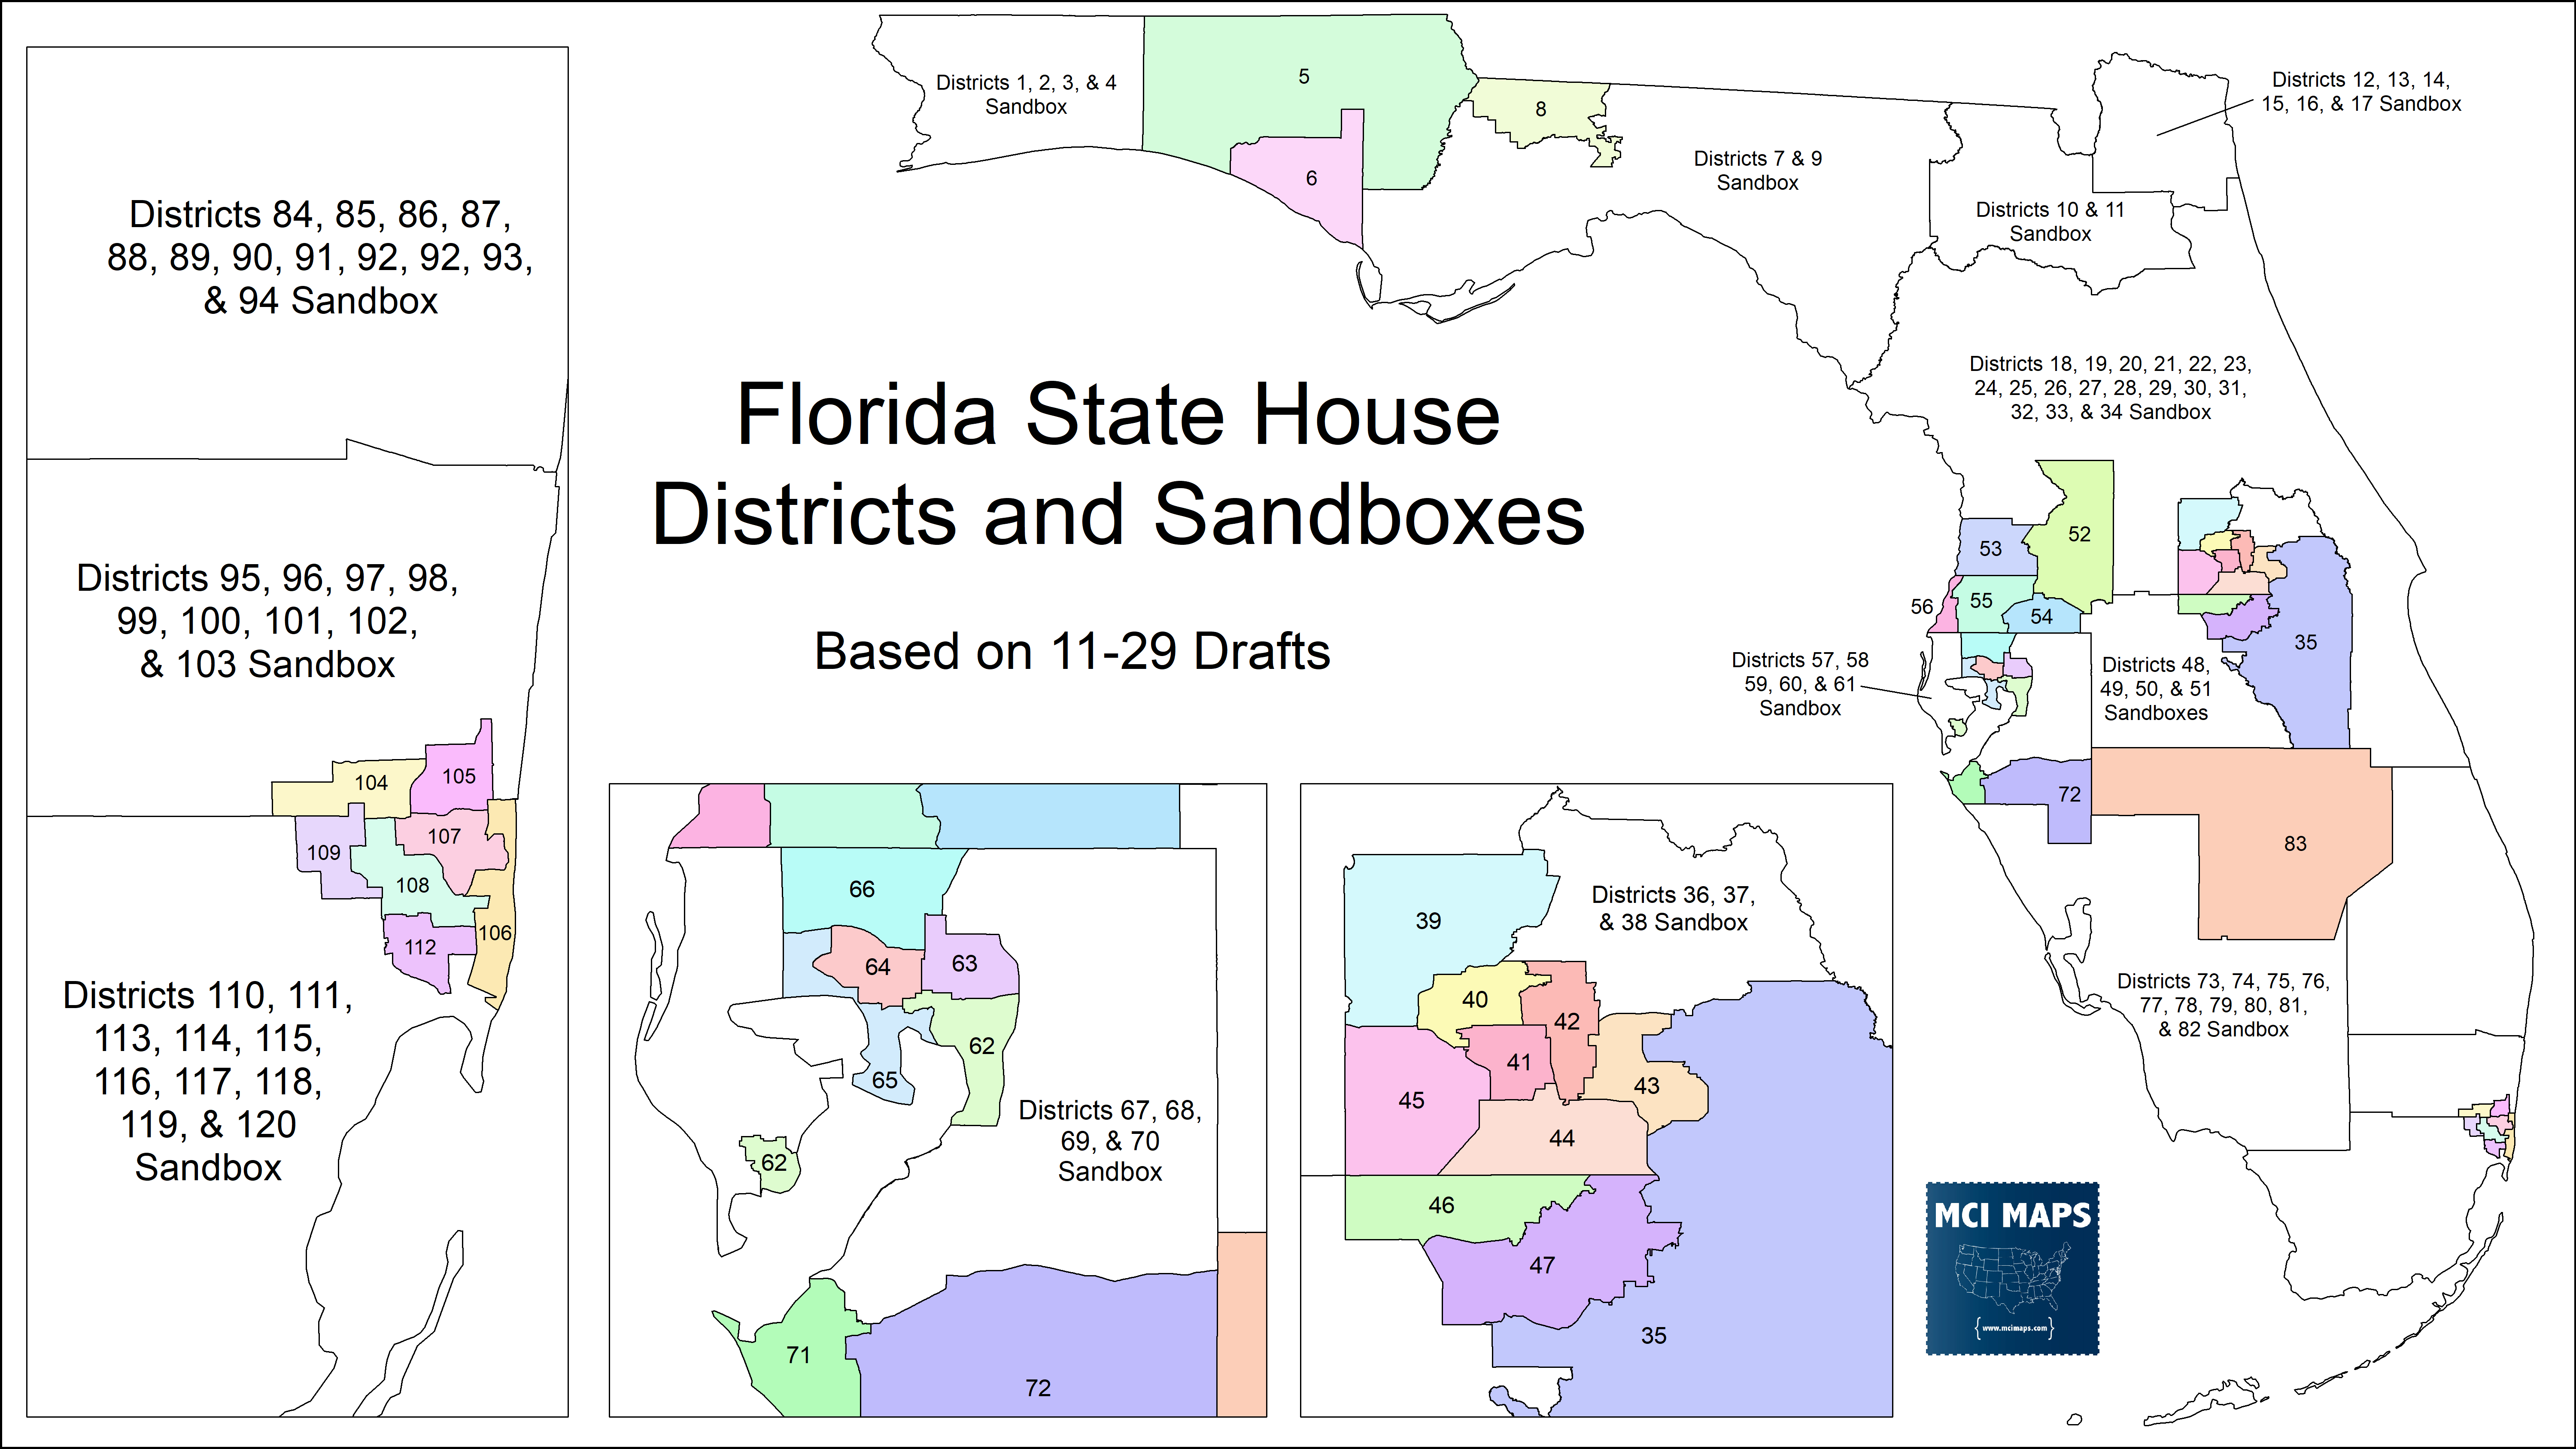
As you can see from the map, Polk County itself is a sandbox. Four house seats can perfectly fit in the county. As a result, the house has two plans for the county – making it a sandbox of its own. Each draft has a different way to draw Polk’s districts.
In my article on possible house districts for the Orlando region, I talked about how it wouldn’t be hard for 35%+ Hispanic district to be drawn in Polk County. My proposal, seen below, would cover the growing Hispanic population of the Northeast end of Polk.

I openly opined such a plan was unlikely since this district would have been around Biden +9; not something the GOP map-drawers would want to concede.
With the drafts now out for the state house, we aren’t getting lines like what I offered. However, the difference between the two drafts do have some notable differences; with one plan seeming much more blatantly partisan than the other.
Different Plans for Polk
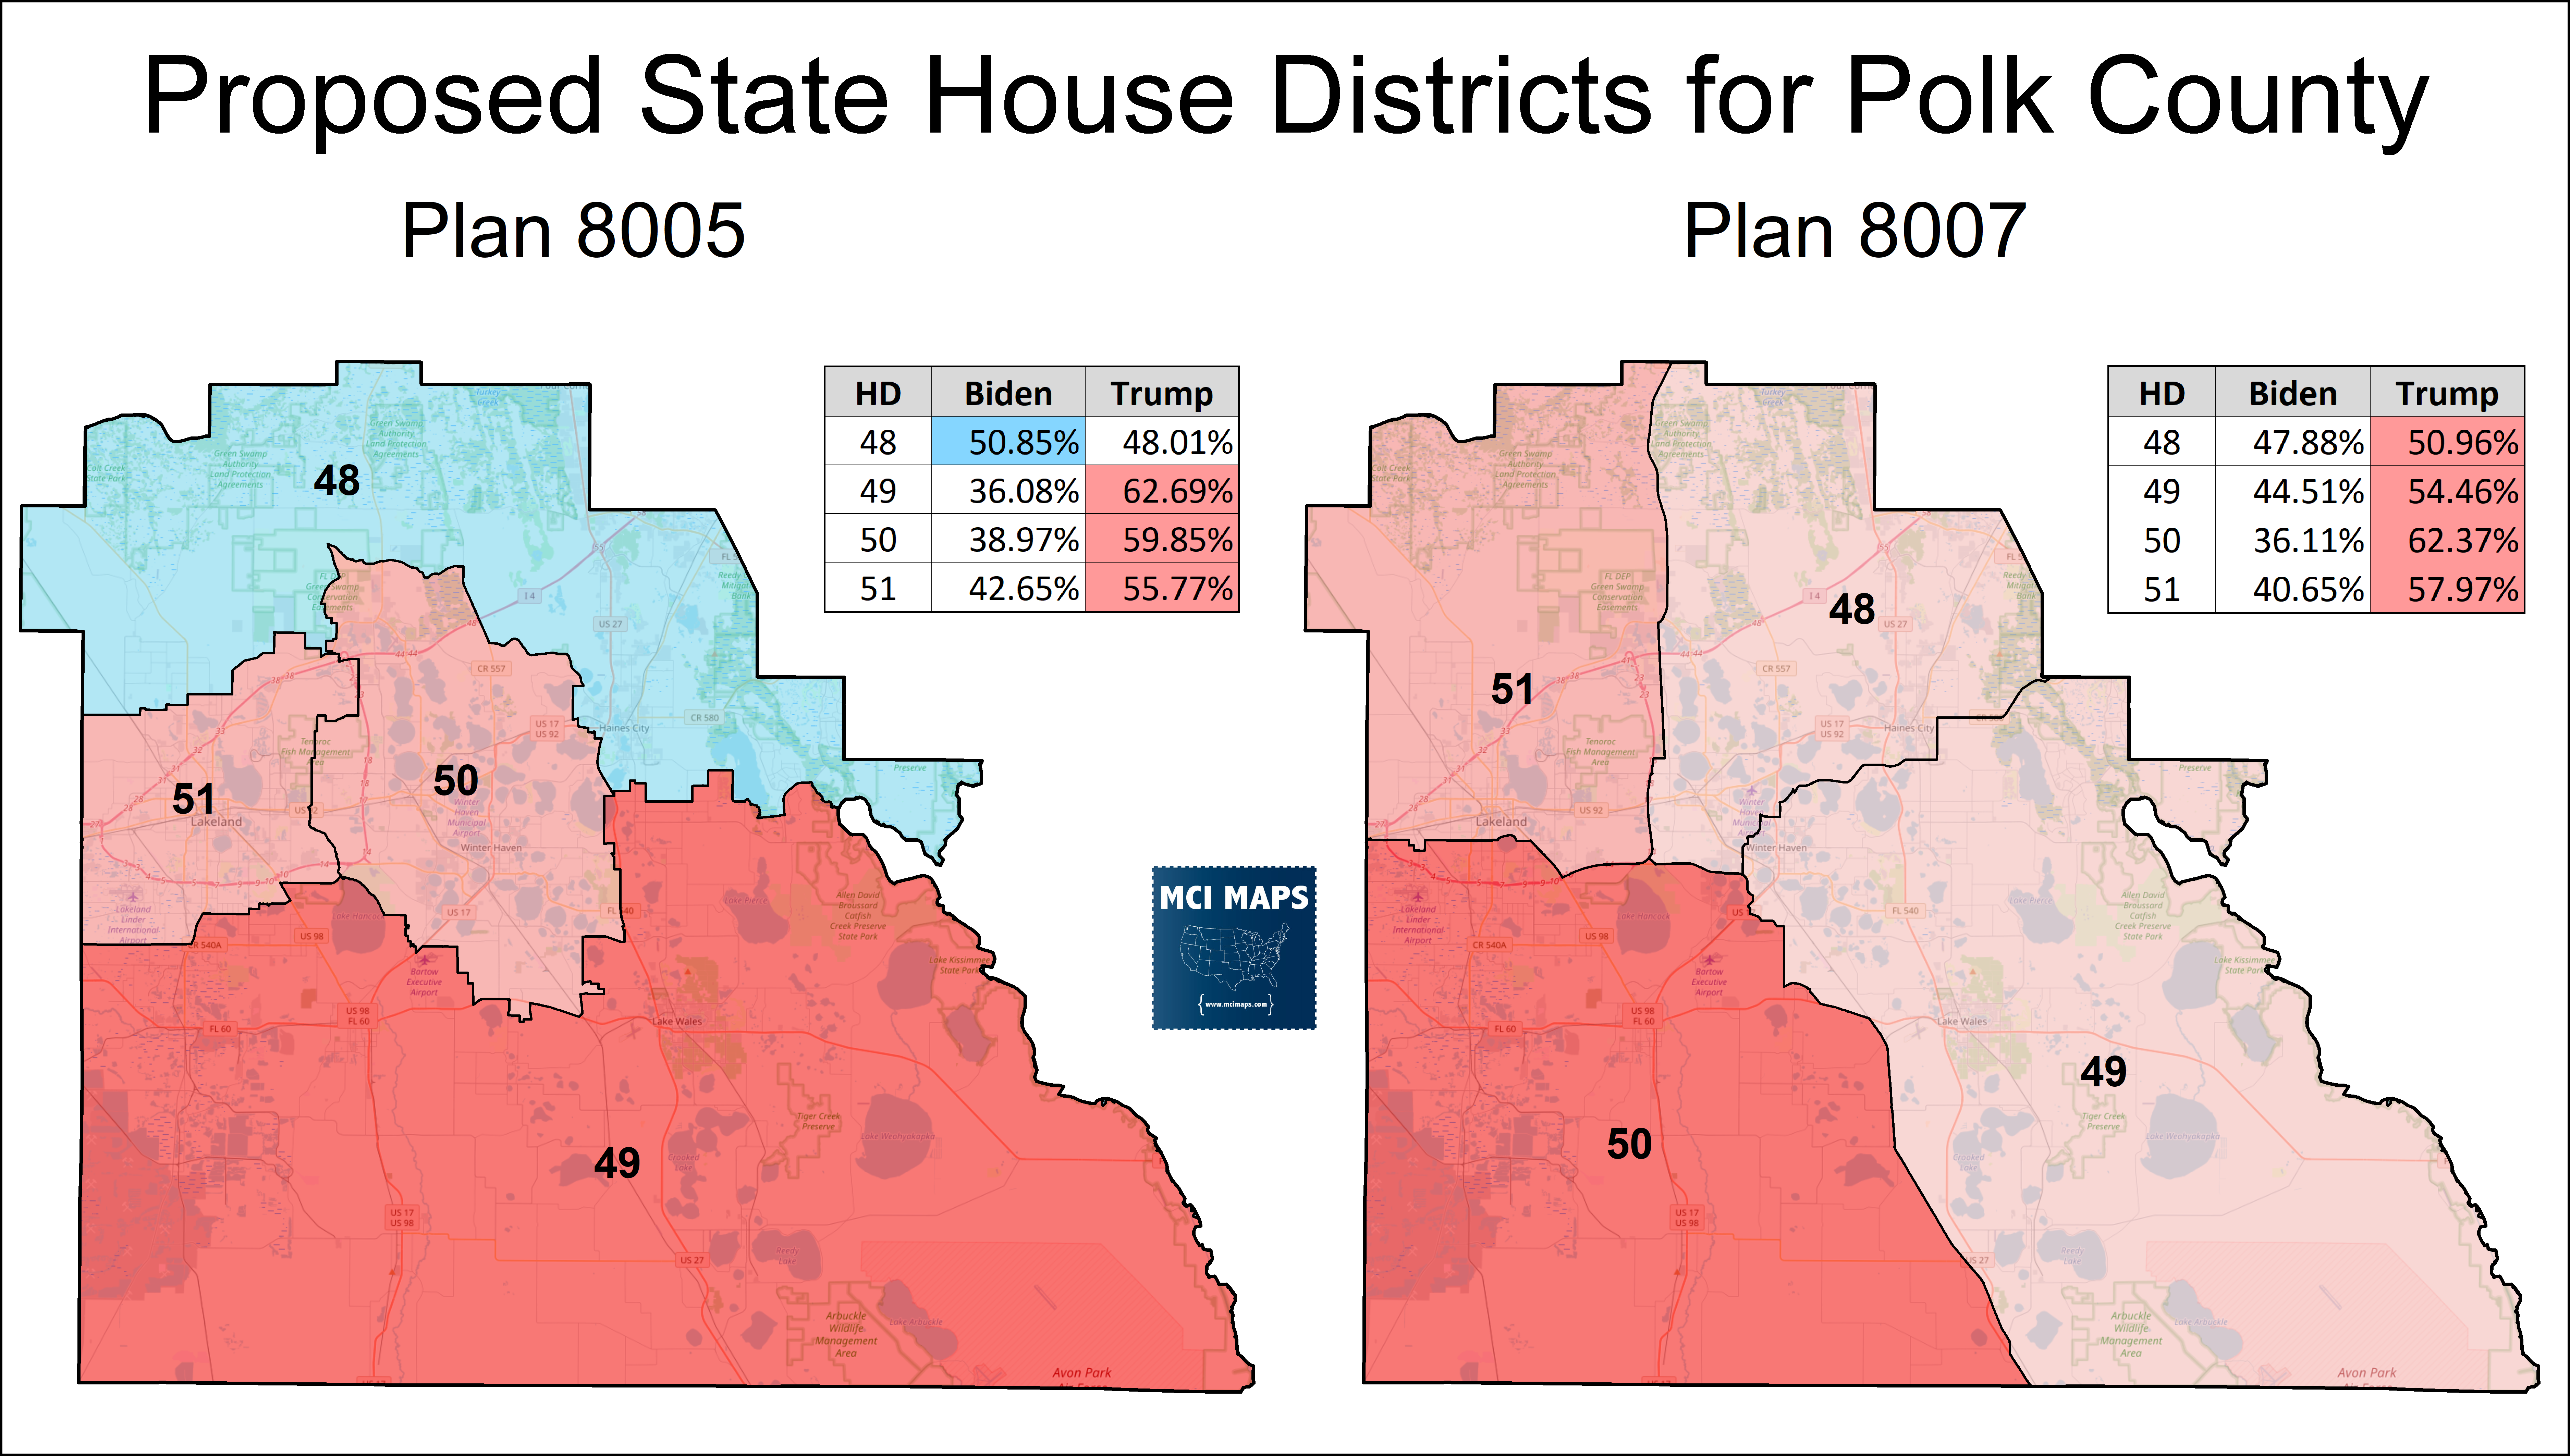
Plan 8005 divides Polk County as seen below. The plan creates a north and south district, while two seats rest in the center; covering the denser communities along the I-4.
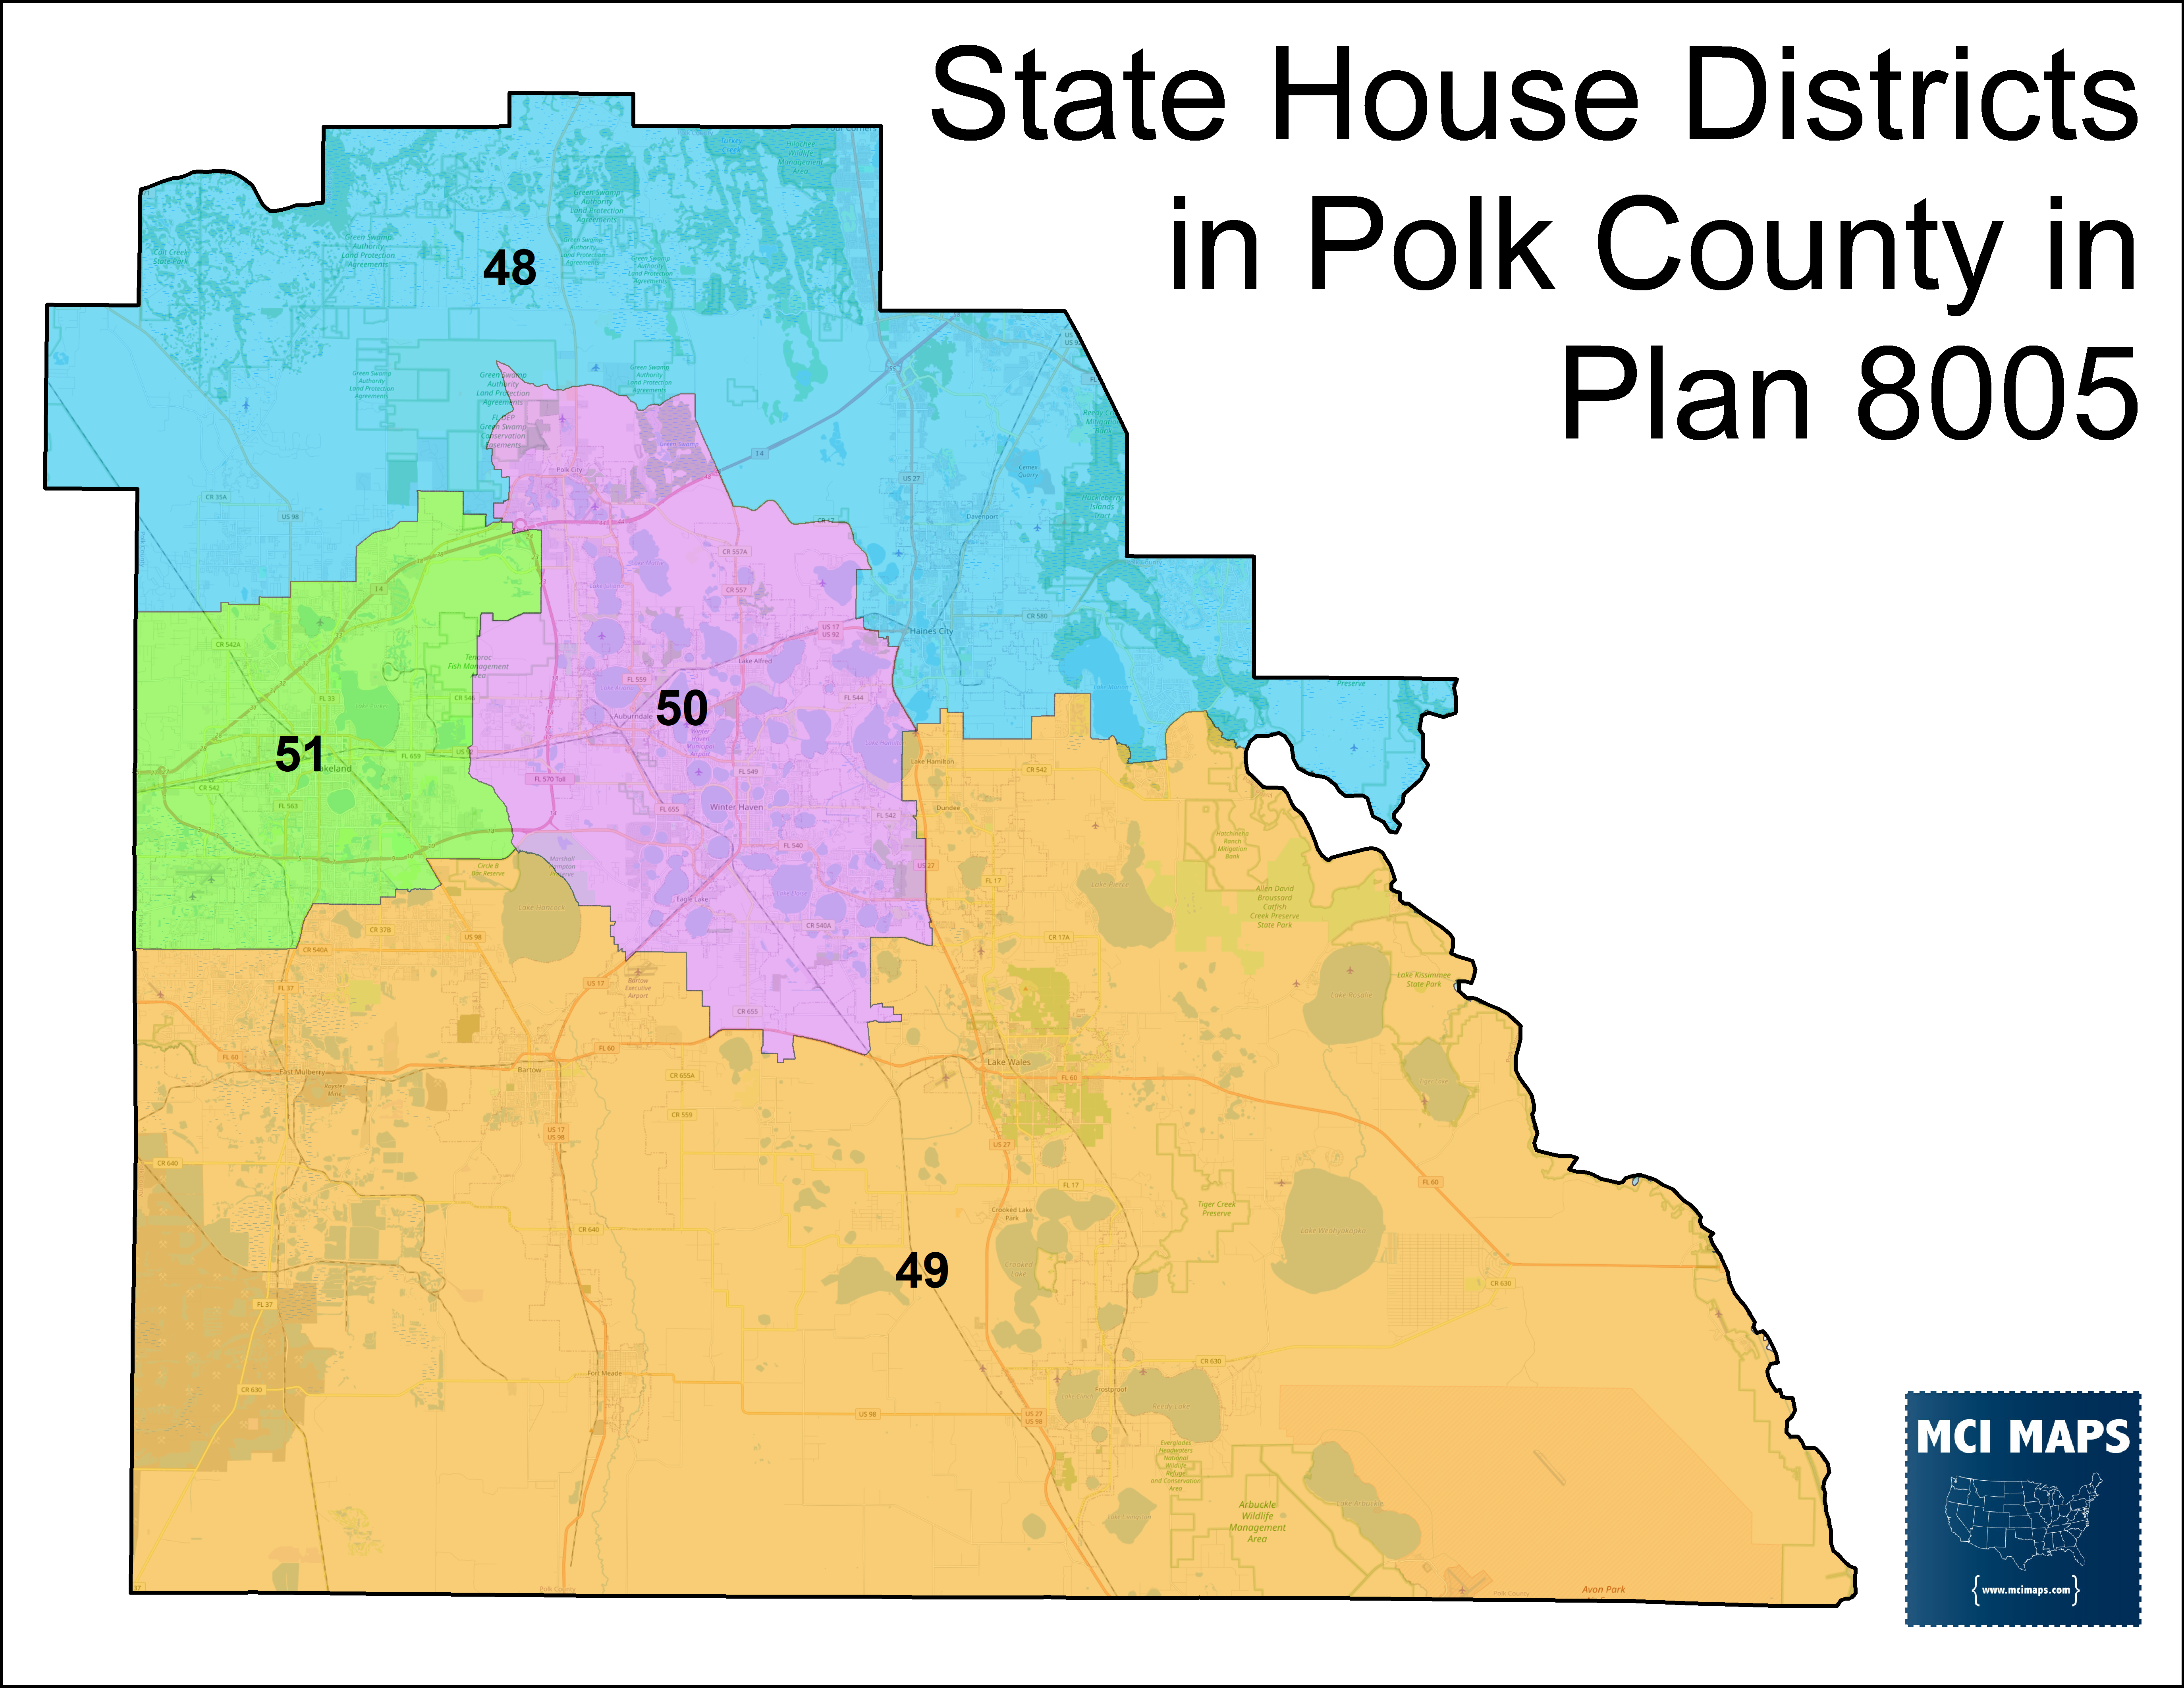
This plan takes a good deal of care to create districts for the largest cities in Polk. The lines work around the largest cities, ensuring they remain whole.
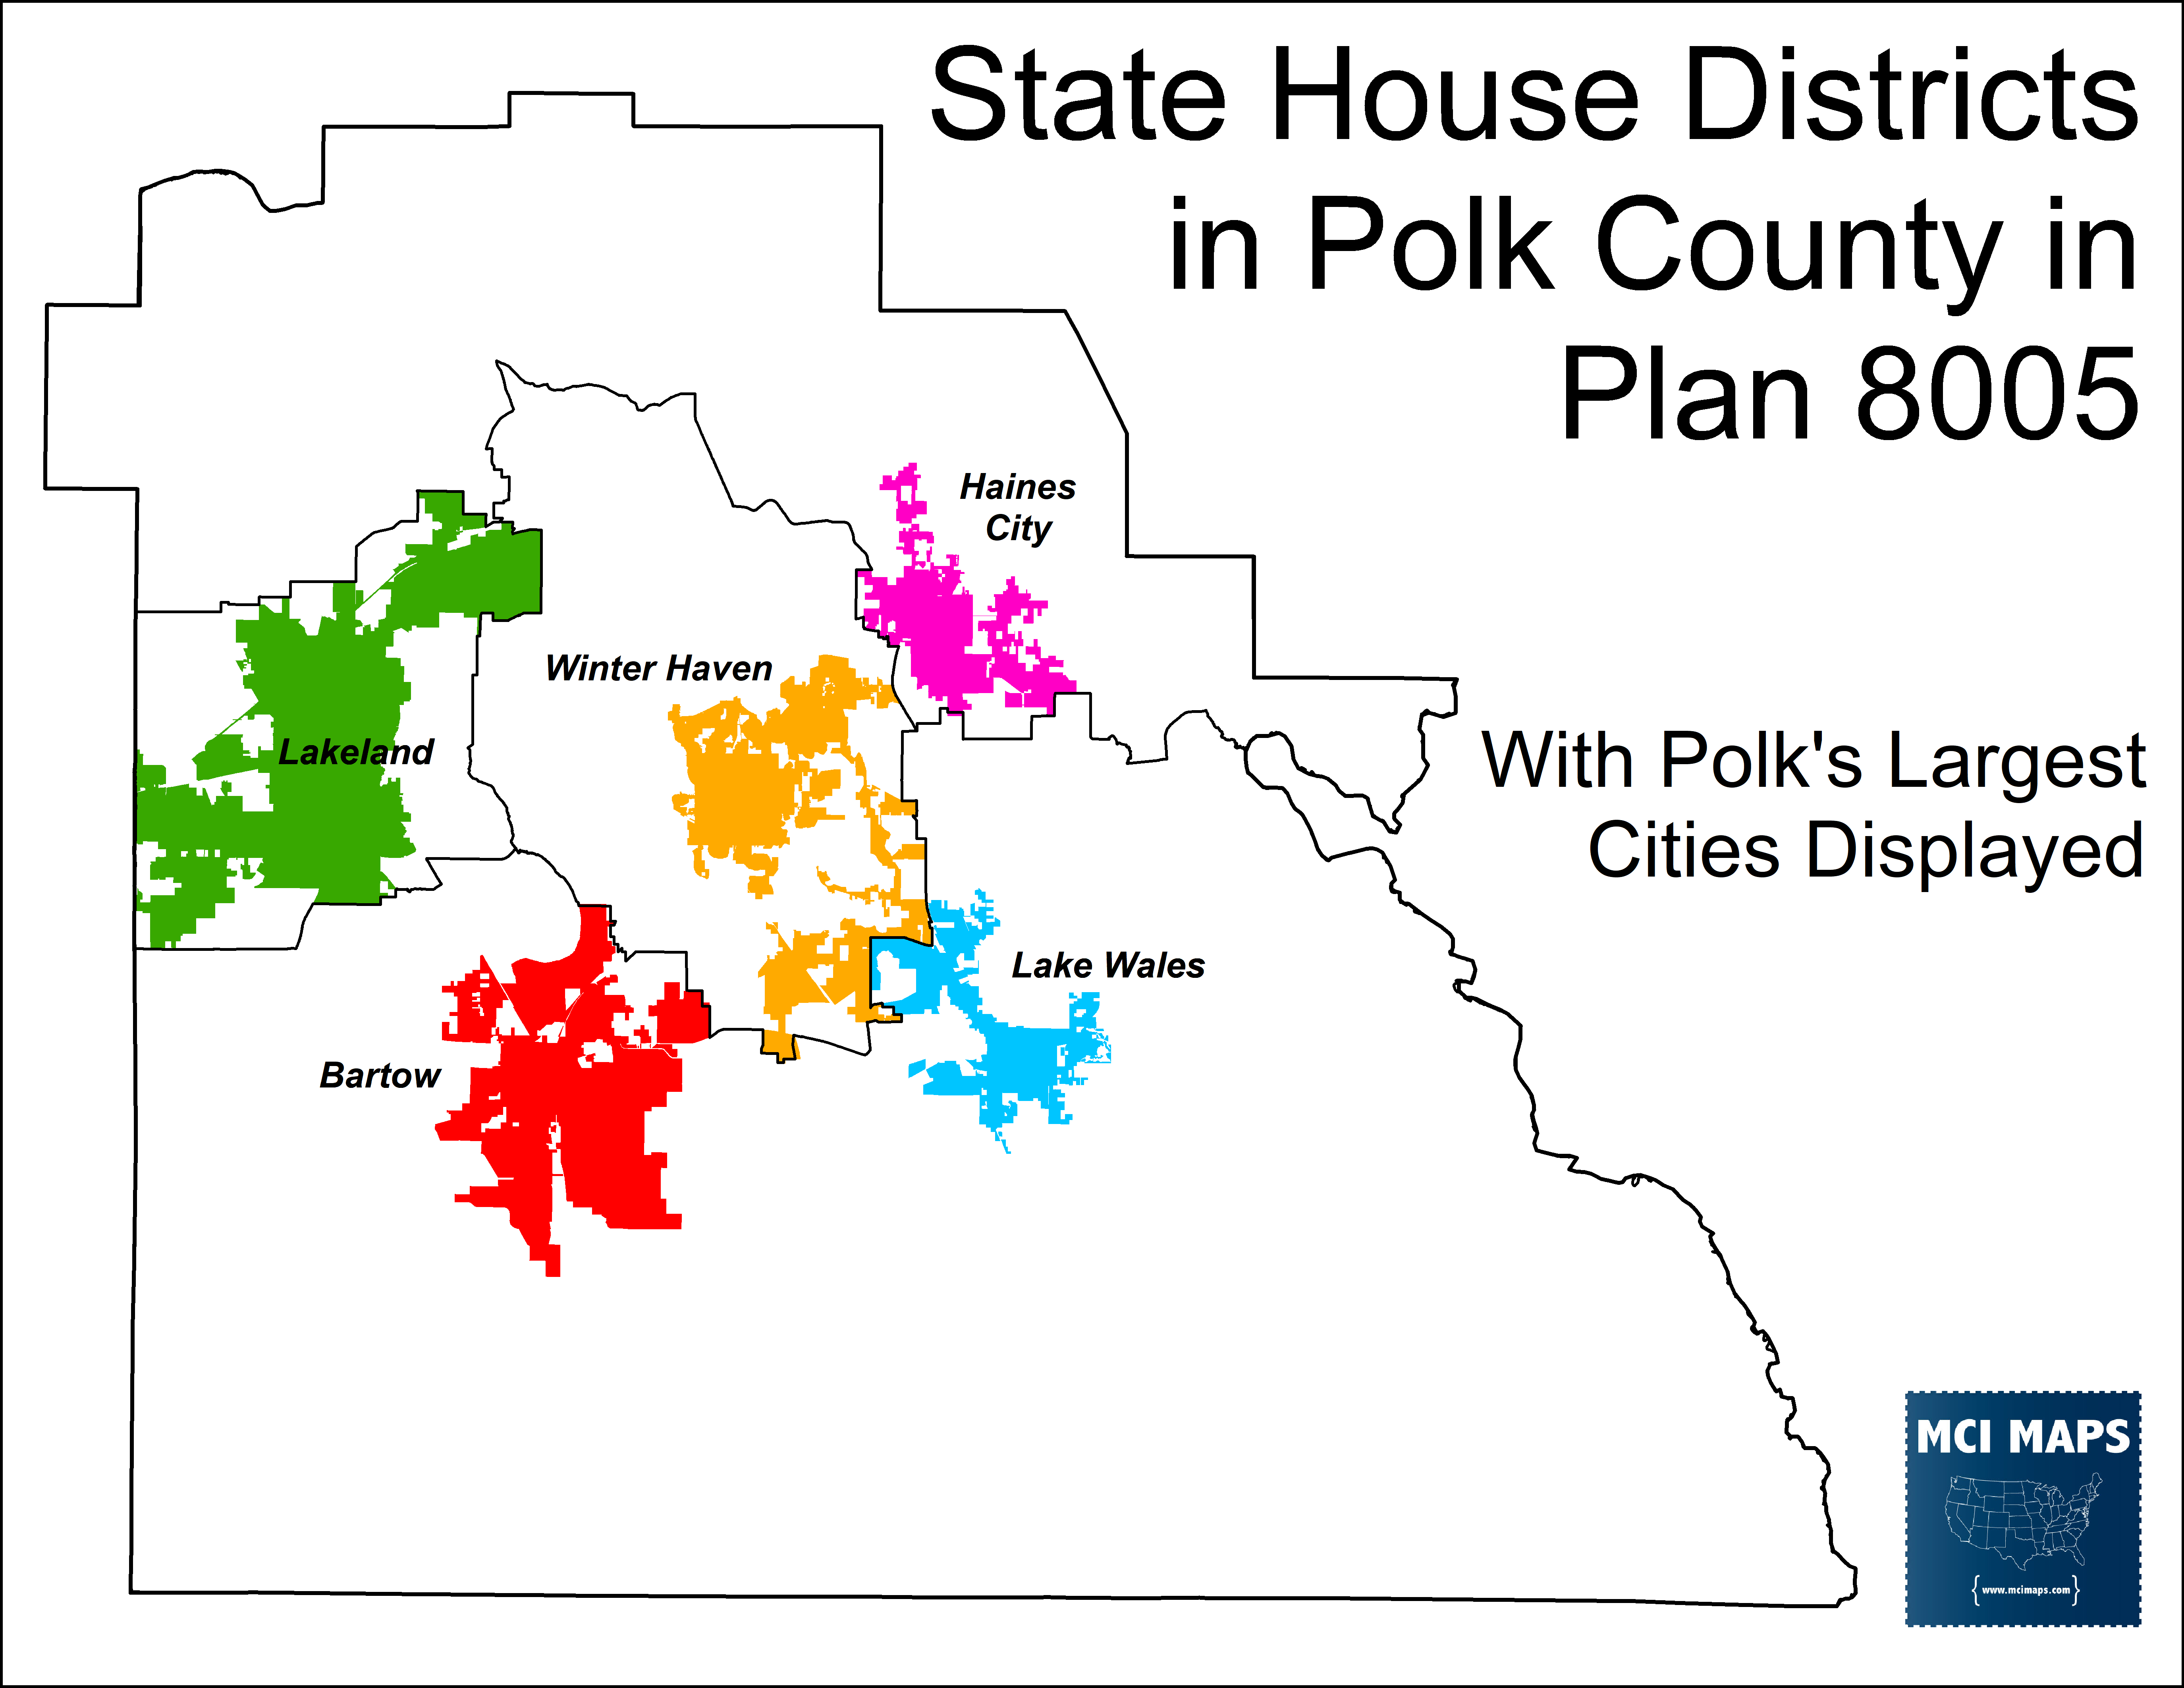
This means plan 8005 does a good job of adhering to Tier 2 of the Fair Districts Proposals – which call for keeping city/counties whole when possible. This criteria can be met in Polk with plan 8005.
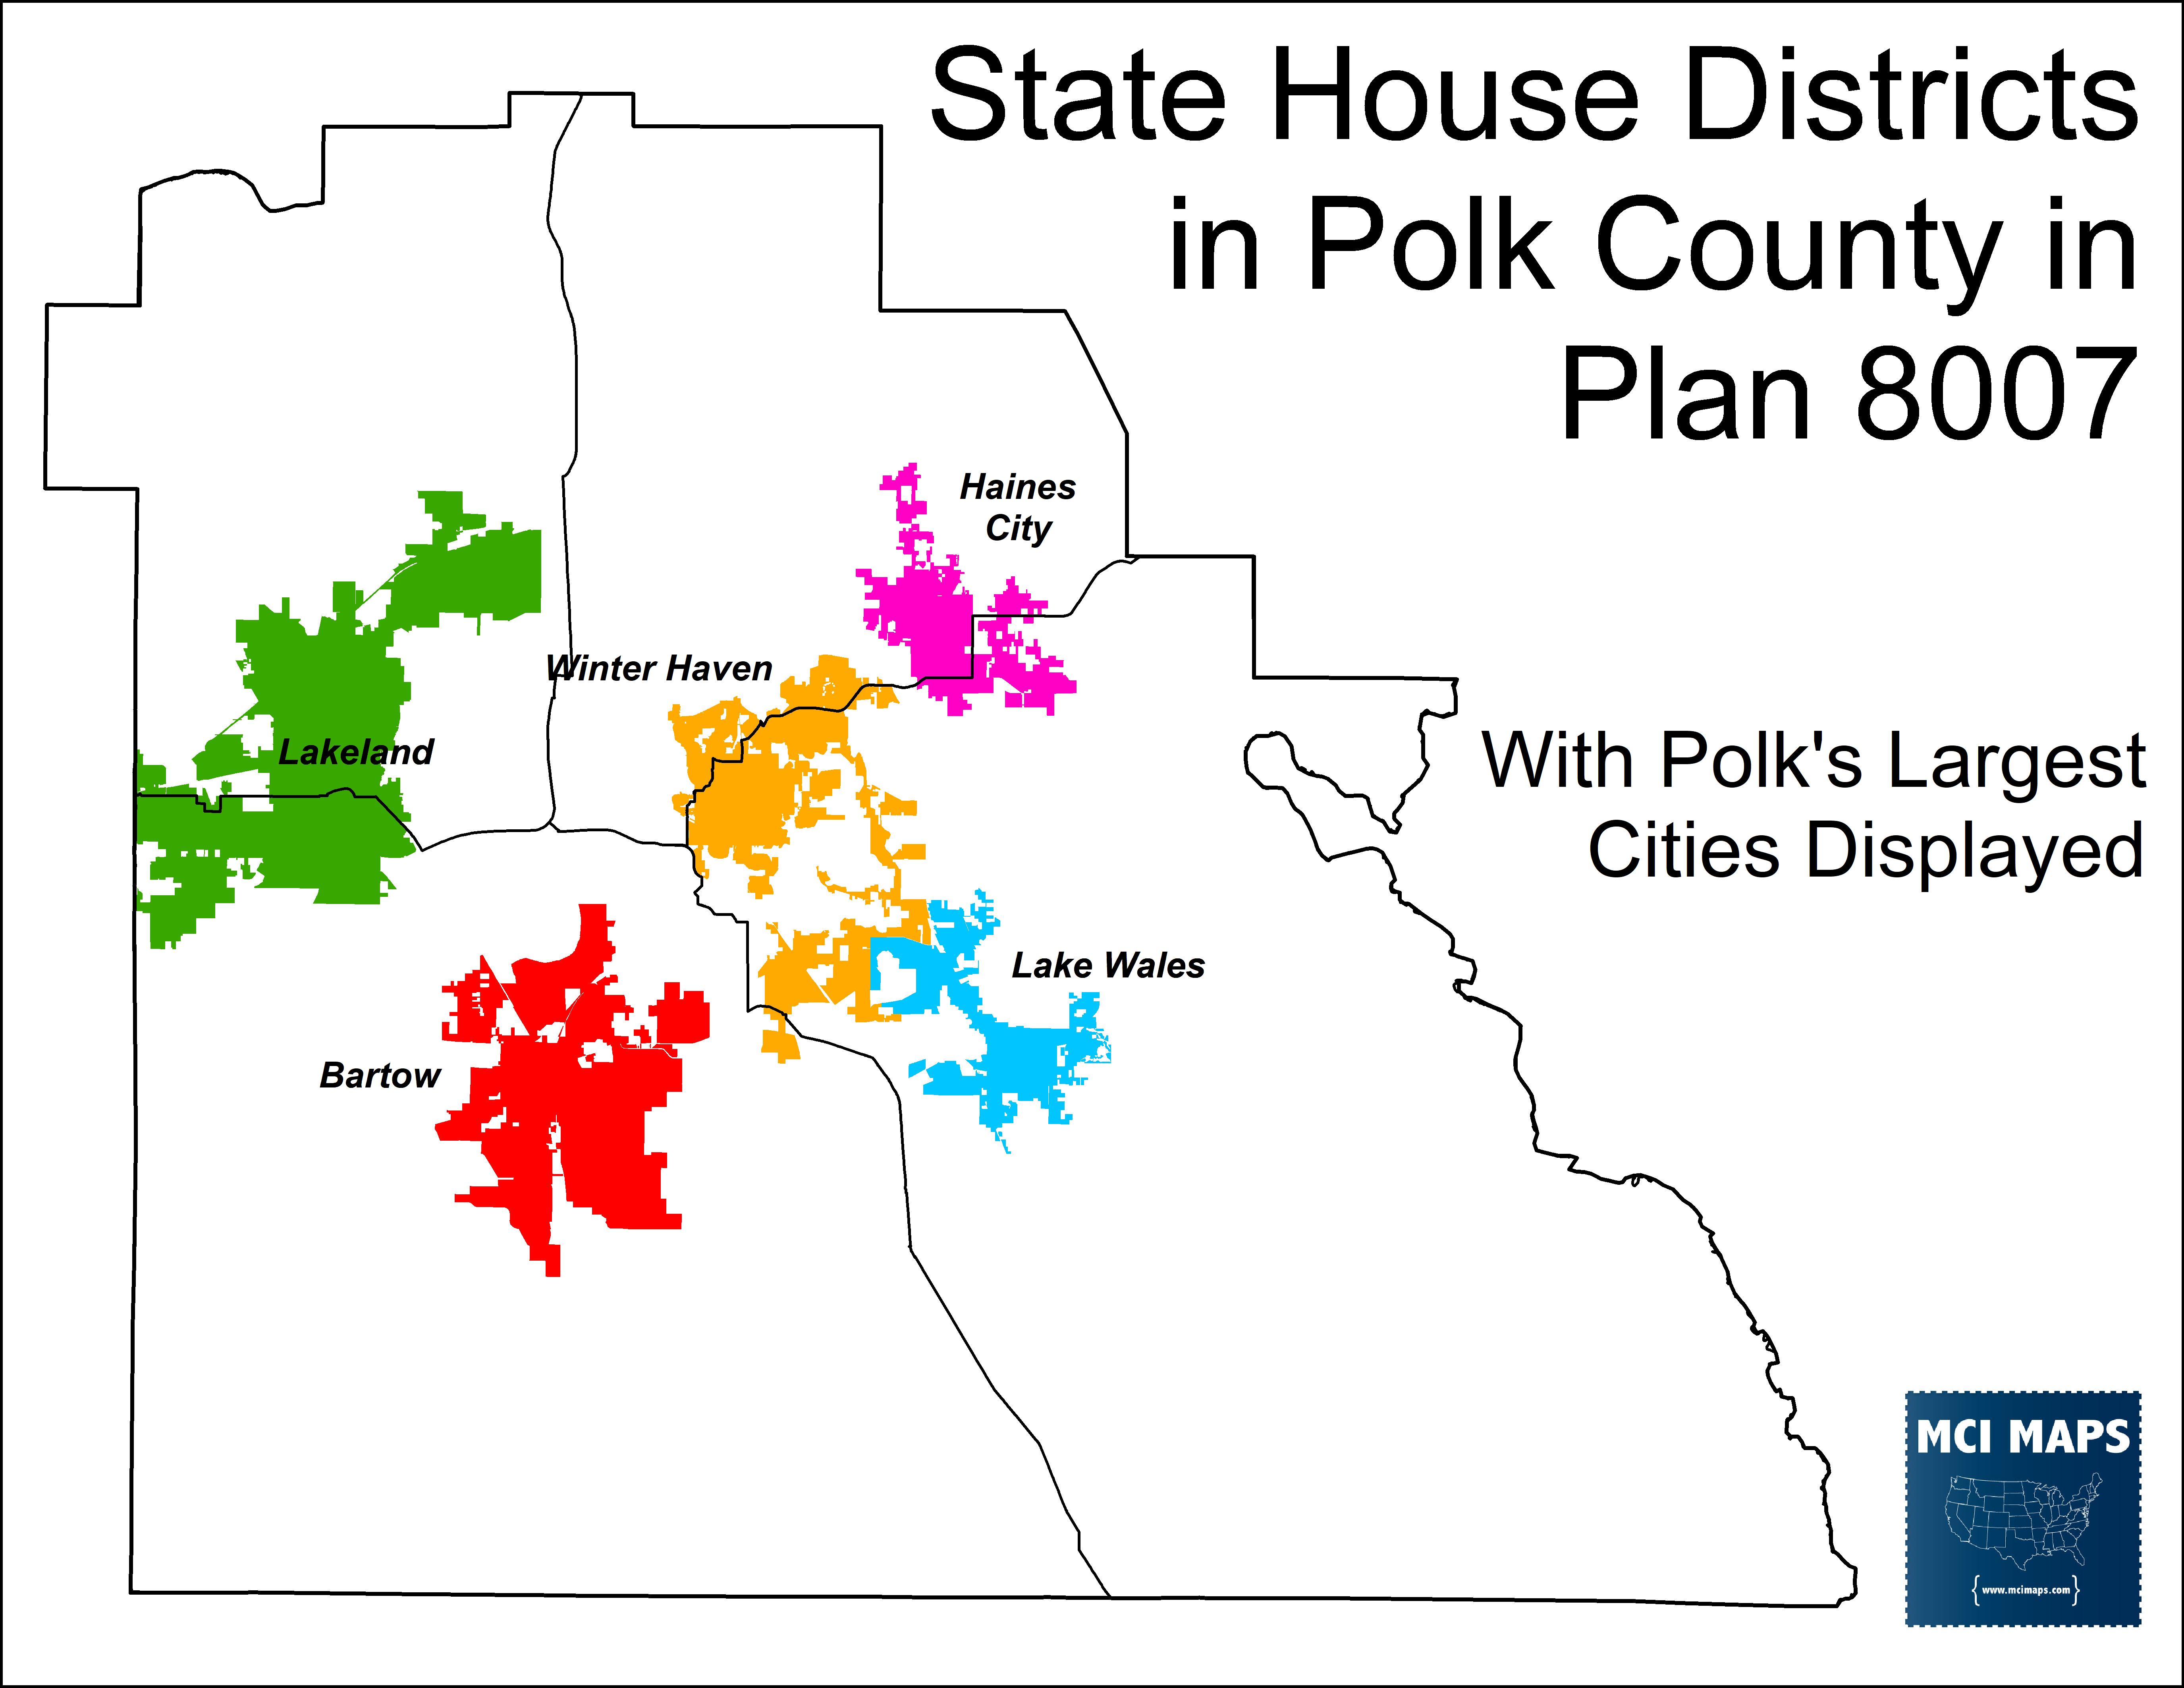
Plan 8007, meanwhile, divides Polk into four corners, almost like a pizza cut up.
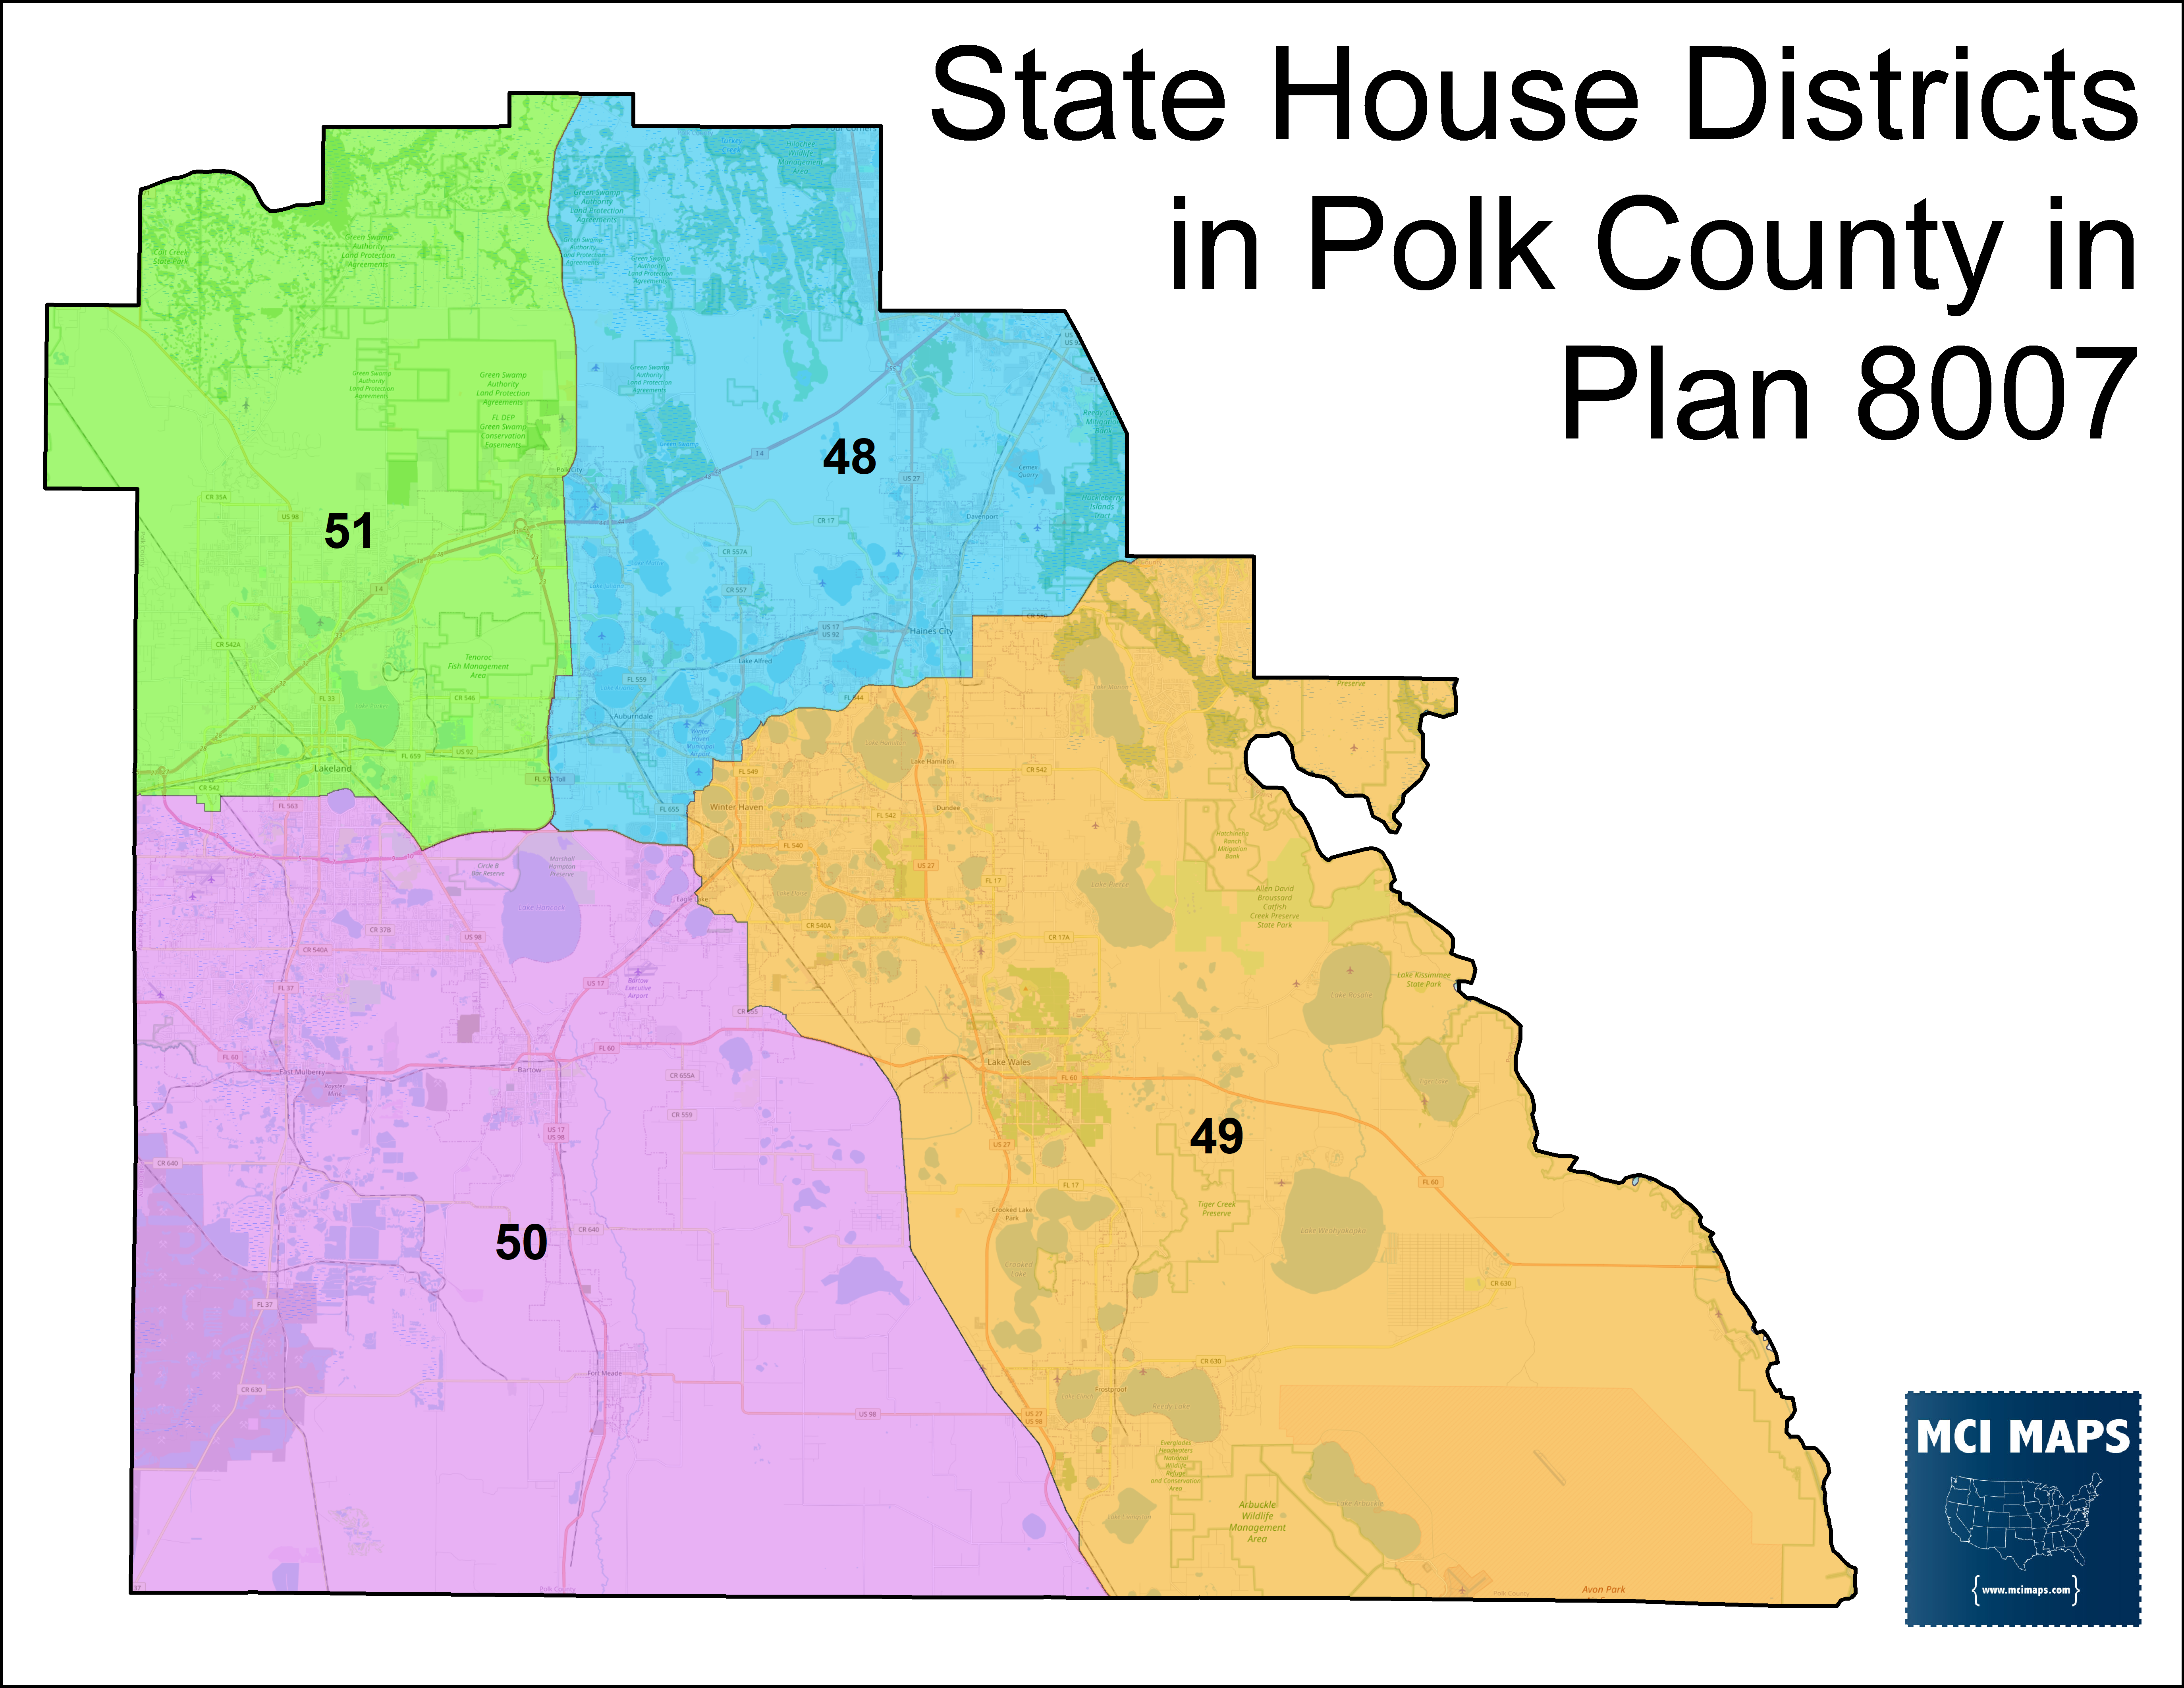
This plan does not take as much care to keep cities whole. Lakeland, Winter Haven, and Haines City are all split by these lines.
It is hard to look at the different plans and not see partisan reasoning behind plan 8007. With plan 8005, which takes care to keep the big cities whole, there is a Biden +3 seat located in the north-end of the county. In our pizza-pie layout for 8007, the closest district is Trump +3.
I’d be curious to hear any justification for plan 8007 over 8005. Any Tier 1 consideration (such as racial concerns) does not match up.
- Plan 8005 has HD48 at 48% white VAP and 35% Hispanic VAP.
- Plan 8007 has HD48 at 52% white VAP and 30% Hispanic VAP.
In all plans, and even any plan I draw, you cannot get to a functionally Hispanic seat. However, as I’ve discussed many times before, you can draw lines with consideration toward future demographic growth. A Hispanic-majority district in Polk is likely inevitable. Plan 8005’s plan would likely lead to that sooner than 8007.
Conclusion
The different plans in Polk County reveal the hidden (possible) gerrymandering that can occur in regions not often subject to major coverage. One plan here takes care with city borders while the other does not. It also so happens one might give Democrats a seat in what is otherwise a red county. However, a 3-1 delegation split would make sense for Polk.
There are more counties where such differences exist. Polk County highlights how its important to look at the WHOLE map – not just the dense urban centers.