Over the last 20 years, Florida’s reputation as a swing state has endured. The state’s population continues to grow at a fast rate, recently propelling Florida past New York, making the state the 3rd largest in the nation. Yet while other states have seen population shifts effect the political leanings of the state; Florida has generally remained a swing state in Presidential politics since the 1990s.
Migration into Florida has come from the Midwest, South, and Northeast; while the population of those born outside the US has risen dramatically in recent decades. Many of the new residents from Northern States have been Republicans while others have been Democrats. Many Northern migrants have been more Republican suburbanites, while others have been more urban/liberals. Meanwhile the growing out-of-US population has also had its share of Democrats and Republicans. A growing Puerto Rican population is heavily Democratic, while the Cuban immigrants have been historically Republican, with the exception of the millennial generation. Overall, Florida’s competitiveness during Presidential elections has held from 1992-2012. The state still leans more Republican than the nation, and the GOP controls the state Government thanks to a money advantage and 2 decades of gerrymandering. Democrats have actually seen a reversal of fortune from the 1980s, where the GOP dominated Florida in the Presidency but Democrats maintained control of the state Government (for the most part). Since the 1990s, the GOP has taken control of the legislature and cabinet. However, Democrats have still been competitive in Presidential elections, winning 3 of the last 7, and the last three Gubernatorial Elections were decided by around 1% or less.
The population growth of just the last 20 years has transformed the state but not caused Florida to fall off the swing state list. However, shifting populations and shifts in how different groups vote has effect the ways different counties in the state vote. Shifting electoral dynamics, from urban areas becoming more Democratic or rural voters growing more Republican, has also caused a major shift in how individual counties in Florida vote. All of these shifts have balanced out as both parties maintain a shot at the state’s electoral votes. To highlight this shift in support among the counties, I looked at the last 7 Presidential elections, all of which were competitive, to see how counties voted and by what margin.
It should be noted before delving into each election, that while the state has seen many shifts in population, there has been only marginal shifts in terms of each county’s share of the vote in Presidential elections. The map below shows how each county’s share of the statewide vote has shifted from 1992-2016. As the map shows, only a few counties saw there share rise or fall by more than 1%. Orange has seen the greatest growth, 1.4%, while Pinellas saw its share fall by 2.7%. Most counties saw their share shift by less than 0.5%. So when looking at maps back to 1992, yes some of these counties were worth more or less than they would be now, but the general dynamic remains the same. The more dramatic shifts, the huge growth of the Southeast and the I-4, began before the 1990s. All the major counties continue to see massive population increases, they just aren’t dramatically outpacing their neighbors.
With that said, lets look at the last seven Presidential elections and how the counties voted.
Presidential Elections 1992-2016
In looking at each Presidential election, I examined the margin that the county was one by, rather than just the percent a candidate won. In each election I provided a map of the win margin and a bar graph showing how many counties fell within different margins. Counties were categorized by win margins of 0-5%, 5-10%. 10-15%, 15-20%, and 20% of more. Counties that feel within the 0-5% range are referred to as swing counties (because of their narrow wins) in the election summaries below. You can select the maps to see larger versions.
1992
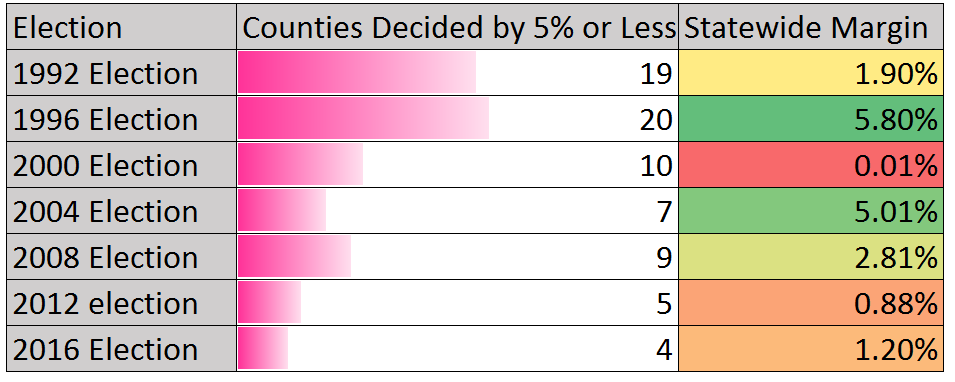
Bill Clinton narrowly lost Florida to Bush in 1992. Clinton had not counted on winning the state and hence invested fewer resources into it. Nevertheless, Clinton won 22 counties, several of them rural, and narrowly trailed in several others. 19 counties were won by 5% or less and only a handful were blow-outs.
It should be noted how few heavily GOP counties there were in this election despite Bush’s win. Many counties fell within swing or modest win zones. A shift of a few points statewide could have thrown several more counties into either the Bush or Clinton camps. Clinton did well in the Southeast and many traditional Democratic counties we have today, but the Orlando region was notably still in the red column.
1996
In Clinton’s 1996 blow-out of Bob Dole, the President won 32 counties,and 20 counties were decided by 5% or less. Clinton made several modestly GOP counties closer compared to 2012, while at the same time increasing his support in counties he won the first time, keeping the swing county number close to the same.

The 1996 bar graph shows even more counties clustered toward the middle, giving swing or modest wins. Only a handful of counties were heavily in the GOP or Democratic camp, Clinton’s win marked the last strong showing for a Democrat in the rural counties in a Presidential Election. Orange County, home to Orlando, is notably still red. Orange would become more blue as the share of non-white voters grew in the County.
2000
Al Gore won, I mean lost, Florida by the narrowest margin imaginable. On the county level, the number of swing counties fell to 10 as several swing counties became more GOP entrenched. The number of counties backing the GOP by 20% or more jumped from 9 to 20 as rural counties, most in North Florida, made hard-right shifts. Leon, meanwhile, fell into the 20%+ margin for Democrats and Orange became a blue county as population growth, especially among Hispanics, changed the county’s makeup. As urban counties like Dade, Orange, and Palm Beach continued to grow and become more diverse, they became more Democratic. Gore did worse than Clinton’s 1996 landslide win in some of these urban counties, but did better than his 1992 showing.
This election marked the beginning of a clear trend, the urban counties being firmly Democratic, and the rural counties going more Republican. Gore’s improvements over Clinton’s 1992 election (where the margin was close in Florida) showed a Democratic strength increase in those areas.
2004
Bush won Florida by 5% in 2004, narrowly falling short of Clinton’s 1996 showing. Bush managed to make Kerry perform worse than Gore in most urban counties and dramatically increased the number of 20%+ GOP margin counties. Bush continued to trend of the GOP locking up the small rural regions.
Kerry’s loss was a stumbling block for Democrats, as Bush continued the trend of the rural counties going more Republican. Meanwhile many urban counties saw weakened Democratic margins. Notably though, Miami-Dade’s Democratic margin of 6.2% was unchanged from 2000, despite Bush’s Hispanic appeal in 2004. Bush also improved the Republican margin with suburban counties on the west coast, increasing already solid GOP margins. Several counties that fell within 5% in 2000 (either for Gore or Bush) fell into the 5-10% camp for Bush, reducing the number of swing counties to 7.
2008
Obama won Florida by nearly 3% in 2008. He did this by moving modest GOP counties into the swing region, increasing the swing counties to 9. Meanwhile, he moved several blue counties further into the Democratic column; moving Osceola, Orange, and Miami-Dade into the 15-20% margin category. He even managed to decrease the number of counties that favored the GOP by 20% or more. Obama also made Duval, a large GOP county, much closer thanks to heavy minority registration and turnout drives with the African-American and student population there.

Obama’s 2008 win saw a major Democratic spike in urban counties. Counties with modest or swing Dem margins (like Orange and Miami-Dade) jumped into heavily Democratic columns. This was thanks not only to support from white suburbanites, but also massive registration increases in these counties, registering tens of thousands of minority voters. Obama also notably weakened GOP margins in west coast suburban counties, but those counties, heavily white, would fall back into stronger GOP columns in four years. The shift in the urban counties was not just indicative of Obama’s large 2008 win, as the trend continued four years later.
2012
Obama held onto Florida by just under a 1% margin. While Palm Beach and Alachua fell out of the 20%+ Dem category, Osceola and Miami-Dade replaced them by becoming even more Democratic. The number of counties 20%+ for the GOP increased and several red counties that fell within 5% in 2008 fell back to more solidly GOP territory. The number of swing counties fell to a low of 5. However, Obama’s improvement in major urban counties like Miami-Dade, while being able to stop major slippage in other urban areas like Hillsborough, Duval, and Orange, allowed him to win despite major fallout in the rural and suburban counties.

Obama’s increases in Osceola and Miami-Dade were thanks to increased efforts with the Hispanic community and keeping African-American turnout up. Heading into the election, huge registration efforts were done to shift the composition in these major counties. These increases in minority registration helped counter backsliding with white suburbanites who has backed Obama in 2008. White liberals in the urban counties also held firm in the Democratic column.
2016
Donald Trump won Florida by just over 1%. The county-level results showed further shifts to the right in Florida’s rural and working-class-white counties. Clinton, meanwhile, increased her margins in urban, diverse counties like Miami-Dade and Orange. In addition, suburban counties like Seminole and Duval moved closer to even splits.
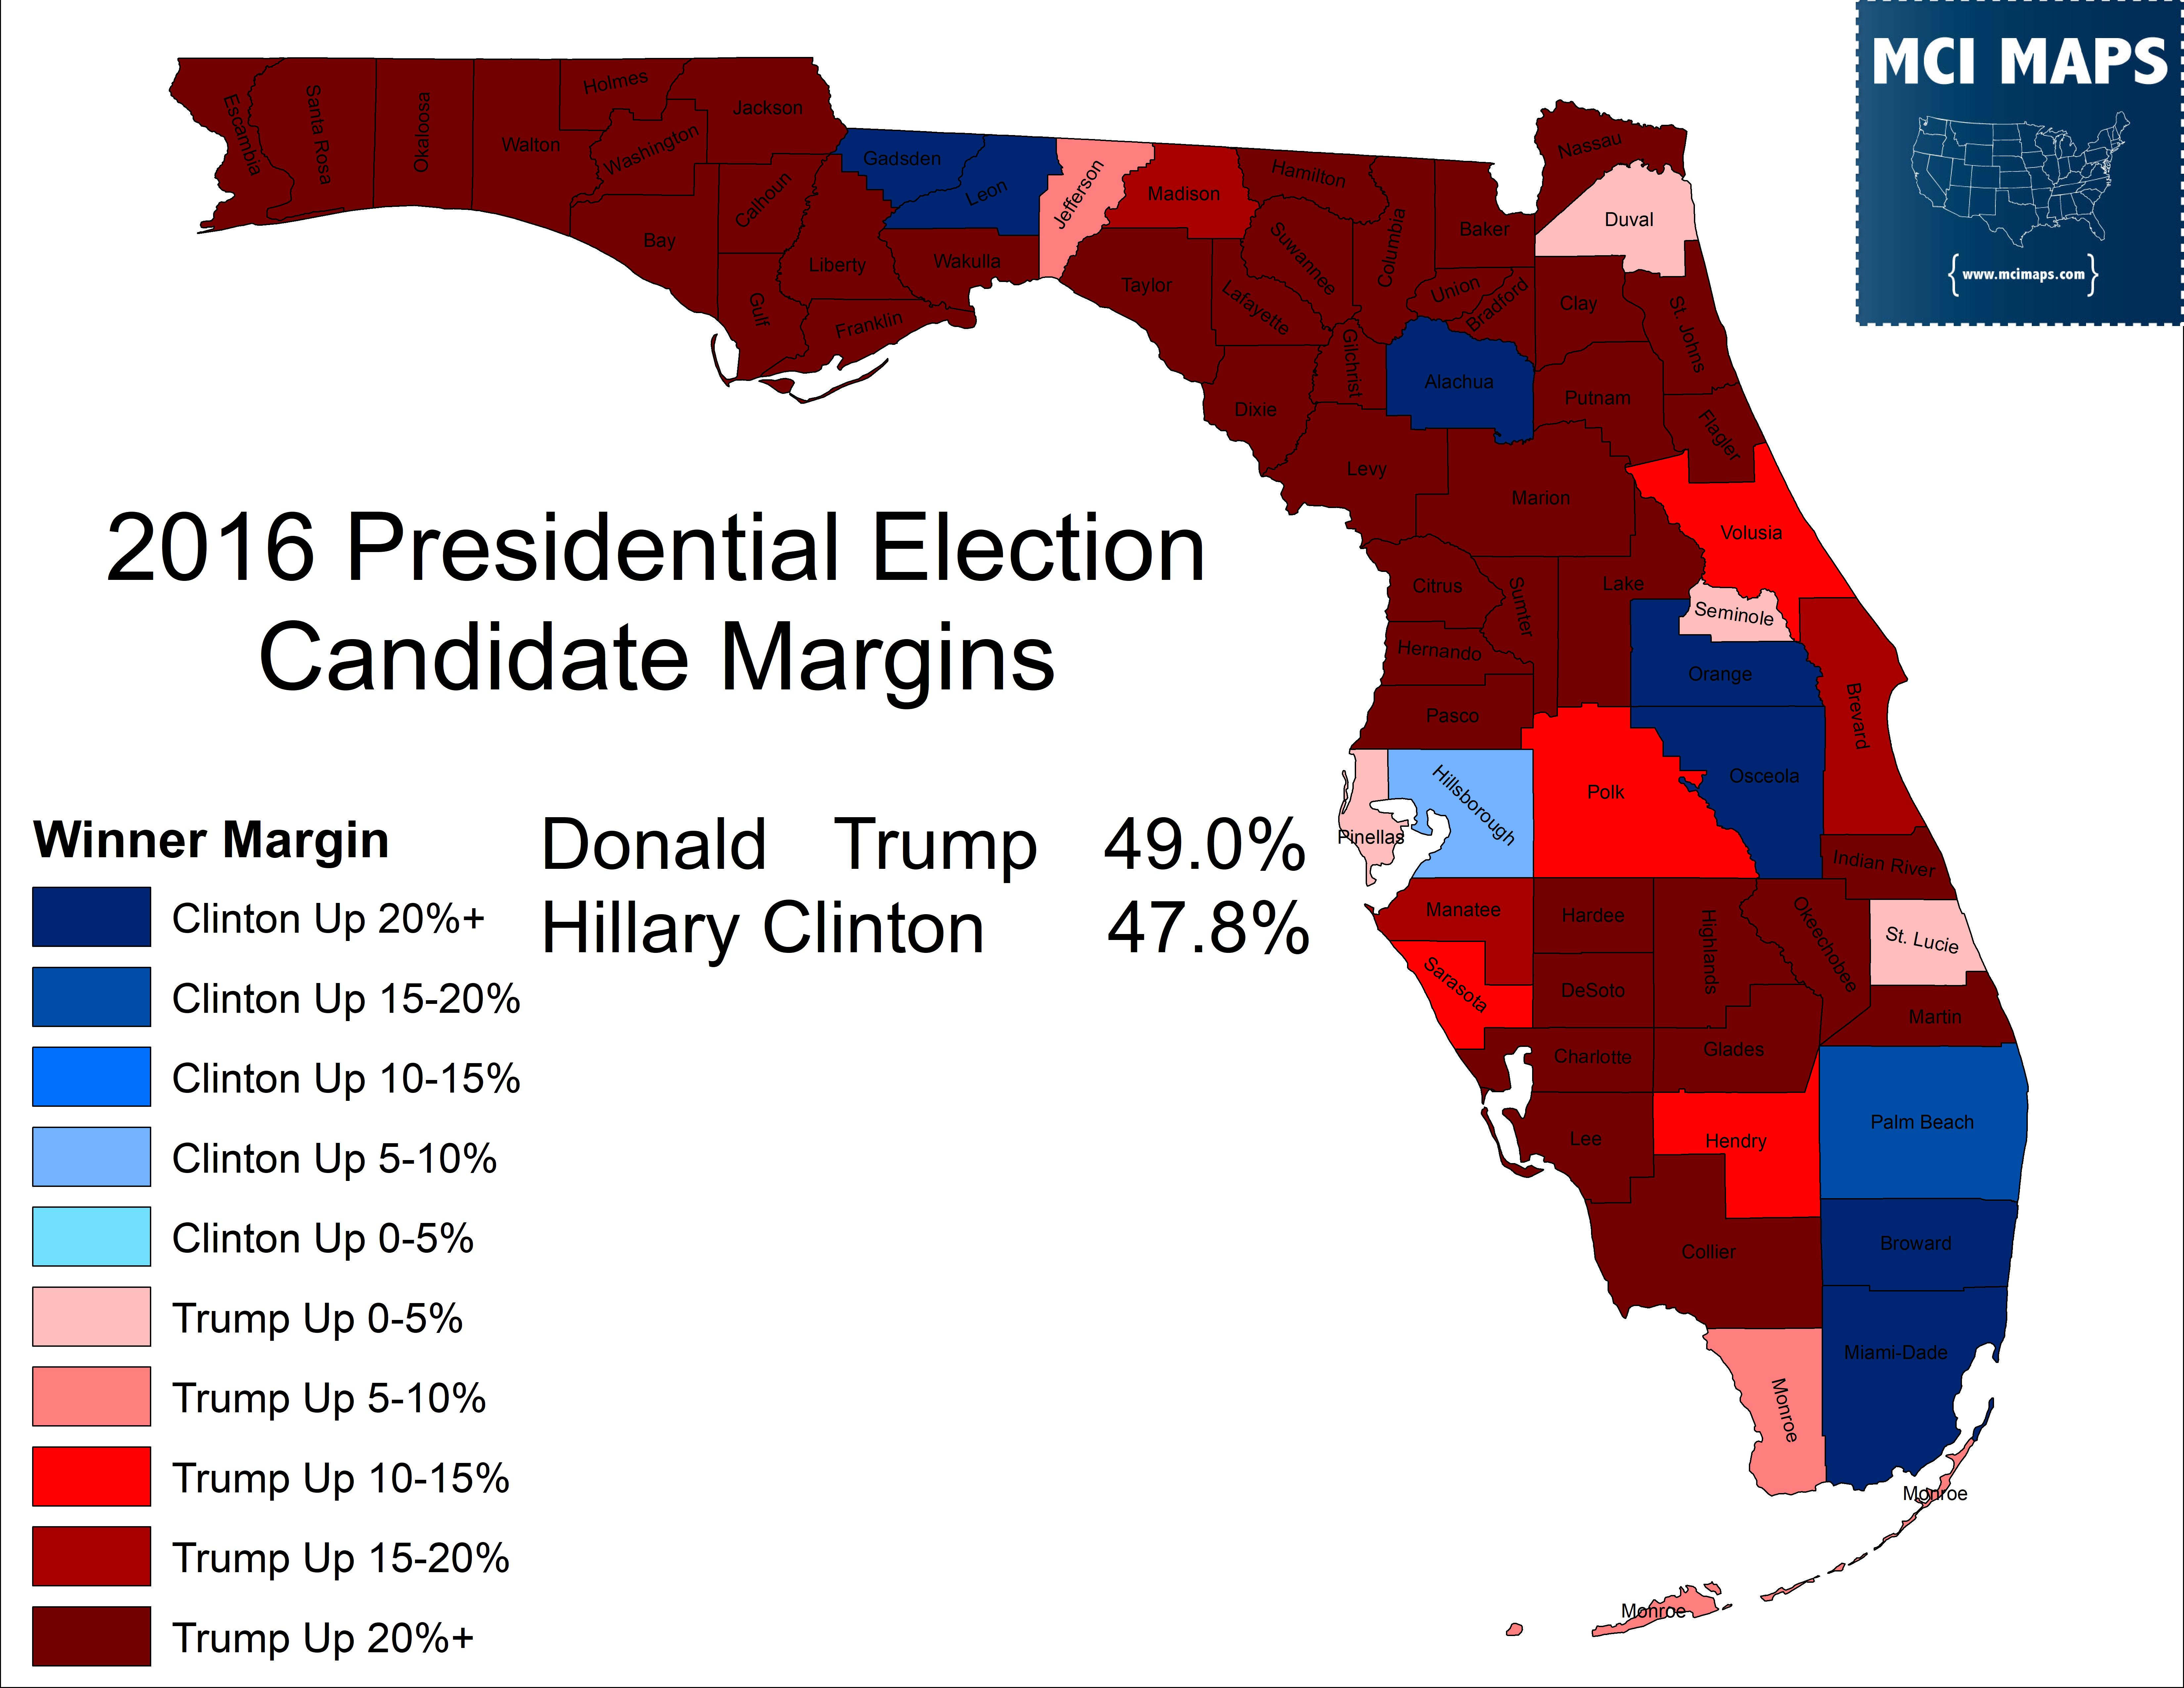
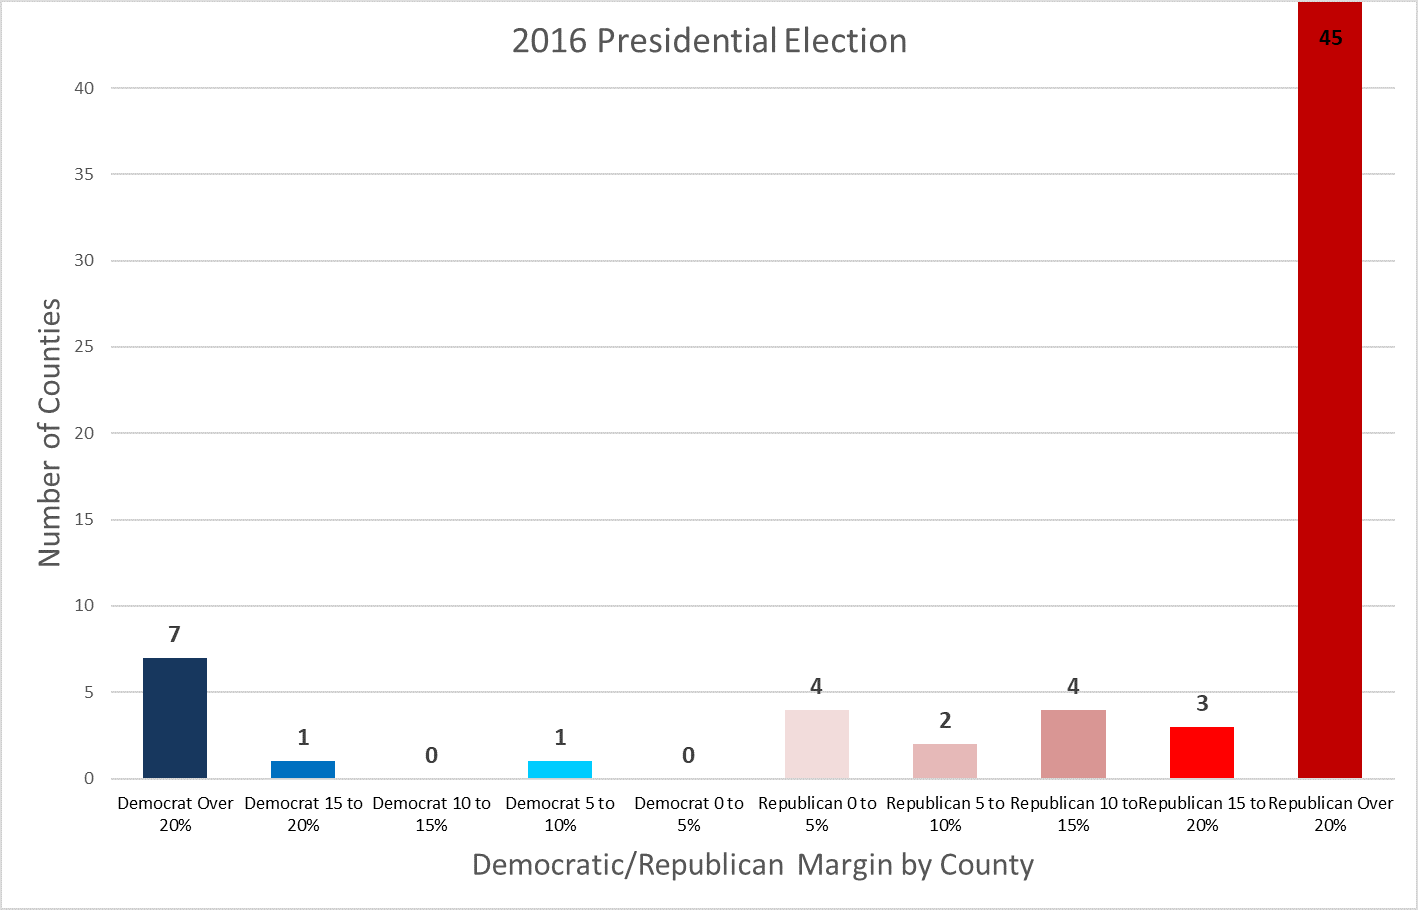
Trump moved modest Democratic working-class counties like Pinellas and St Lucie to his column; while modest-GOP working-class counties like Hernando and Pasco swung into the 20%+ GOP camp. The massive GOP swings in several small/medium counties were somewhat blunted by Clinton’s improvements in the large population centers; but not enough to prevent Trump taking the state.
Overall Trends
Overall, the number of swing counties has radically diminished despite most races remaining very close statewide.
Looking at just the bar graphs shift from election to election, we see a massive growth in the heavily GOP counties. Counties once modestly Republican have become entrenched for the party. Meanwhile, few counties have actually moved to the Democratic column. For Democrats, the key to success has been that the counties showing the largest shift in Democratic support have also been the largest counties. In addition, the counties with the biggest Republican shift have been the least population.
The scatter-plot below shows how the margin has changed from 1992-2016 compared to the total votes cast in the 2016 Presidential election. The counties which saw the Democratic margin improve (regardless of who won it) are in the blue end, while the counties who’s margin grew more GOP are in the red.
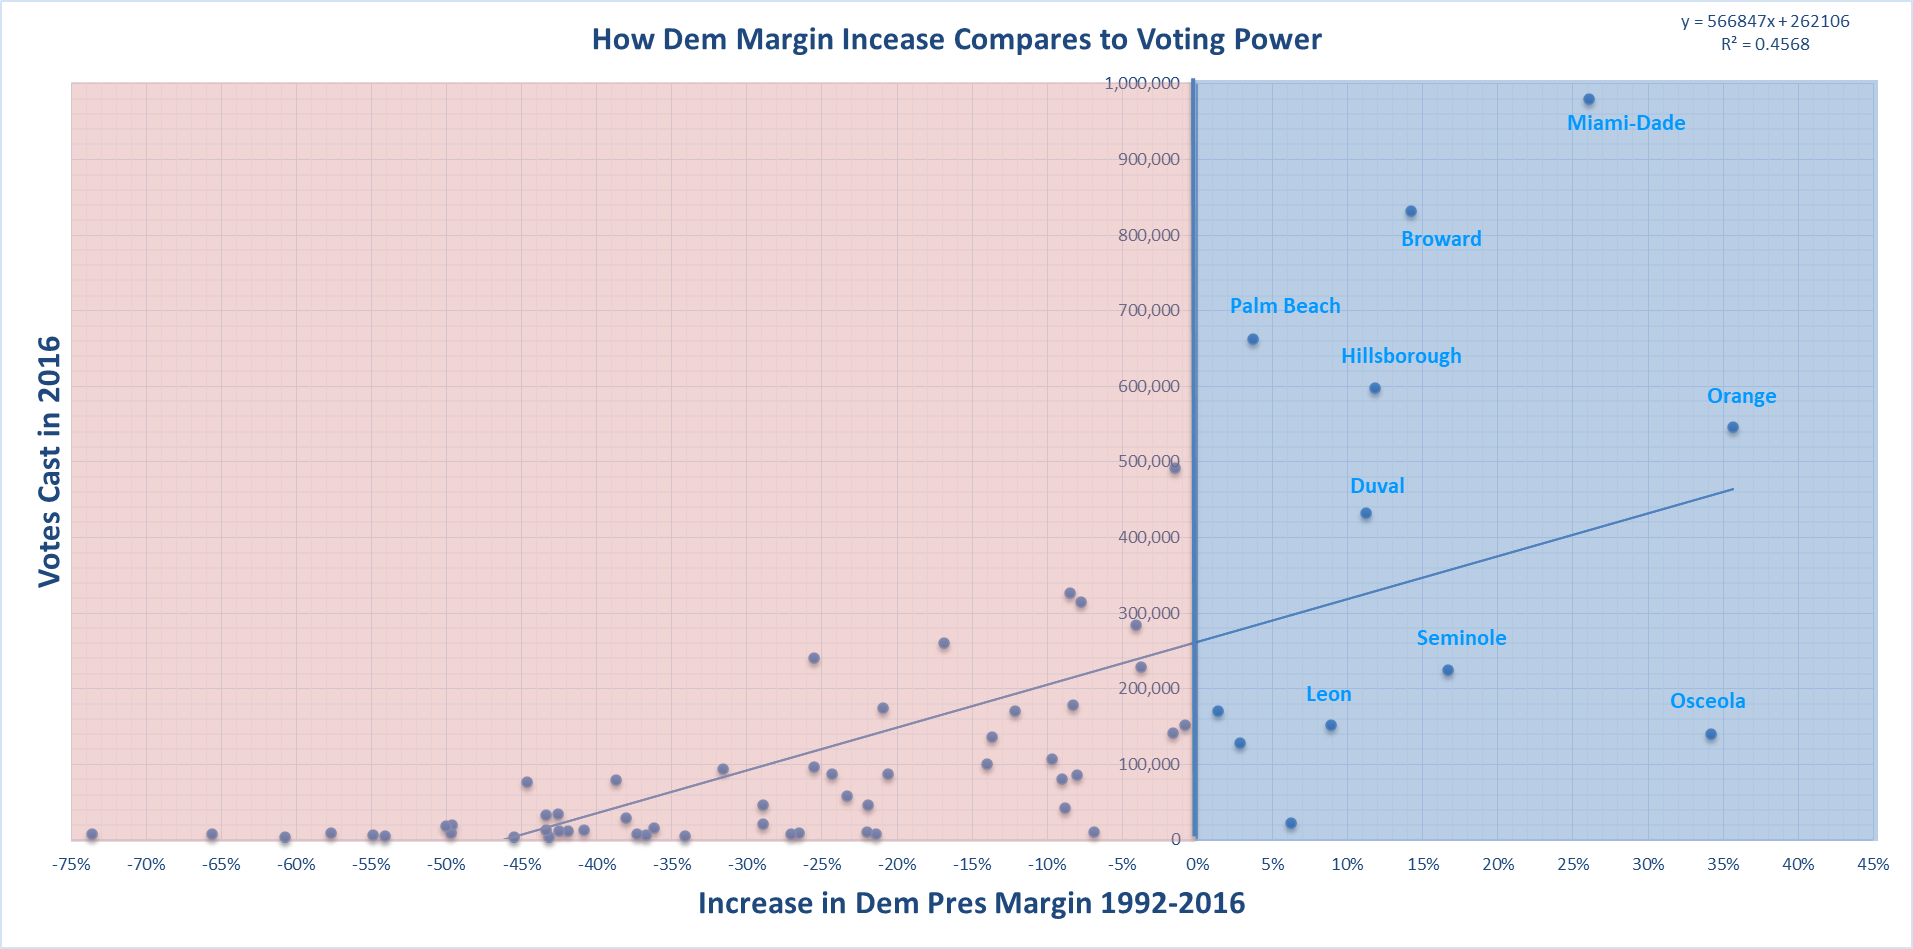
All counties that cast more than 400,000 votes in the Presidential election has seen an increase in the Democratic margin, save for Pinellas. Miami-Dade, the largest county, has seen a 25% improvement for the Democratic margin. Many other heavily populated counties have seen major growth in the Democratic margins. Meanwhile, the counties with the biggest growth in the GOP margin all fell well under the 100,000 votes mark, many casting less than 10,000 ballots.
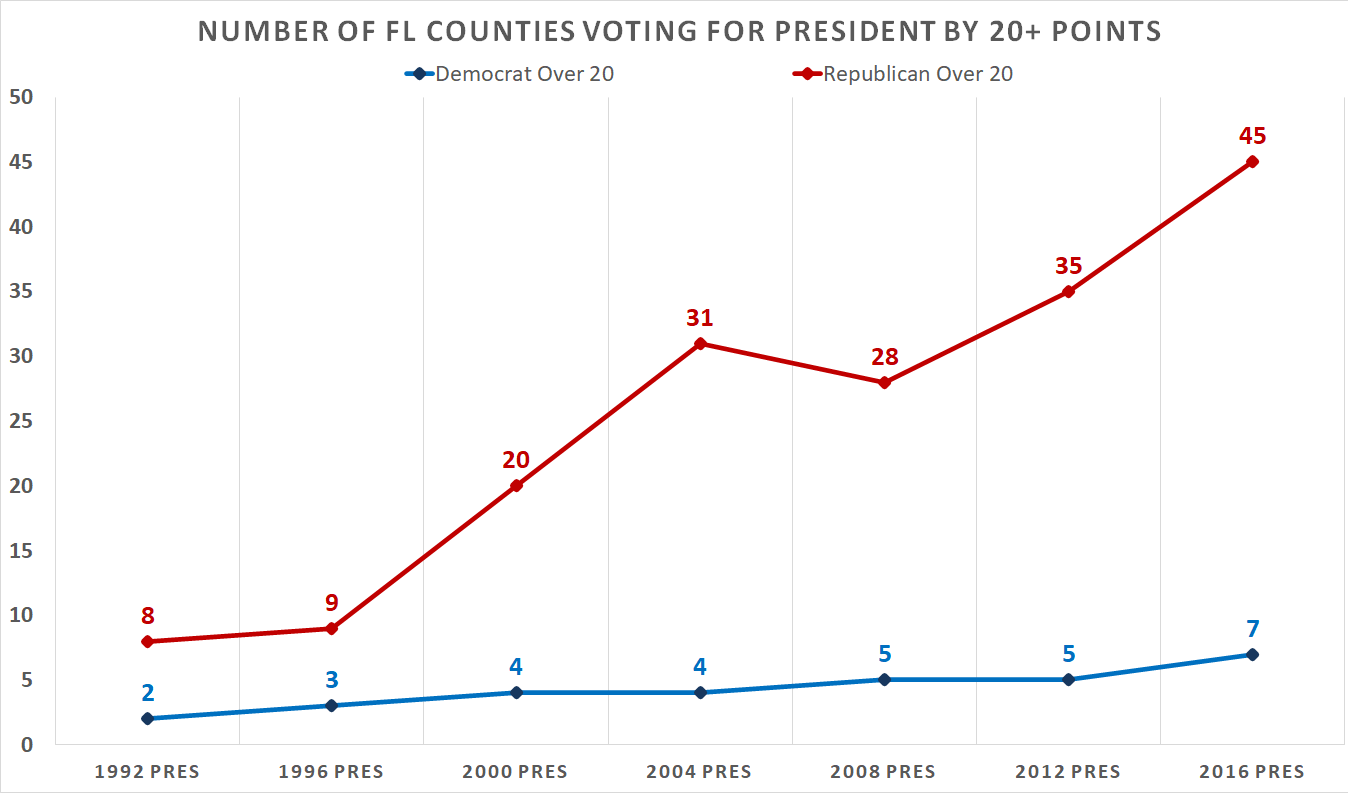
Florida has seen a huge rise in the number of counties voting GOP by over 20 points. However, their shifts are easily balanced by the handful of large counties that moved into the 20+ Democratic column.
Why the Big Counties got so Blue
Why have these big counties grown more Democratic? Three key factors are in play. 1) Increases of minority voters has been especially notable in the large counties. 2) Urban whites maintaining Democratic support 3) Democratic campaigns have set up major campaign operations in these counties.
Southeast Florida is the home of liberal whites. Jewish retirees are a staple of the liberal white vote of Broward and Palm Beach. Meanwhile, the white suburbanites in other counties have trended more Republican but began to shift more to the Democrats in 2016 (and in the 2018 midterm). White voters in places like Duval and Seminole are currently in a state of flux. The issue of white voter shifts in Florida are tremendously complex and unique to each county (factoring in education, income, state of birth), but these points are some good generalizations.
The urban counties have seen major increases in the share of registered voters that belong to a minority group. The scatterplot below shows how the non-white share of registered voters has increased compared to the total number registered. The plot shows that while most counties have seen an increase, the largest counties have seen a higher-than-average growth in non-white registration. Pre-2006, the state did not offer Hispanic as an option, leaving residents to chose white or other, making that data less consistent, so I opted to start there.

For Obama to win Florida in 2012, minority voters were crucial. While Obama won 42% of white voters in Florida in 2008, he only got 37% in 2012. When Clinton lost to Trump, she did so with only 32% of white voters. Hispanics grew in support for Democrats in each election; giving Obama 57% in 08, then 60% in 2012, then Clinton 62% in 2016. White share of the electorate is also falling consistently and its biggest in the urban counties. Democratic growth in the white suburbs could also be a factor down the line in these trends; though we need more elections to get a clear picture. 2020 should be very revealing.
Why the Rural Counties got so Red
The issue in the rural counties is a factor of national trends. Florida’s rural counties, most located in the North, are cultural similar to the American South; which has seen an increasing right-wing shift in recent decades. Bill Clinton was the last Democrat to play in much of the South. Clinton’s strong southern backing was reflected in his wins and narrow losses in several rural counties. However, since Gore, the Democratic situation in the rural counties has only gotten worse as once ancestral-Democratic counties began tovote more GOP. While Democrats used to maintain local control in these counties, that control is slipping as well. In the rural counties near Lake Okeechobee, the Democratic platform on environmental issues has no doubt hurt the party in an area dominated by agriculture at the expense of the Everglades. Hendry County is dominated by Agriculture but is notably less Republican than its neighbors. Why is that? The answer is that Hendry also has a larger non-white share of the vote than its neighbors. Hendry’s white share of registration is 56%, well below the 70%-85% range its neighbors hold. Racial dynamics is the one major factor that keeps rural counties like Madison, Jefferson, and Hendry from slipping heavily into the GOP camp.
Conclusions
These shifts in county support come from changes in voter allegiances, but also from changes in the electoral makeup of the state of Florida. As urban counties grow more racially diverse and white liberals flock to urban centers, the big counties of Florida will continue to be steadfastly Democratic, offsetting loses in rural counties. Only a few countries truly swing in Florida elections anymore at the Presidential level. For both parties, the pathway to victory doesn’t lie so much in winning or losing which counties, but rather the margins they win or lose them by.