Three months ago, I wrote about Jefferson County, FL and its county commission/school board maps. The commission map had become subject of a lawsuit over whether using the population of a prison towards the commission lines was gerrymandering.
I advise you to read about the past issues with the Jefferson Commission and the use of prison populations in local jurisdictions here. In addition to the issue surrounding the use of a prison’s population, I argued that the commission districts disenfranchised African-Americans by only having one likely African-American seat out of five available. I argued that another district had the potential to elect African-Americans, but was adversely affected by turnout fluctuations.
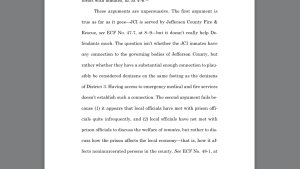
A federal judge ruled on the Jefferson map and found for the plaintiffs that sued the county, finding that the use of the prison was an unconstitutional gerrymander. The decision was narrow and specific to Jefferson, and, potentially, counties with similar issues. The court found that since the prison was such a large part of the county’s population of the district (over 30% if the population), the population deviation was far too large. In addition, the court ruled that since the prison was a state-run prison and the county and school board had no say over the conditions/policies of the prison, there was a disconnect between the prisoners inside and the local elected officials. Excerpts of this argument can be seen here. You can click the images to enlarge.
In essence, the court gave credence to the notion of prison populations being counted as part of congressional or legislative lines because state/federal lawmakers can exercise some authority and influence with prisons. In addition, prisoners can write their lawmakers about issues or concerns they have. The court found that prisoners can be considered constituents of high-level lawmakers, but not constituents of the Jefferson School Board or County Commission because those local boards have no say or influence with the prison that operates in their borders.
The court, however, did not address the racial disparity issues as much, and when a new map was submitted by the county, the court found the racial concerns raised to not be compelling enough to warrant another redraw and that the minority population of District Three was large enough, 40%, to give African-Americans a chance to win the seat. I argue the new map is far too similar to the old when it comes to racial makeup and that the parties involved looked too closely at population versus voting performance.
The New Lines
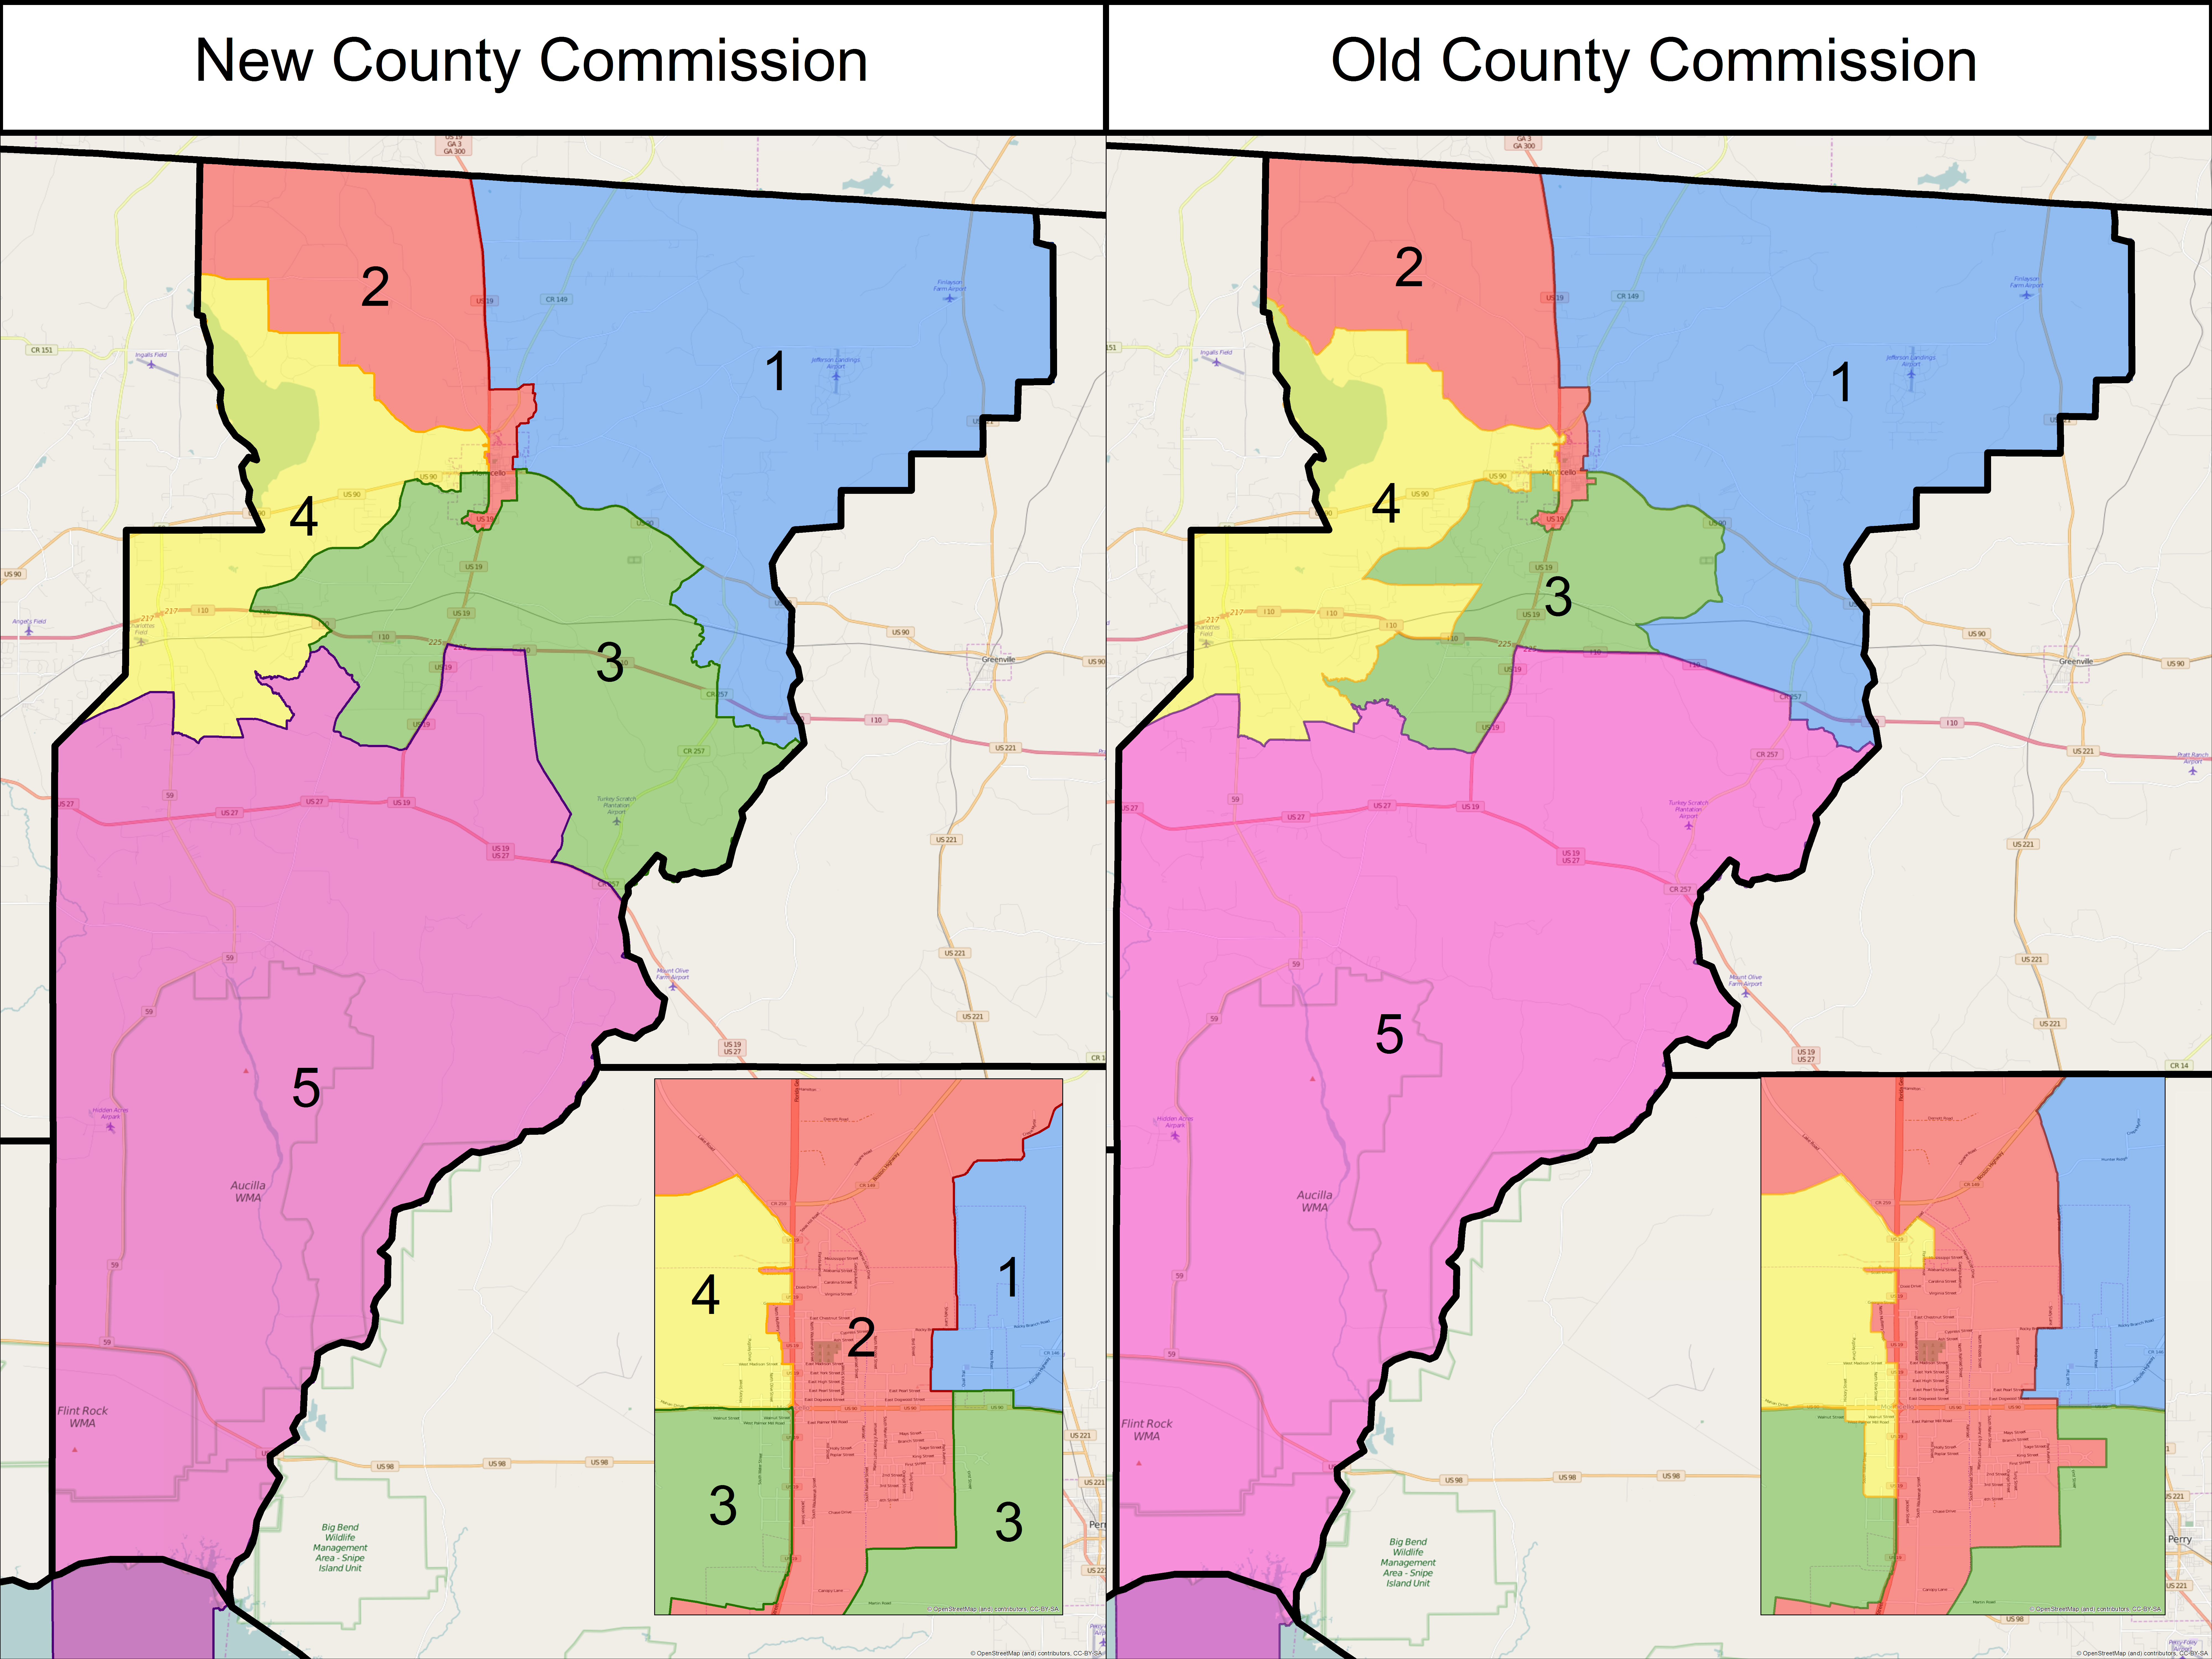
With the order to redraw the district lines while not accounting for the population of the prison, the main issue was that District Three was dramatically underpopulated. The commission’s consultants clearly took pains to draw new lines while at the same time maintaining the same general spirit of the old districts.
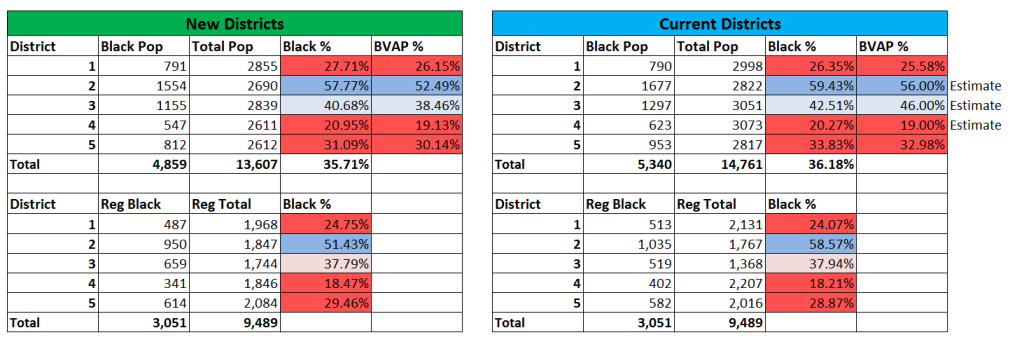
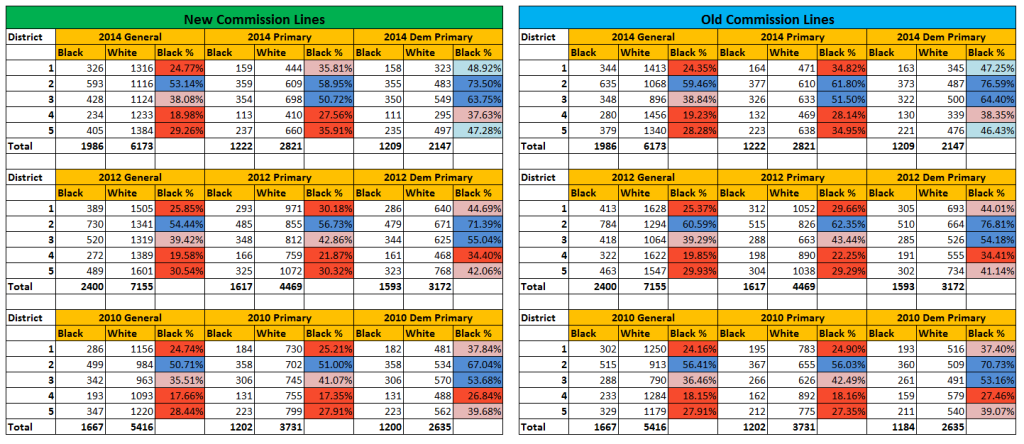
The chart below shows the raw population data and registration data for the old (current) and newly proposed districts. Overall, the racial makeup of the districts remains largely the same.
The third district had a solid African-American minority population, but it is virtually unchanged from the old lines. District Three becomes less African-American in terms of overall population, but that is because the prison was removed. The overall registration data for District Three did not change much. However, District Two saw its African-American share of registration fall thanks to ceding some African-Americans and taking in more whites. The shift in District Two is troubling, since taking in more whites was not needed to keep its population in the proper range, but overall District Two will remain an African-American seat. The problem is District Three showing no electoral improvement for African-Americans from the old lines.
When looking at the electoral results, we see little change in the dynamics again. District Two remains an African-American seat in performance while District Three is favorable to African-Americans in the August primaries, but less so in the general elections. In a non-partisan August primary, the third district was 50% African-American in 2014, but it fell to 38% in November as more whites turned out. While the Democratic primaries are more solidly African-American, I wrote in my initial article that local white Democrats can and have opted to run as NPA candidates to avoid the primary and run in the general elections, which are more white. In addition, the African-American share of the August primary in District Three only topped 50% in 2014, and could easily fall this year if turnout fluctuates again.
My initial analysis delved more into registration shifts and racial dynamics in Jefferson, so I again urge you to refresh yourself on that here. The old lines had clear issues with providing a second district with a good chance of electing an African-American, and the new lines have a near identical result. The difference in District Three between the old and new lines is less than 1%.
There is a clear way to change these lines to better meet a goal of giving African-Americans a second shot at a county commission seat. The commission could have shifted the lines many different ways. The problems with the new lines for District Three is that they took in whiter regions and negated to take in African-American census blocks further south.
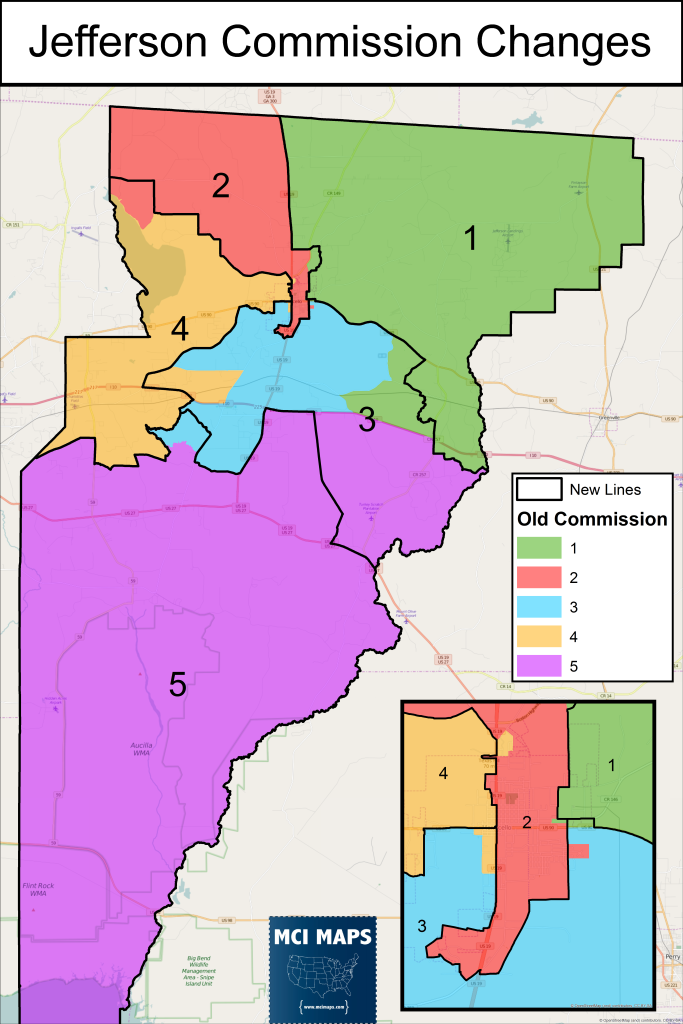
This map shows the old districts color-coded, with the new lines overlaid. You can see District Three took in some portions of all the districts, notably 5, 4, and 1.
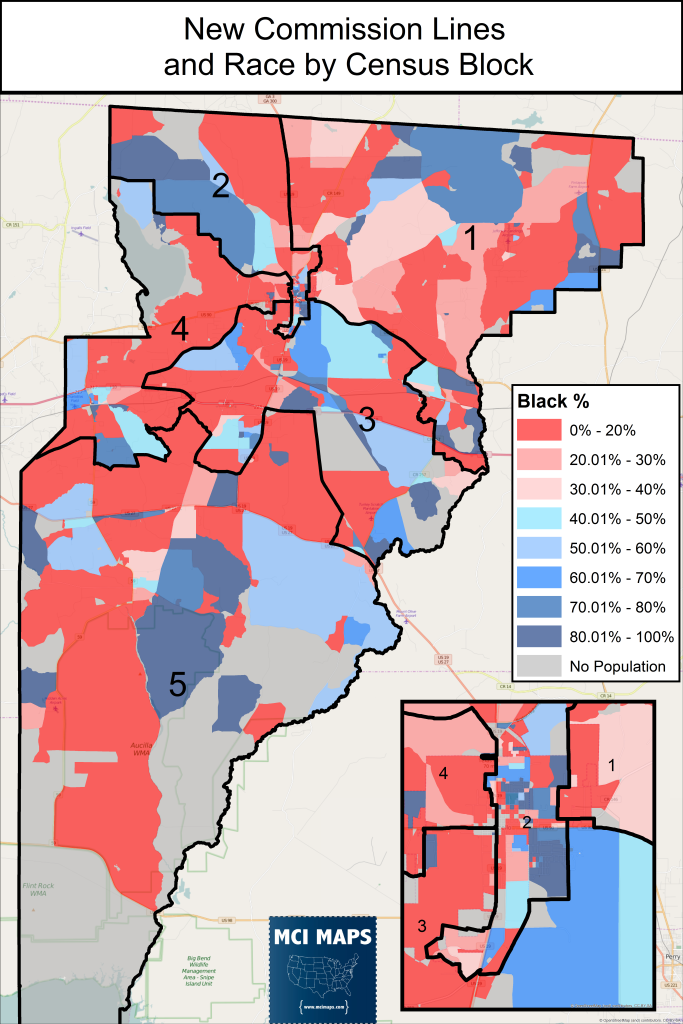
Now, look at that map compared to the racial makeup of the census blocks of Jefferson County (with the new lines overlaid).
The regions taken in from District 4 and 1 were heavily white, while heavily African-American regions deeper in District 5 were over-looked. A few African-American blocks were added in from Districts 5 and 1, resulting in a district with a near identical racial makeup as the old one, just with more actual eligible voters.
The new district lines remove the serious issue of prison gerrymandering in Jefferson. However, further improvements are needed to the commission lines to better reflect the racial makeup of Jefferson.

