Jefferson County, Florida, a small Democratic-leaning county just to the east of Tallahassee, is currently being sued by the ACLU over its 5 single-member commission districts, which are used for both County Commission and School Board elections. The suing parties say that the districts use prison gerrymandering to inflate the minority population of one district specifically, District 3. The issue stems from Jefferson County Correctional Institution, a jail with over 1,100 inmates. Prison populations are counted by the census for the location they are incarcerated in, not where they initially lived. The issue of counting prisoners is not new and is currently the subject of a lawsuit by Congresswoman Corrine Brown, who argues the new 5th congressional district’s black population is being inflated by prisons in the district. Brown’s lawsuit has no standing, as prisons make up 1-2% of the districts population and the district’s registration and turnout still make it an African-American seat. However, in the case of Jefferson County, the prison in question has a dramatic impact on the county.
The Problem with Jefferson District 3
Jefferson is not a large county, with just over 14,000 people according to the 2010 census. In addition, the use of single-member districts means each district has just under 3,000 people. Jefferson’s enacted map puts the 1,157 inmates of the prison into district 3, meaning the prison population makes up 37.7% of the districts total population and 43.2% of its voting age population. In addition, the inclusion of the prison, which is 48% black and 7% Hispanic, inflates the non-white population of district 3. The commission map is below.
Getting exact population stats proved to be a little more difficult than it reasonably should be. Digging through documents, I found the total census population figures for Plan A, the plan created by a firm hired by the county that was eventually enacted. The 2nd district is a likely black seat, while the 3rd is 42.5% black, 5.4% Hispanic, and 3.3% other, creating a district just over 50% non-white. The voting-age population figures have been a little harder to lock down (the suing parties say the 3rd is over 47% black voting age population). I worked to re-create the districts in redistricting software. However, 2 census blocks are split by districts 2, 3, and 4, making exact voting age population figures tougher to come by. The chart below shows these figures for African-Americans, which along with whites dominate in Jefferson County.
The registration figures tell the story of the prisons effects. While black registration is only 2 points less than the voting age population in District 2, its 8 points lower in district 3. District 3 also boasts the lowest total registration, and African-Americans are only 38% of the district’s voters.
Jefferson County’s voting age population is 34.6% African-American and 61.3% white. However, under this plan, 80% of the commission districts favor white candidates and only 20% favor African-Americans.
Solutions to the Problem
This deviation is despite the fact that the districts could be redrawn to make a second African-American seat much more likely. The easiest way to do this does means not including the prison in the population of the county. Several small counties already do not count prisoners for their redistricting due to the severe effects they can have. Columbia, Holmes, Madison, Hamilton, Bradford, Franklin, Lafayette, Okeechobee, and Gulf do not count prisoners. Gulf County hasn’t been doing it since 2000, when the then-Florida Attorney General said they should, and they ignored the decision. But in Jefferson the issue isn’t just the counting of the prison, it is the lack of a reasonable effort to create two African-American districts in the county. In the current plan, District 5 still has a sizable African-American population that could be redirected. The map below shows the current districts layered over Jefferson’s census blocks color-coded by African-American population.
The 3rd district takes in many heavily white areas and misses African-American pockets to its South and East. In addition, the prison included is right on the edge of it and District 1.
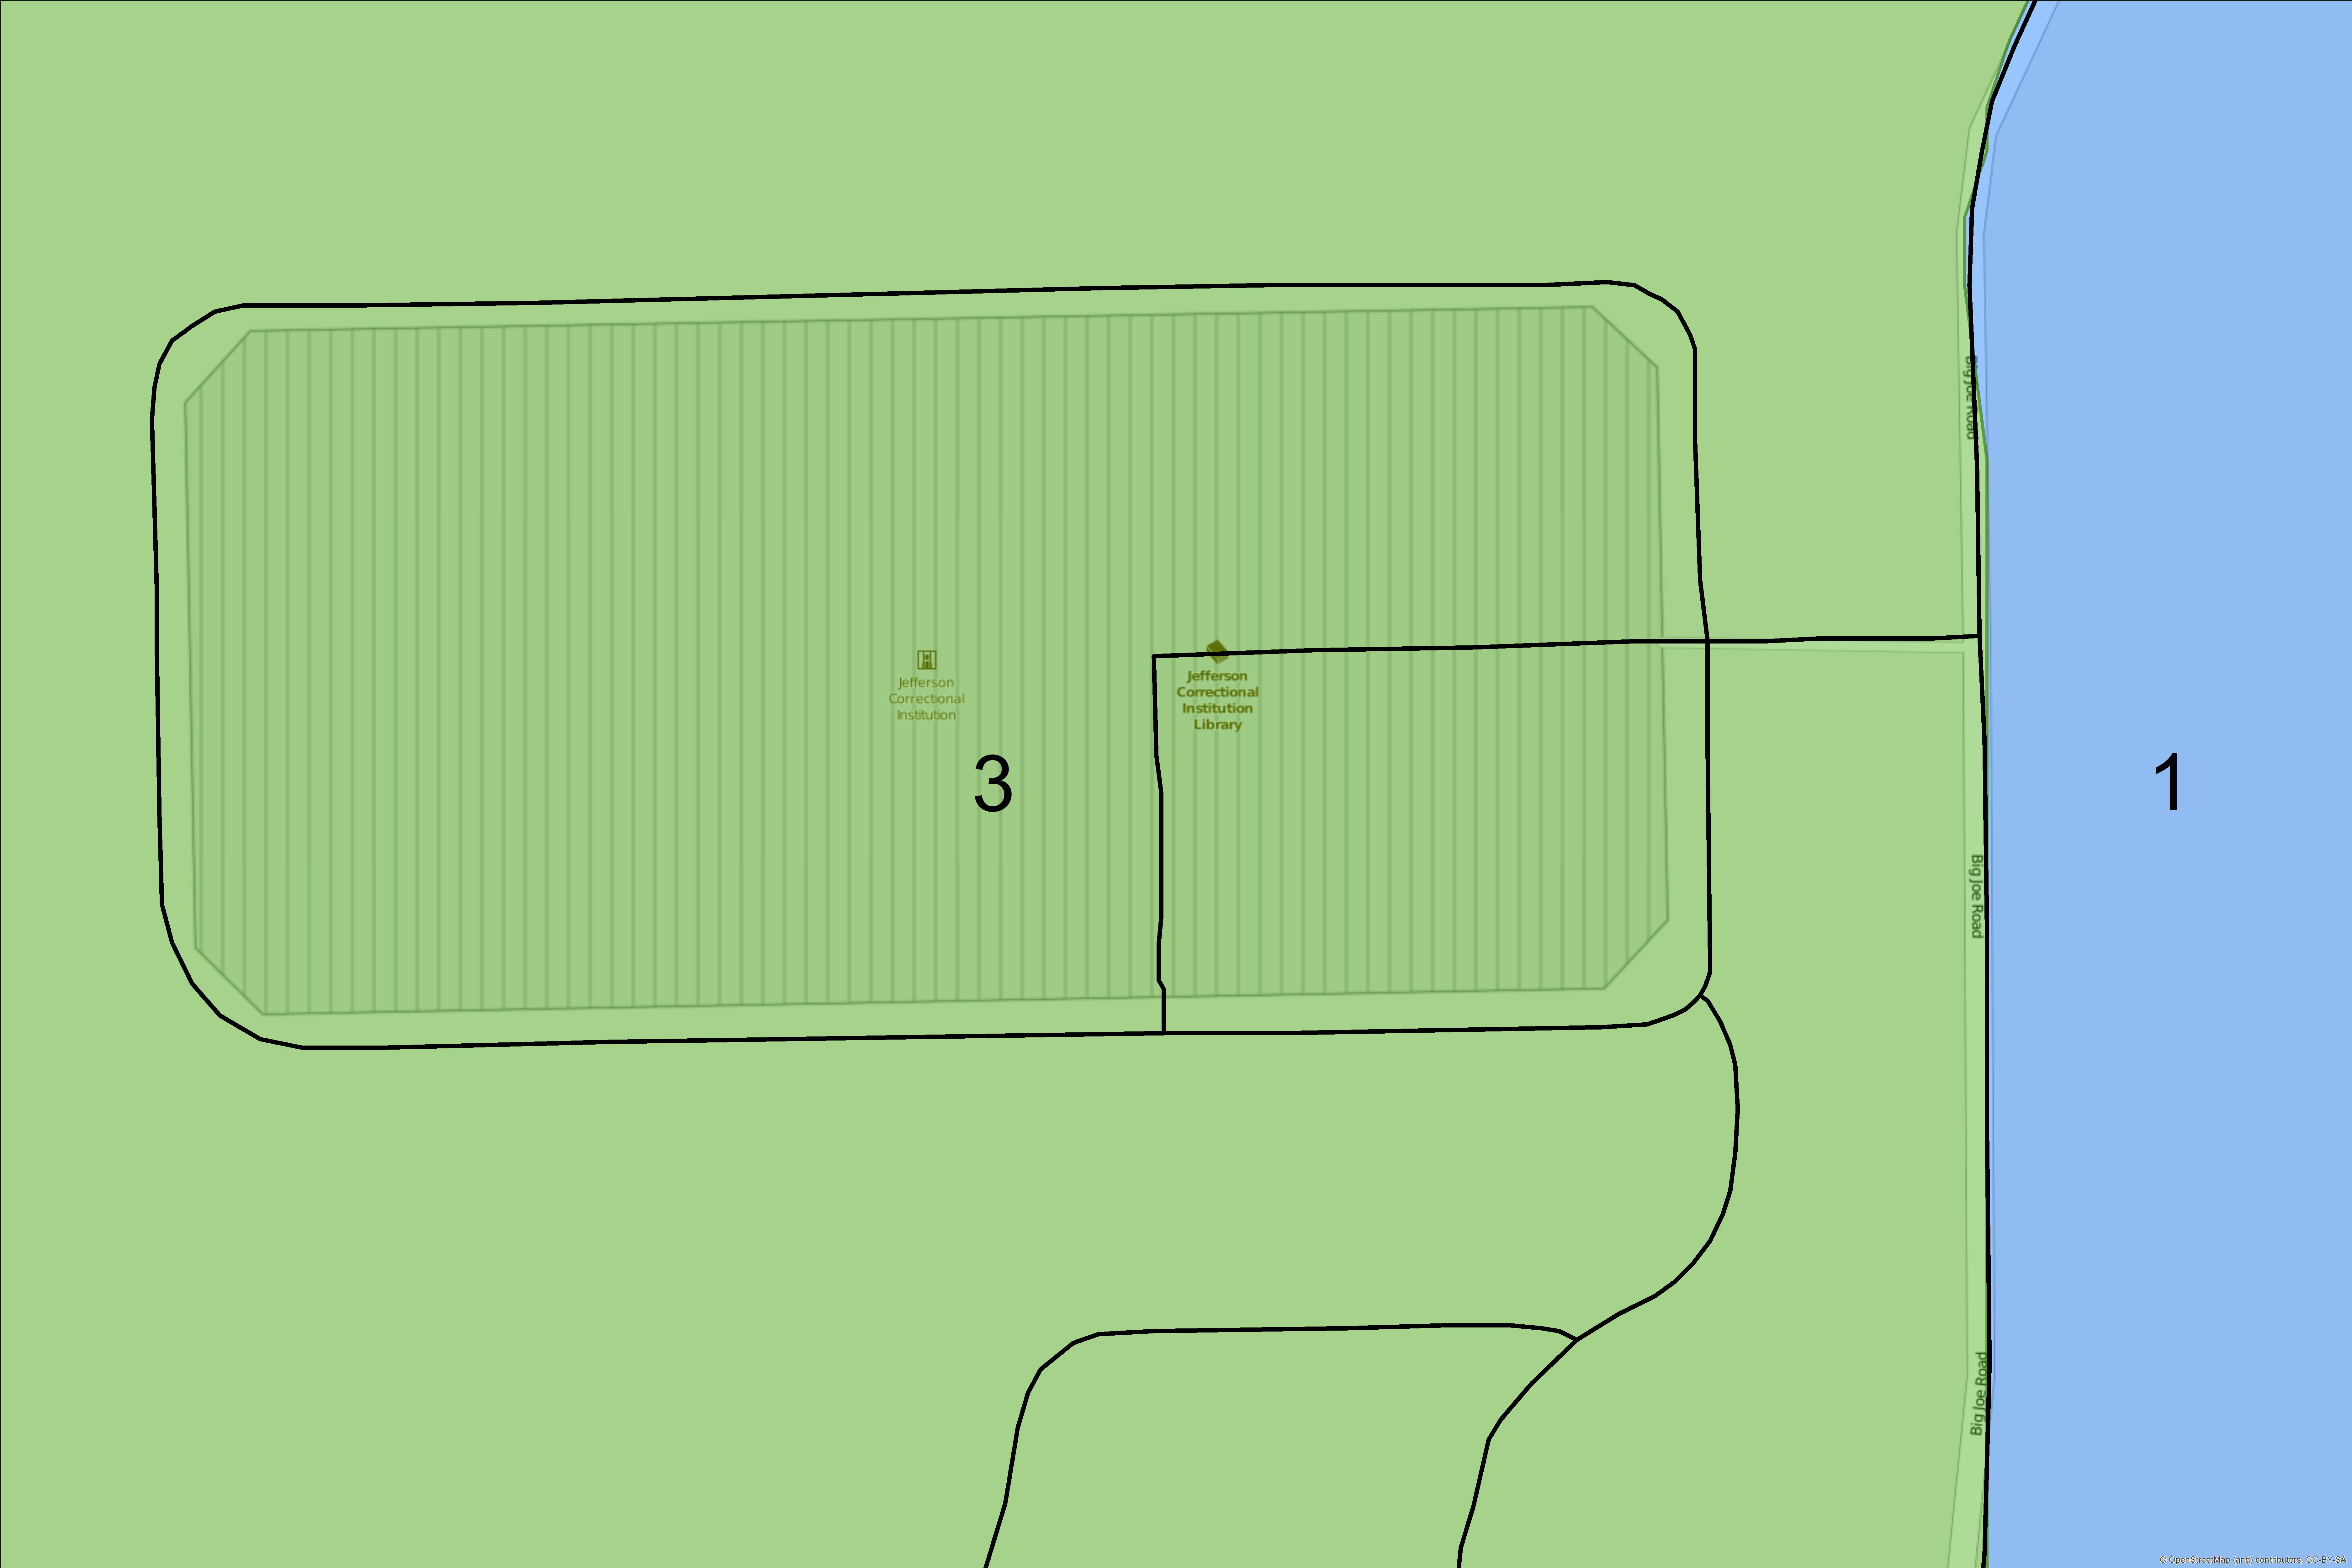
If it was insisted the prison be counted, it could at least be moved into the 1st, allowing the 3rd more room to take in African-American areas.
Since it is easy to only criticize, I wanted to offer my own proposal for a commission map. I did so trying to balance African-American voting age population with registration and turnout figures. My proposal is below.

In my proposal, Districts 1 and 2 are likely to elect African-American candidates. My District 2 is similar to the current African-American district, but I split the black community of Monticello more between my two black districts. I then also consolidated black populations in the east and south ends of the county. The districts were designed with compactness in mind as well, following major roadways when possible. The census and registration figures of my proposal compared to the current map can be seen below.
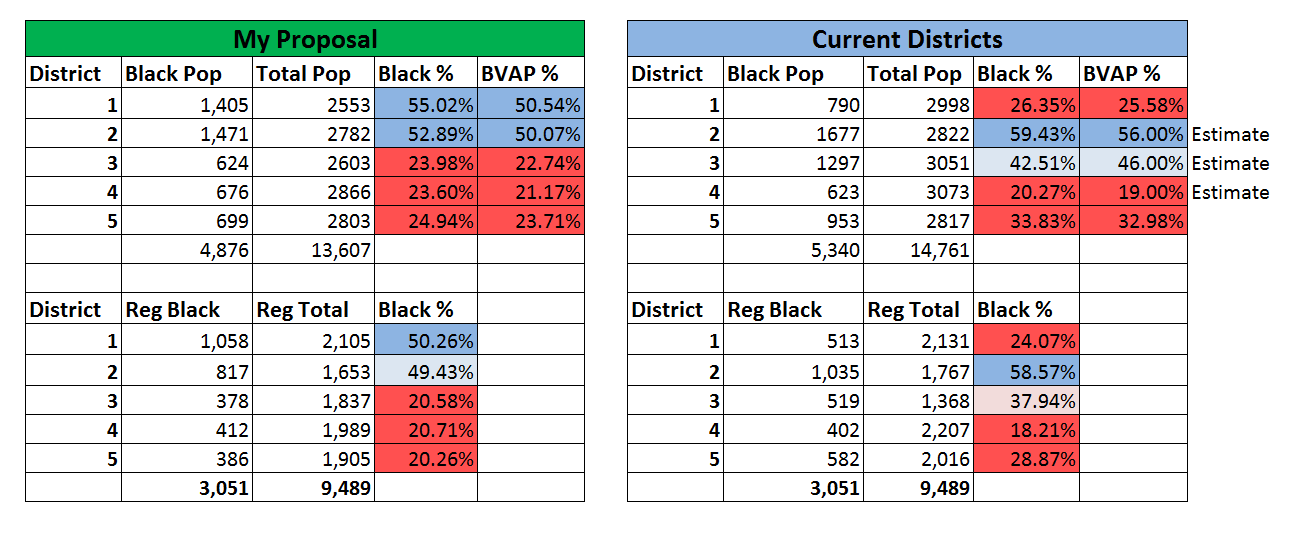
In my proposal, the 1st and 2nd are nearly equal in African-American population while the remaining districts have been bleached white. The 2nd is just under 50% black in registration, though the white share is only 48.2%, with Hispanics largely making up the gap.

Elections in Jefferson
Jefferson elects its school board members and county commissioners by different methods, something I took into account when drawing new districts. County Commission races start off with partisan primaries in August and party nominees and NPA candidates face off in November. School board members all run on an open non-partisan ballot in August with a runoff in November if needed. While Jefferson can be close in presidential years and has backed Republicans in certain elections, the Democratic party dominates in registration and local races. Under the current plan, the Democratic primaries for Districts 2 and 3 are majority African-American. The chart below shows the African-American share of the 2014, 2012, and 2010 Democratic primaries by district for my proposal and the current lines.
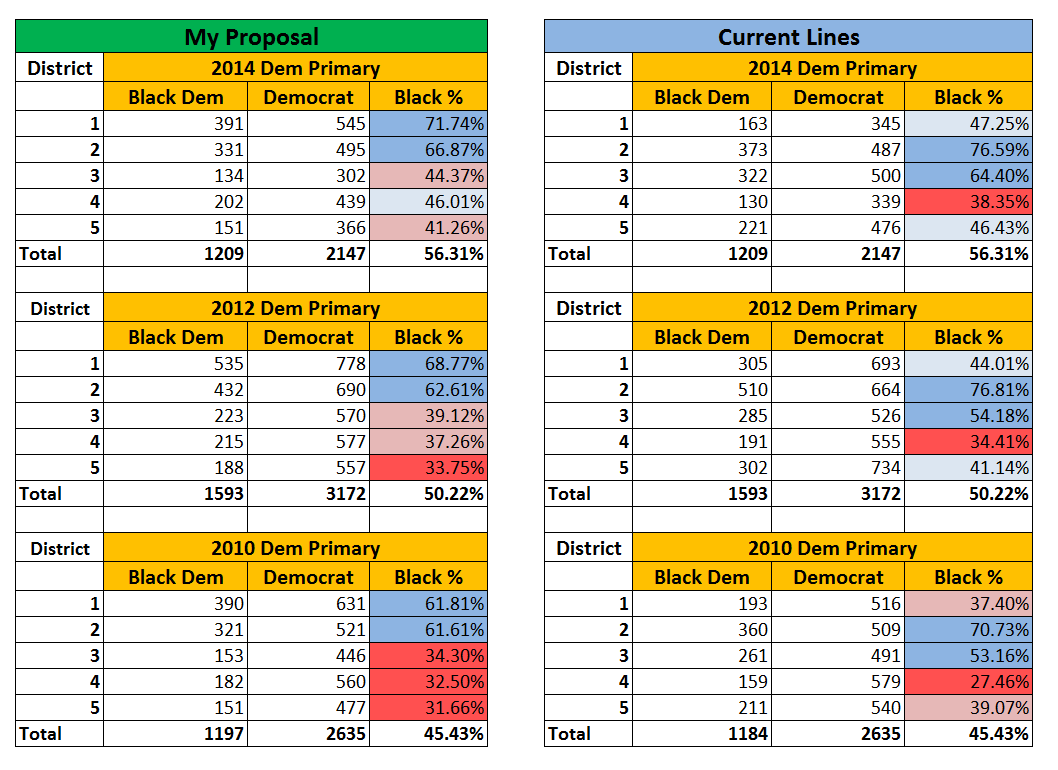
When you look at the more recent 2014 and 2012 numbers, you see a pattern. The Democratic primary is getting more African-American with time, resulting in more districts having near-majority African-American shares. In 2014, 4 of the 5 districts in the current plan were over 45% African-American.
So what is happening here? Well for one, the Democratic share of registration in Jefferson has been falling for over a decade. Meanwhile, the African-American population, while not rising as a share of the counties total registered voters, is rising as a share of Democratic registration.
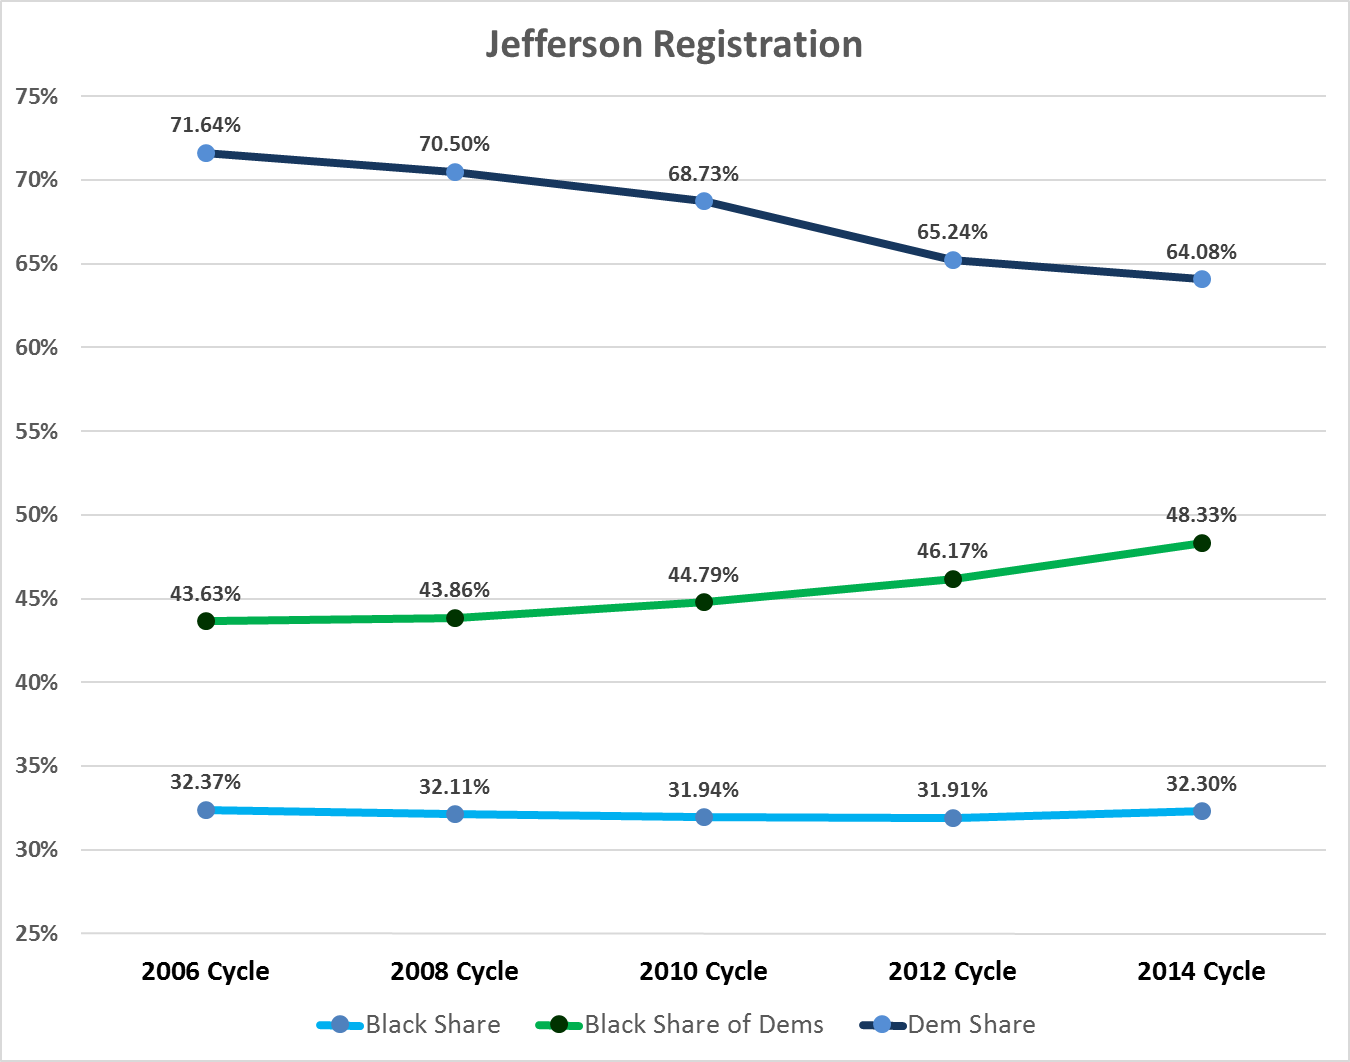
What is happening in Jefferson is similar to what is happening in many rural North Florida counties. Many counties in the region are seeing registration shifts that are catching up with the voting patterns of the region. North Florida is filled with counties heavily Democratic in registration, many with Democrats dominating local offices, but counties that vote heavily GOP at the top of the ballot. Jefferson is influenced by Tallahassee, with a decent share of state employees and a large African-American population, which have kept it as a lean Democratic county. However, as the older generation of ancestral Democrats passes away and younger, rural voters register, more are registered NPA or Republican than their grandparents. In addition, the county has seen its raw registration fall, with much of that being subscribed to Democrats.
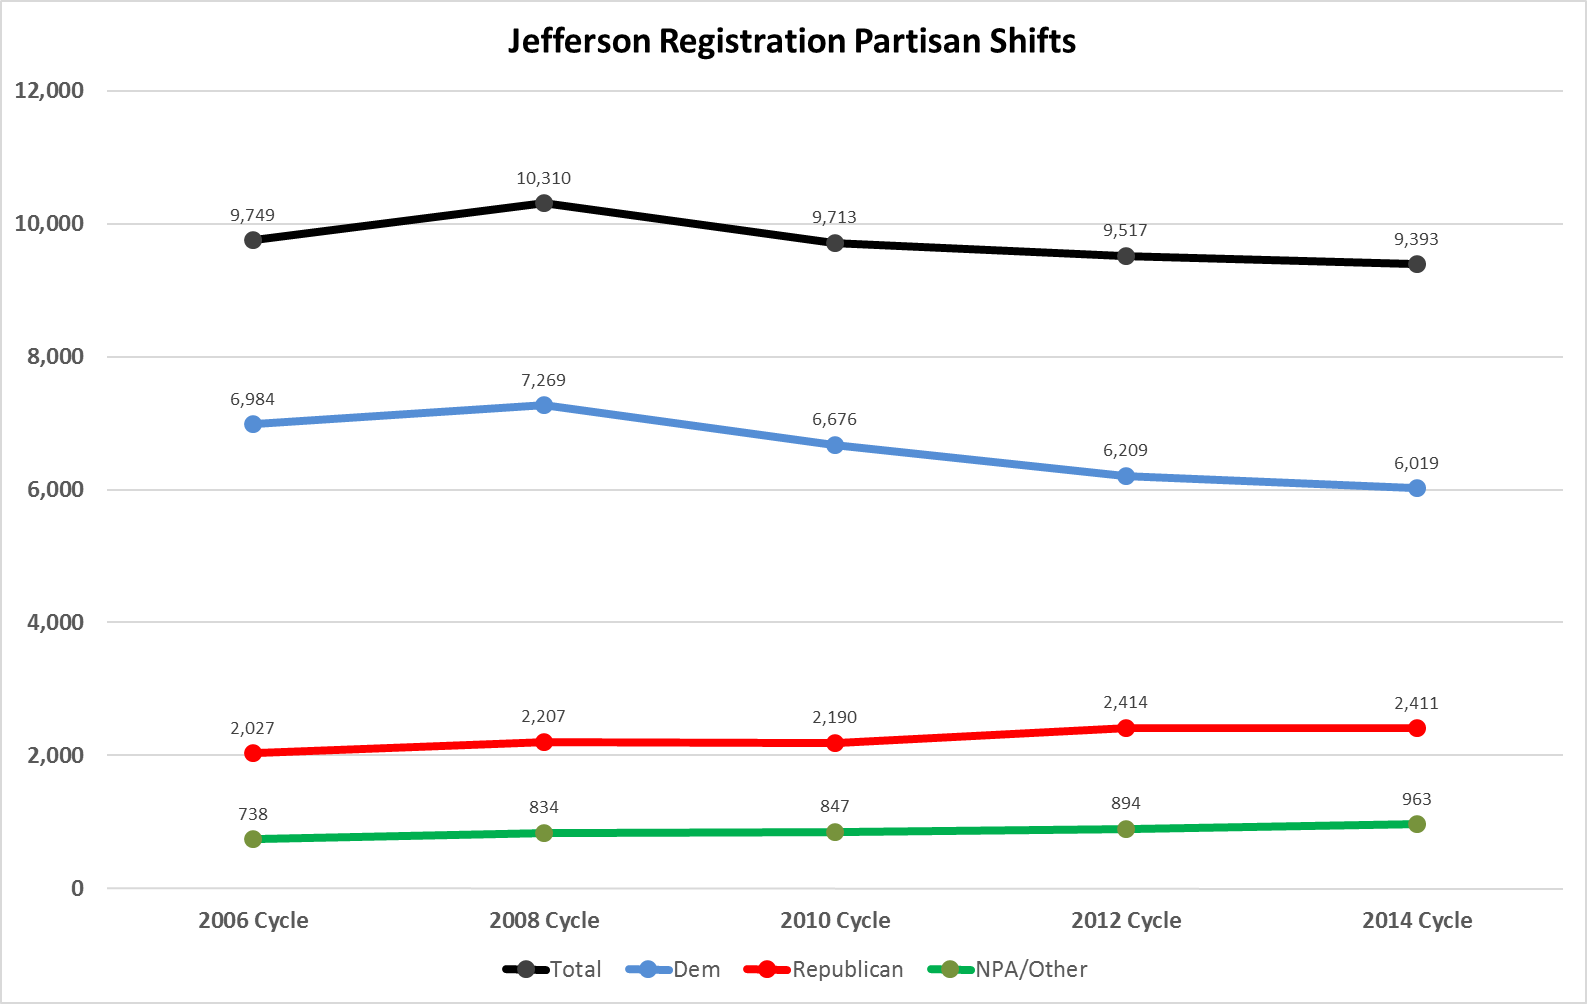
Since 2008, registration has fallen by about 1,000, with Democratic registration falling by 1,200. In that same time over, 200 new GOPers have been registered and 150 NPAs. These are small numbers, but in a small county, it can have a big effect.
So you may say, “Well, if the Democratic primaries are becoming more African-American, then aren’t the current lines fine?” The answer is no. The problem is school board races being elected on non-partisan ballots and the ability of candidates to bypass the Democratic primary in commission elections.
In District 3, the county commissioner is a white incumbent named Hines Boyd. Boyd is the lone NPA commissioner, who despite being a registered Democrat, did not run in the Democratic Primary in 2012 and instead won re-election as an NPA candidate in the general (under old lines at that time). Boyd has already filed as an NPA candidate for 2016.
Supporters of the current plan also cite that on the school board, there are indeed two African-Americans. Shirley Washington, an African-American woman, currently represents the 3rd district and has represented the region for over a decade. She was re-elected in 2014 with 52.4% of the vote against a white challenger that got 40% and an African-American that got 7%. Proponents of the plan will say Washington’s re-election shows the districts are fine. However, this ignores the fact that in the 2014 primary, 51% of the turnout in the district was African-American. Had Washington been dragged into a runoff in November, she would have had to run in a district where the turnout was 38% African-American.
The chart below shows my proposal and the current plan with African-American share of the primaries and generals for the last three election cycles.
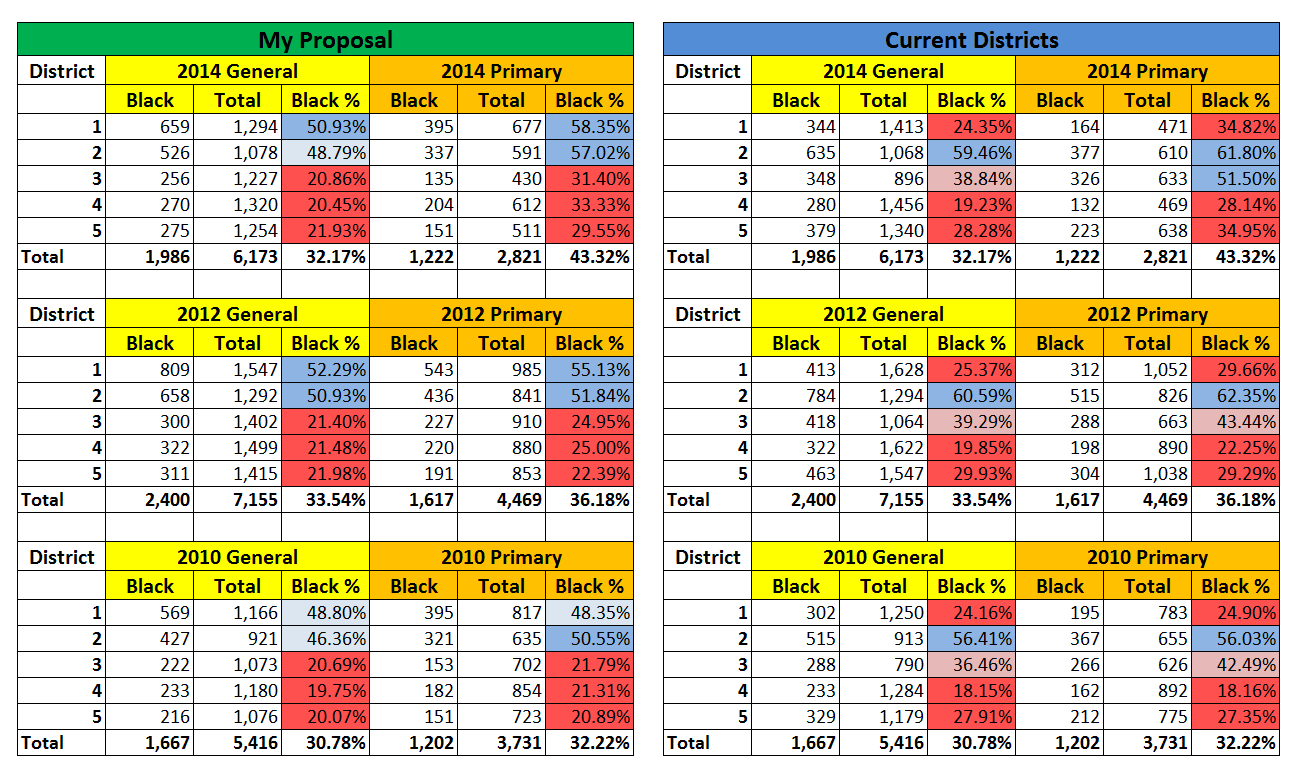
The primary in the general in 2014 was more African-American than in past years due to the Democrats making up a higher share of turnout than they had in past cycles. 2010 and 2012 saw GOP primaries for federal and state offices, but 2014 did not, leaving GOP turnout depressed. Since Democrats are becoming more African-American by the cycle in Jefferson, this inflated the African-American share of the primary. It may well fall below 50% in 2016 if the GOP voters turn out for the US Senate primary. More importantly, the general election, which is less Democratic thanks to NPA and GOPers showing up more, is less African-American under the current plan.
The problem with the primary vs general election dynamic under the current lines is that it leaves campaigns with the ability to manipulate circumstances. Boyd runs as a NPA and avoids a more African-American electorate. In the school board race, people could recruit a stronger African-American candidate to split the black vote and force the race into a November runoff. In 2012 and 2014, at least 2 districts in my proposal are solidly African-American in the primaries and narrowly so in the general. In 2014, my 2nd district was just under 50% black due to lower turnout, but was over in 2012, and both years were improvements from 2010.
Possible Changes and Conclusion
One criticism that might exist for my proposal is that it makes the one safe-black seat less safe, and that there is a risk both seats could be lost in a bad year. I understand this concern. I believe that this map would foster competitive elections and that ultimately African-American candidates would succeed. Washington and her African-American opponent’s combined share exceed African-American turnout, indicating at least some cross-over support, though admittedly not much. Jefferson of course has also twice voted for Obama despite less than 40% of the vote being African-American. With 2 districts just around 50% African-American in turnout in generals and over 50% in primaries, the chances of electing 2 county commissions and keeping 2 school board members African-American is improved. If changes are needed to my proposal, more African-Americans could be added to one district from the other, but keeping the 2nd district in my plan at least 45% African-American in November. The 38/39% under the current map is simply too low.
The court will be debating about Jefferson over the next few weeks. Here is hoping the current plan is thrown out and a new proposal is enacted that doesn’t use prisons to inflate the population and gives African-Americans a fairer shot at electing additional representatives.