
(Note: This article was originally published in Politico Florida in 2015).
The most contentious point of debate during 2015 redistricting special session has been what to do with District 5. The Supreme Court struck down the Jacksonville to Orlando configuration, represented by Corrine Brown since its creation, and ordered an east-west layout. The court specifically cited a proposal by the League of Women Voters as an acceptable alternative. This proposed 5th district was eventually adopted into the Legislative Staff’s “basemap,” exactly as it was laid out in the League’s plan.
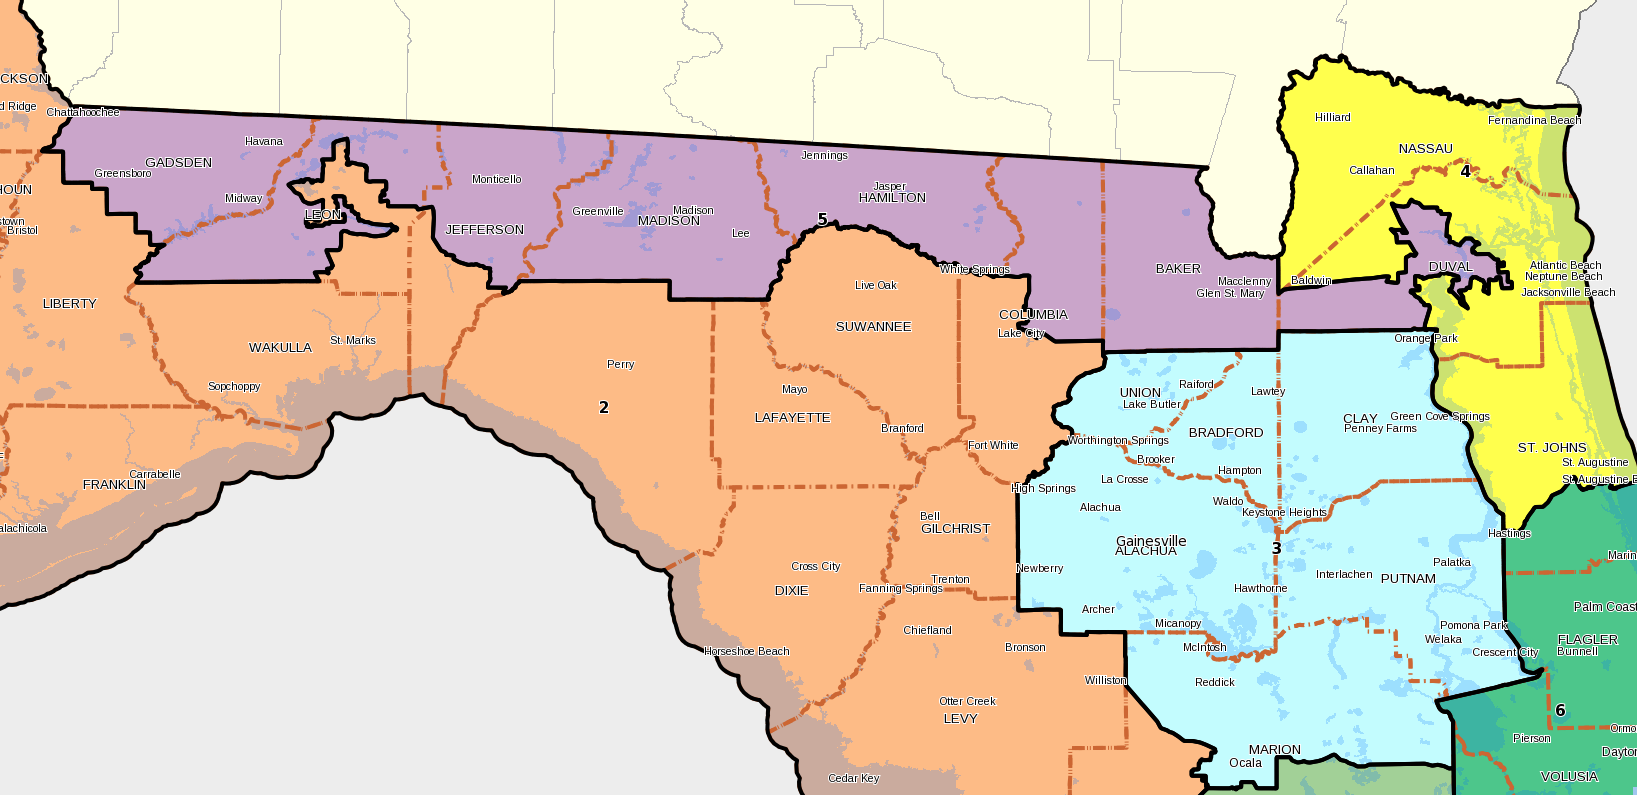
The proposed district has a Black Voting Age Population of 44.5%. 66.1% of its Democratic registration is African-American, and the district is so Democratic, giving Obama 63%, that the winner of a Democratic Primary will win the seat. In the 2012 and 2014 primaries, African-Americans made up 62.95% of the Democratic primary.
Several Senators have tried to offer amendments to boost the African-American share of the district. While this is a noble goal, the efforts barely move the needle and split more counties in the process.
The first amendment proposed was by Senator Gibson and Senator Simmons. Their proposed 5th district took Union County and parts of Alachua/Gainesville. The district loses population in Leon.
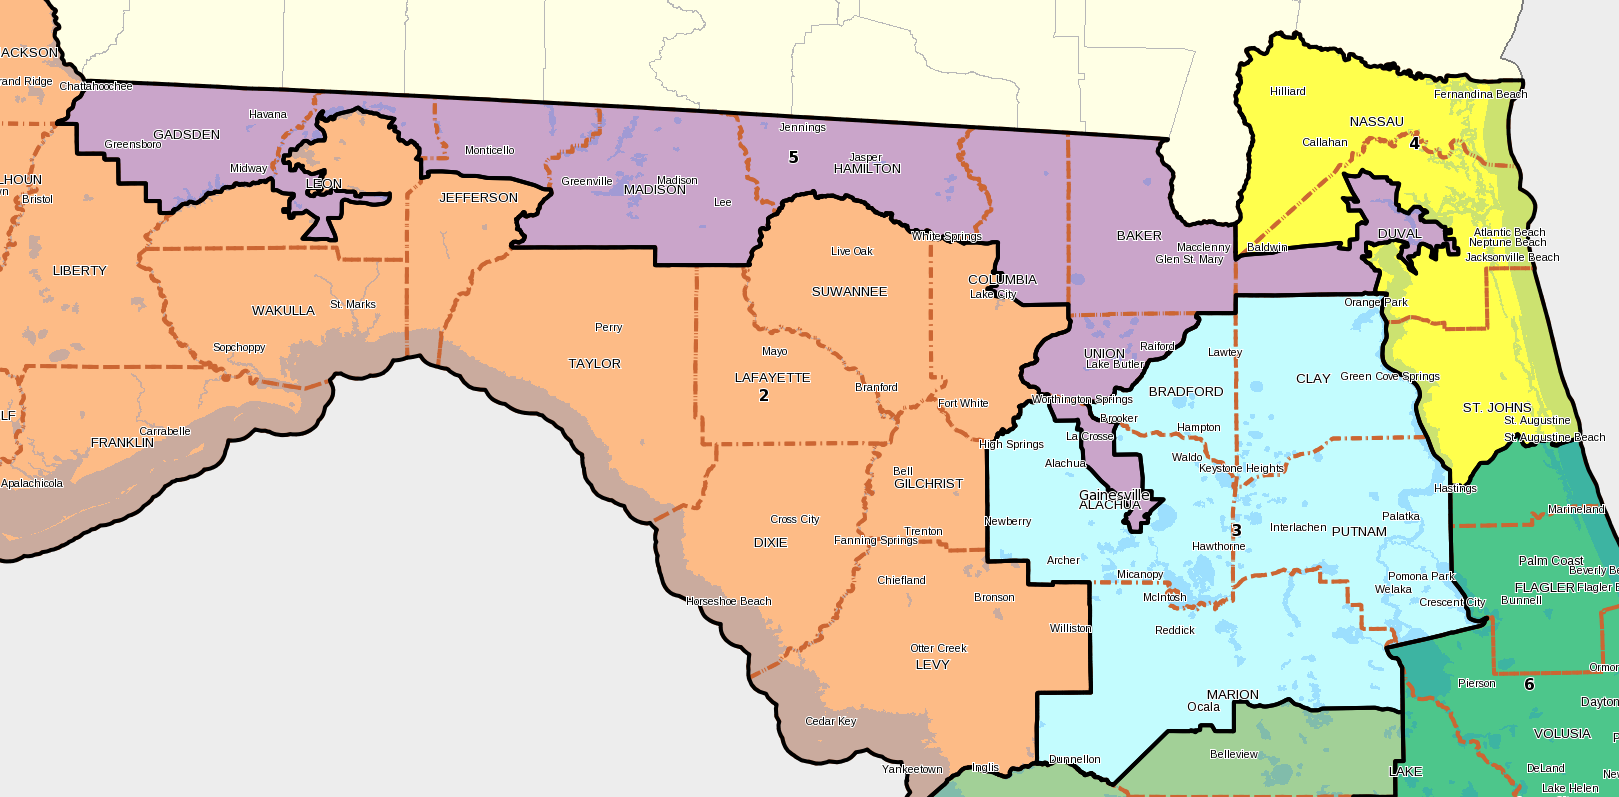
This 5th has an African-American Voting Age Population of 55.9%. 67.1% of the Democrats are African-American; up 1% from the 5th in the base map. The share of the 2014 and 2012 Democratic primaries is 64.2% and 63.8% respectively. This is up just over 1% from the base map. In exchange Alachua is split. The problem for the district is that is forced to take in all of Union, a heavily white county, which nearly negates the African-Americans it gains from Gainesville.
Senator Montford released a proposed amendment as well, which takes the district past Gainesville and down into Ocala.
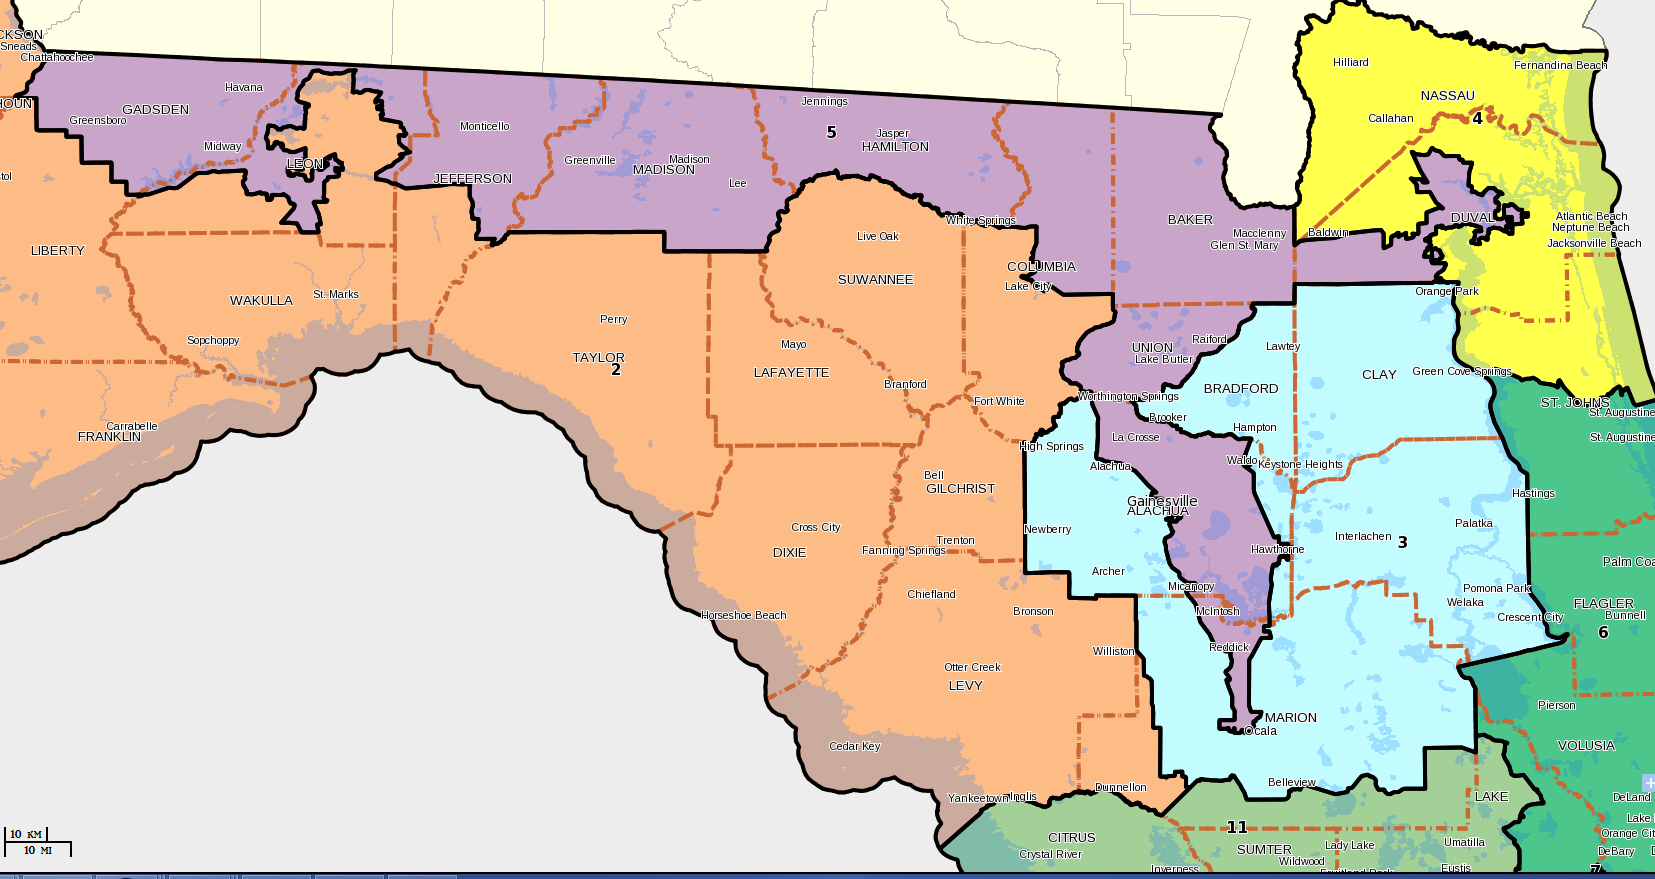
This proposal does raise the districts African-American Voting Age Population to 47.3%, higher than the base map or Gibson/Simmons amendment. However, in terms of the actual primary electorate, the African-American share is lower than in the Gibson amendment by a few 10ths of a percent. The most likely culprit is that new areas the district takes in has white Democrats who vote in higher turnout than African-Americans. The Alachua share of Montford’s proposal is less African-American than Gibsons, thus negating the African-American areas his district picks up in Marion.
The chart below sums up the African-American share of Democratic registration and primary turnout for each proposal.

As the chart shows, the changes in African-American share of the primary electorate are minimal across all three plans. While Montford’s has the highest African-American share in terms of Democratic registration, the actual turnout is lower than the Gibson/Simmons proposal.
I included the 2010 primary turnout data to bring up a key point. The 2012 and 2014 percentages were calculated by myself when I pulled precinct-level turnout data in my own software. Many precincts are split so these numbers are preliminary. The 2014 and 2012 data was not available in the redistricting software. The software from the state only has primary data up to 2010, which is before massive voter registration efforts took place under OFA. The Obama campaign’s registration efforts changed the demographic makeup of major urban areas, including Leon and Duval. These changes effected 2012 and 2014, as many newly-registered voters continue to vote, even in midterms. The Senators and legislative staff only have primary data up until 2010, which show’s a proposed district 6 points less African-American than current. This gap in data is fueling a desire to shore-up the African-American share of the district, splitting new counties in the process. The problem is, these new splits and appendages are barely moving the numbers. The amend districts have to take in rural white voters to get to African-American populations in Gainesville or Ocala.
To highlight this issue, I have compared the net African-American share of the 2014 primary electorate by county. I took the African-American share of the vote and subtracted the white share. A negative number means whites made up a larger share of the primary vote, and a positive number means African-Americans did. The larger the number, the bigger the gap.
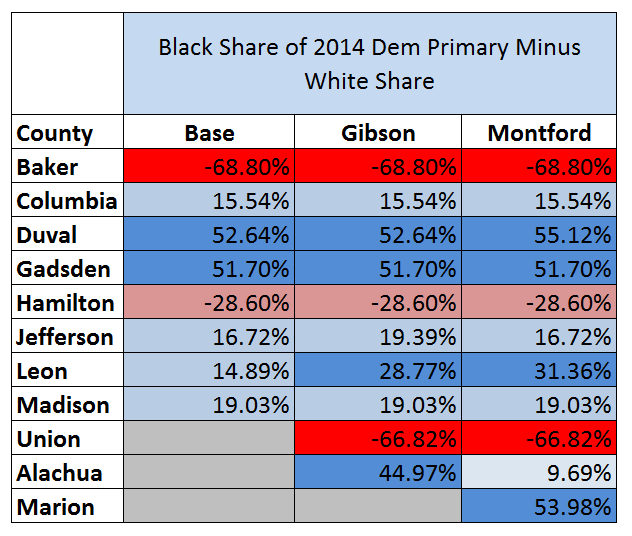
As the chart shows, the Gibson and Montford amendments are able to increase the African-American net share in Leon. However, they both must take in overwhelmingly-white Union County to do so. Montford’s amendment actually has a less African-American Alachua share but makes up for it a bit with Marion. The introduction of Union is what really slows down the growth of African-Americans as a share of the total district. It is just so overwhelmingly white, even in the Democratic primary.
That chart showed the percentages, let’s look at actual raw votes. I took the African-American votes cast in the 2014 primary and subtracted the white votes. Using raw numbers gives a clearer picture of the dynamics at play since it reflects the population size of the counties.
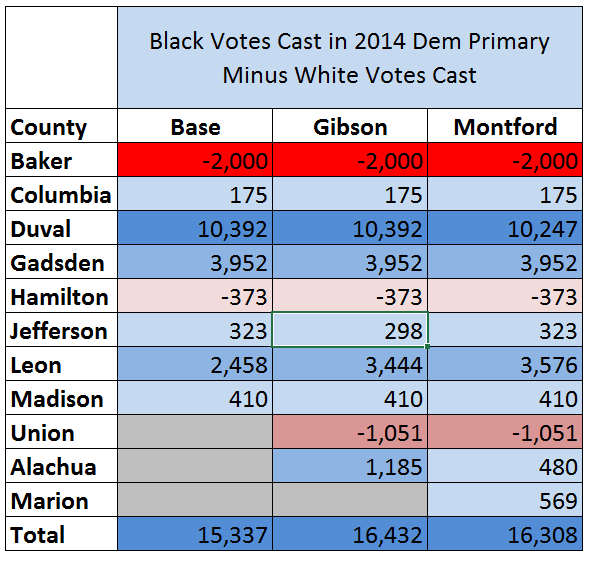
Both the Gibson/Simmons and Montford amendments boost the African-American advantage over white voters in Leon. However, African-American gains in Alachua and Marion are negated by the net white gains in Union. Overall, both amendments split 1 or 2 additional counties and only net 1,000 to 1,000 African-American voters.
It is questionable that the Supreme Court would see the additional county splits as justified considering the gains for African-Americans are marginal. Under the base map African-Americans are very likely to determine the congressperson for CD5. The amendments, while good intentioned, do not change that dynamic in any significant way.
Efforts to increase the African-American share of CD5 are well intentioned and noble. However, the reality of North Florida is that these appendages cannot reach enough net African-Americans justify the compactness reduction and county splits. The Florida Redistricting website needs to update its data so that Senators and House members can get a more up to date look at the primary elections of these minority-access districts. Right now the picture painted by the state software is of a CD5 that is less African-American than it actually is. With the base map’s proposed district showing a 63% African-American Democratic primary, and with the court already signaling the district as acceptable, any attempt at non-compact changes may not be seen as justified in the court’s eyes.