The 2018 Elections
The 2018 midterms were a good night for nationwide Democrats. The party took control of the House of Representatives and pickup up 7 Governorships. However, in Florida, results were much bleaker for team blue. Andrew Gillum lost the Governor race to Ron DeSantis and three-term Incumbent Senator Bill Nelson lost to outgoing Governor Rick Scott. Democrats did managed to gains several state house seats, a state senate seat, and the Commissioner of Agriculture cabinet post – but the sting of Gillum and Nelson’s losses still leave a bitter taste in the mouths of party members.
Both races were so close that they went into recount territory. DeSantis wound up winning by 30,000 votes and Scott by 10,000. Democrat Nikki Fried won the Agriculture race by just 6,000 votes. Florida held true to its close-race nature. There were some notable shifts in the map from 2016. Gillum and Nelson both reclaimed Pinellas and St Lucie County – white working-class counties which had backed Obama in 2012 but Trump in 2016. In addition, both won Duval and Seminole, counties who’s well-educated suburbs swung to Democrats; reflecting nationwide trends. Look at a map comparing 2016 to 2018 by loyalty
The swing of Seminole and Duval to democrats was a major development. Both counties have leaned more GOP and the idea that a democrat would win them while losing Florida overall seemed far-fetched before election night. However, neither Gillum or Nelson were able to improve with white, working-class voters enough to turn around trends in counties like Pasco, Volusia, Flagler, or Polk. They slightly improved from Clinton’s margins, but fell well short of Obama’s stronger showing with those voters in 2008 and 2012.
However, WWC voter issues aside, Gillum and Nelson could have pulled off narrow victories anyway. But one other issue emerged – Miami-Dade County.
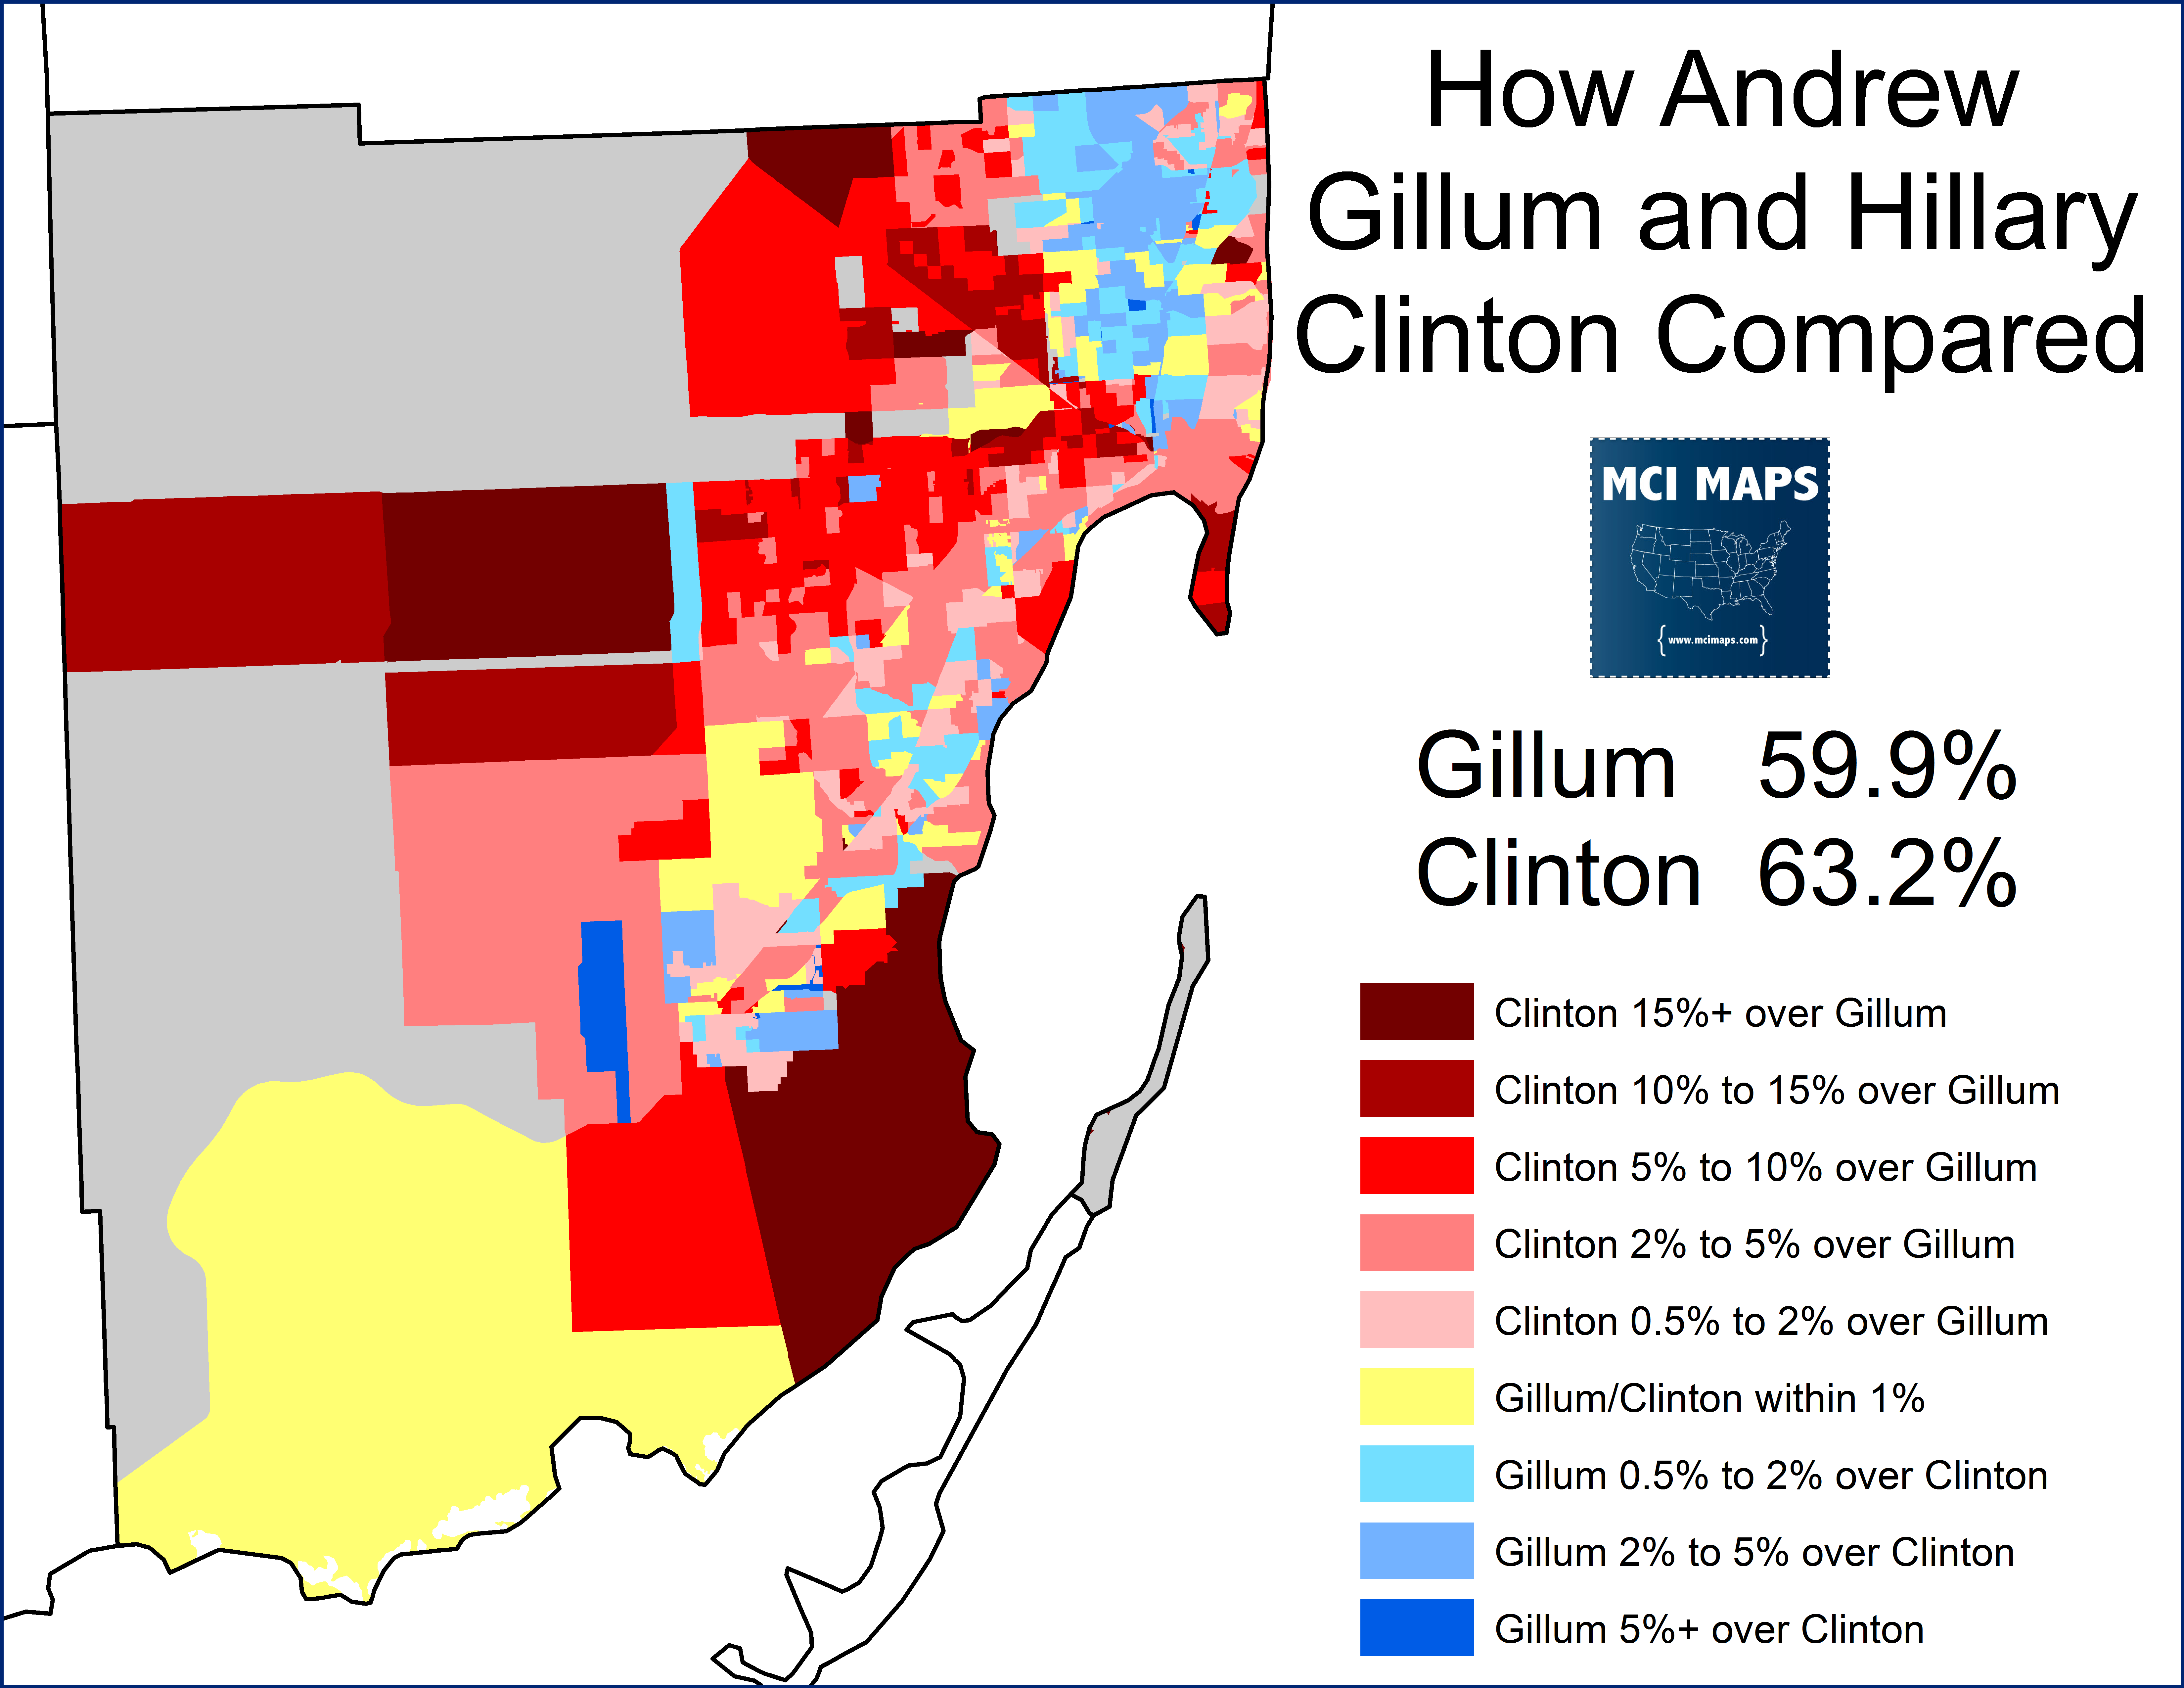
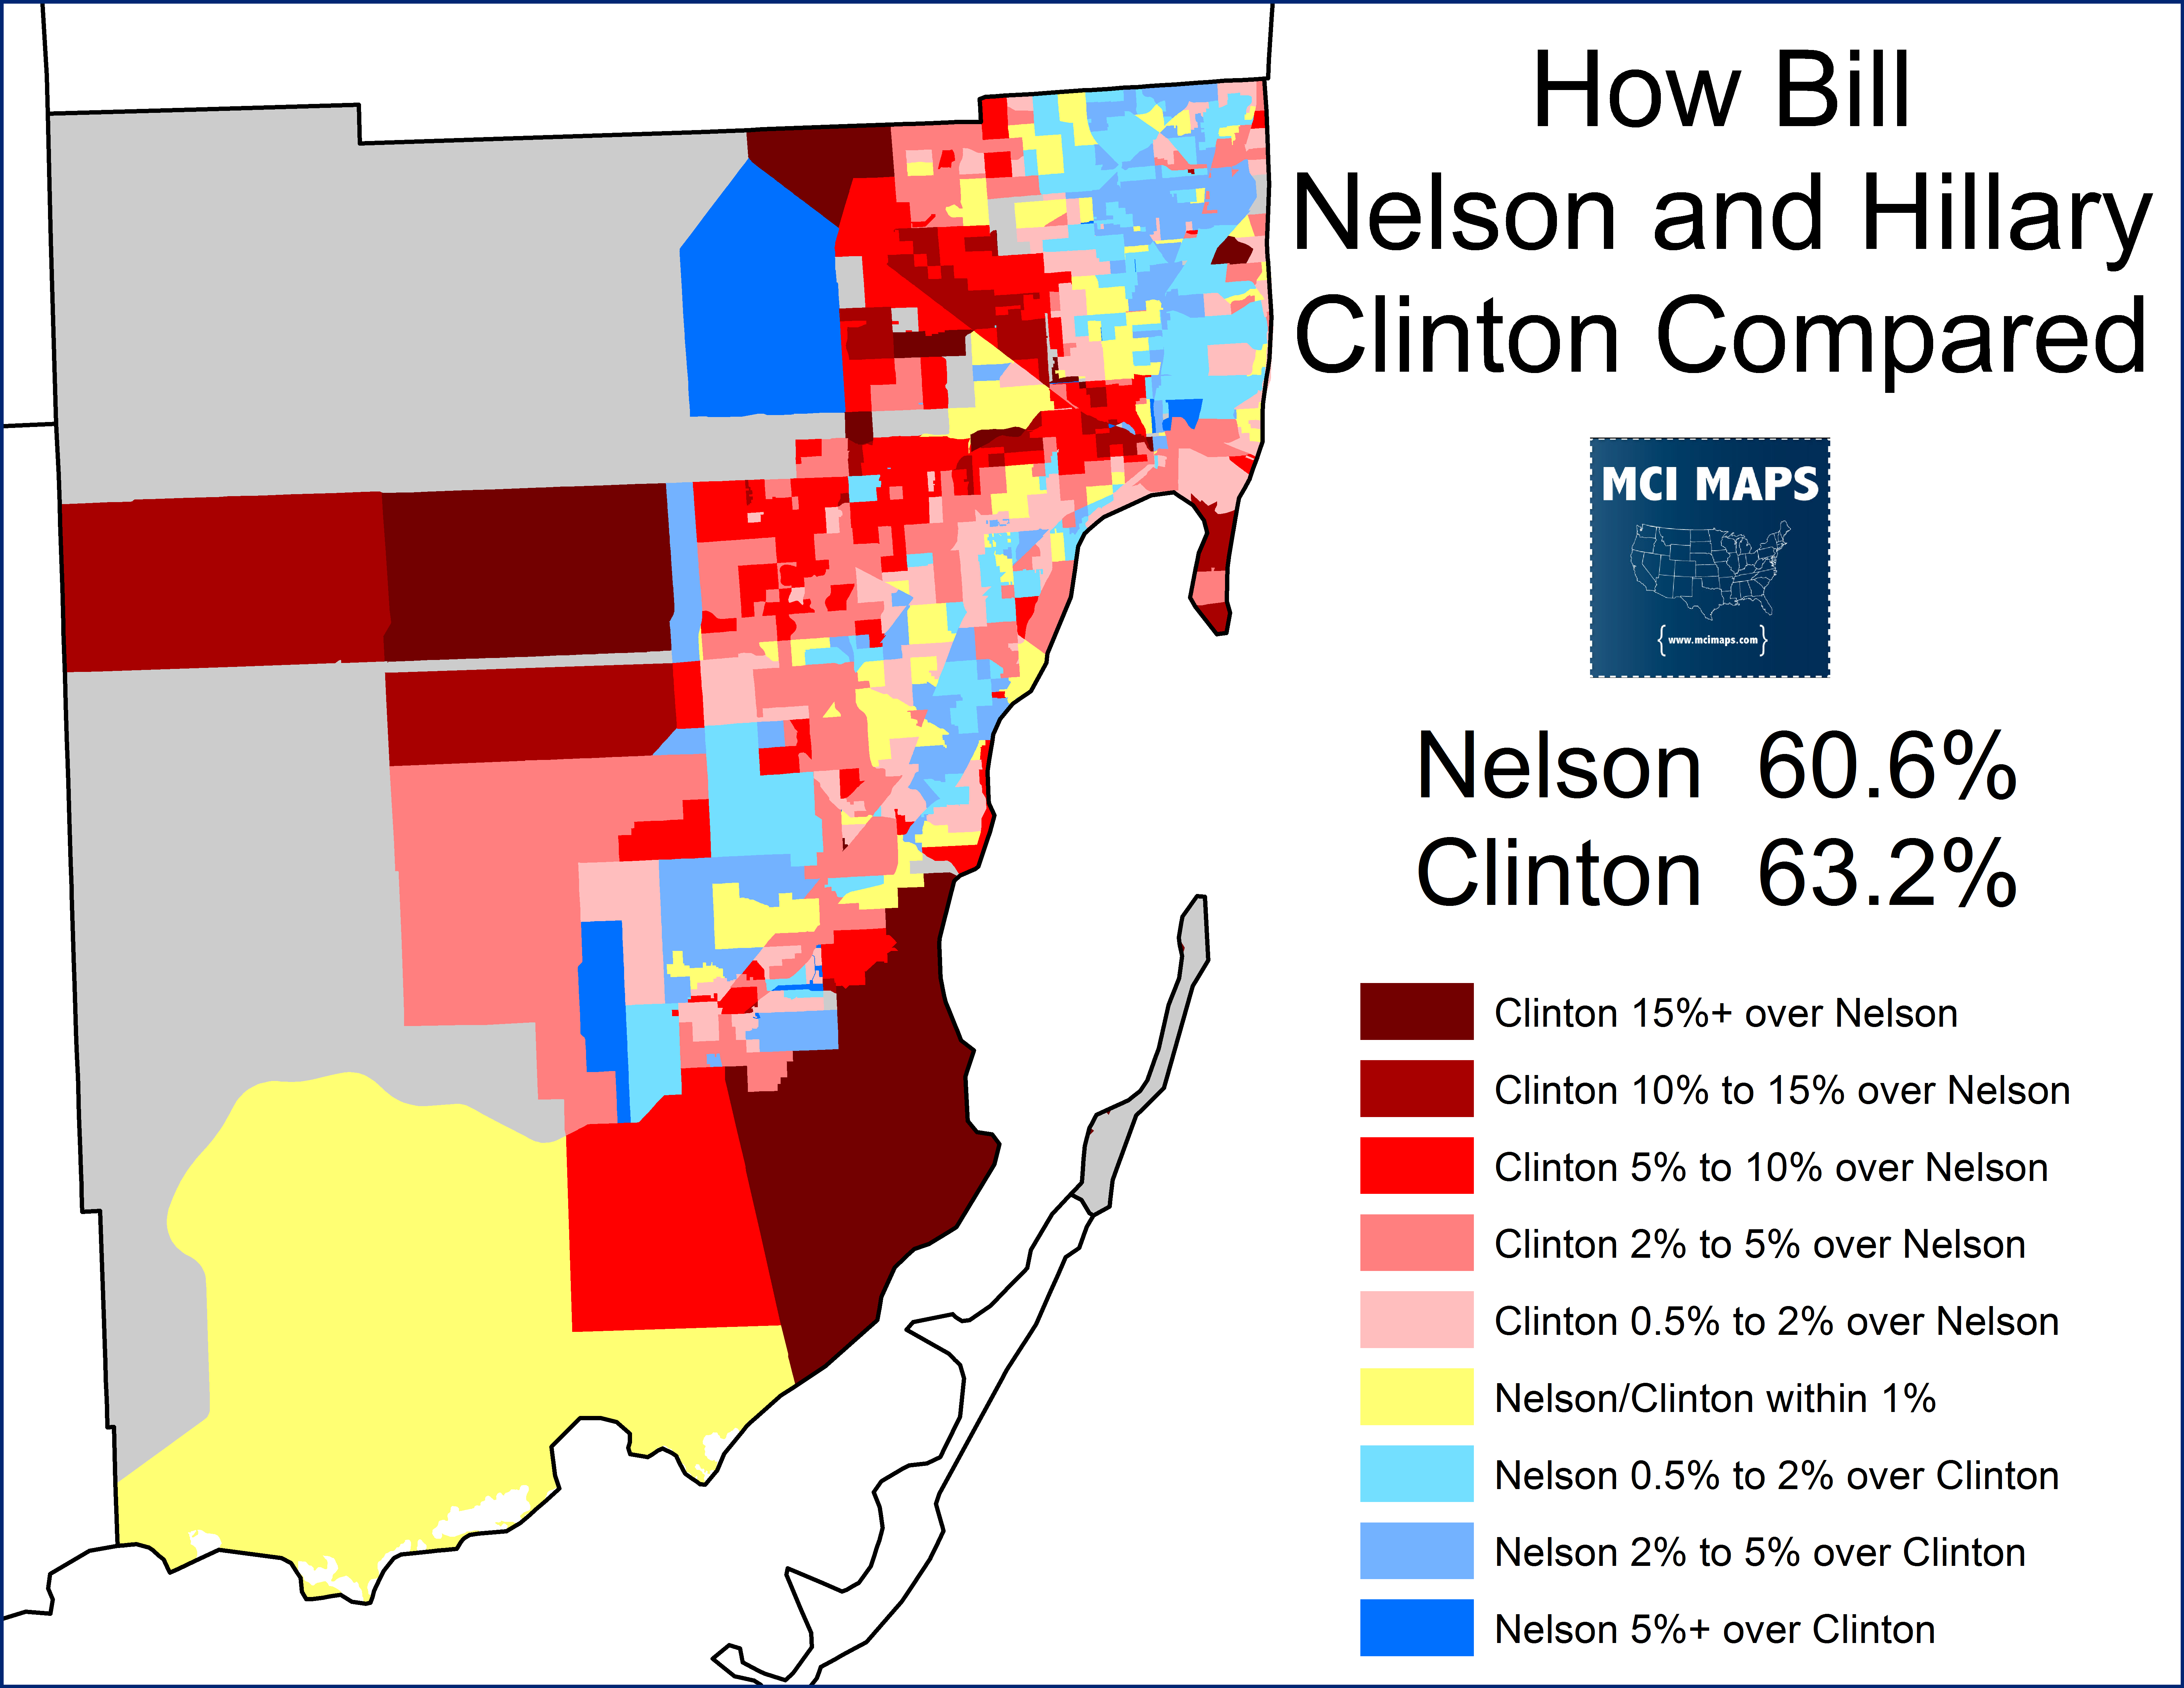
When Clinton lost Florida by 1.2% in 2016, she did so while scoring record margins in Miami-Dade. However, in 2018, Dade swung toward the GOP. It remained solidly blue, but the shift of several percentage points cost Gillum and Nelson tens-of-thousands of votes. The maps below shows how the margin between Dem and GOP candidates shifted from 2016 to 2018.
Miami-Dade wasn’t the only county where Nelson and Gillum under-performed Clinton – but as the largest county its shift had the biggest impact. More needs to be said about Nelson dropping the ball to Scott with Puerto Rican’s in central Florida and the further shift of the southwest to Republicans; but that will be left for another time.
Miami-Dade County
Miami-Dade is a unique county in Florida. It has a population around 2.7 million and is the 7th most populous in the nation. It is solidly Hispanic in terms of census data and voter registration. In 2018, 56% of votes cast were from Hispanics.

One would imagine that such a heavily non-white county would be overwhelmingly Democratic. While Dade is pretty blue, its not as much as many people expect. Democrats had a 13 point advantage in the 2018 vote cast (down slightly from their 16% advantage with registration) and Democrats normally secure wins in the high 50s or low 60s. These margins, however, are weaker than many heavily non-white counties. Why is that? Because while Hispanics nationwide are very Democratic, many Miami-Dade Hispanic voters are Republicans.
Of course if you know anything about Miami-Dade in a cultural or political sense – you likely know it is the largest concentration of Cuban-American voters. Not all Hispanics in Dade are Cuban, but Cuban’s make up by far the largest share of Hispanic residents and voters.
For the longest time, Cuban exiles were solidly Republican. Fleeing the communist Castro regime instilled a rigged anti-left sentiment in the first arrivals. With time this sentiment has changed. Young Cubans and those born in Florida are much more Democratic or non-partisan than their older family members.
The Cuban block used to be so reliably Republican that when Bill Nelson won over 60% of Florida in his 2006 re-election, he still lost the three most Cuban districts in the state.
When 2016 came around, Clinton won all districts in Miami-Dade. This wasn’t just anti-Trumpism, but also the fact that since the early 2000s, generational change has made Cuban Americans less GOP-heavy.
Miami-Dade in 2016 and 2018
Miami-Dade has been trending blue since 2000. However, it reached its peak in 2016. Generational change and anti-Trumpism combined in the Presidential Election to give Clinton a record margin for any Presidential candidate in modern Miami-Dade. Cubans were never a strong group for Trump, backing Marco Rubio by a large margin in the Florida primary. Trump’s personal scandals did not appeal to the culturally-conservative older Cuban generation. Trump’s racism and anti-Hispanic attitude during the campaign also made many of the communities most solid GOP members scoff at backing the man. In addition, non-Cuban Hispanics moved even further to the Democrats. Trump went on to secure a record-low 34% in Miami-Dade.
Exit polls and precinct data both say Trump likely won the Cuban vote, but by a historically weak margin. He won Cubans by around 5 points, according to select precinct data. This is a group Republican’s normally easily win. For example; Hialeah, an epicenter of Cuban life, only backed Trump by 100 votes after backing Romney by 10% in 2012.
That same day, Senator Marco Rubio won re-election in Florida. A Cuban himself, he won the voting block by 30%. In addition, Trump lost an estimated 25% of Republican Hispanics back Clinton.
However, similar to Mormon voters in Utah and Idaho, anti-Trumpism didn’t mean anti-GOP. These voters were longtime Republicans who had no issue backing Marco Rubio in the Senate race or Cuban Republican candidates for state house, state senate, and congress. Post-2016, as Dade went through several special elections, consultants like myself had to remind the national press that the 2016 Presidential Vote was not a realistic indicator for general party support. Long story short, there was a real risk of Democratic candidates for statewide or local office under-performing Clinton’s historic margin.
When the 2018 elections came around, that is exactly what happened. Gillum and Nelson under-performed Clinton. Not only did they not get Clinton’s 63%, but the third-party votes from 2016 went away, allowing DeSantis and Scott to 5-6 points better than Trump had.
Voters who cast ballots for 3rd party candidates either did not show up this time or broke heavily for the GOP.
Looking at how Clinton’s percent of the vote compared to Nelson or Gillum’s percentages show that the biggest drops came in the Cuban community. Meanwhile, both did better with African-Americans
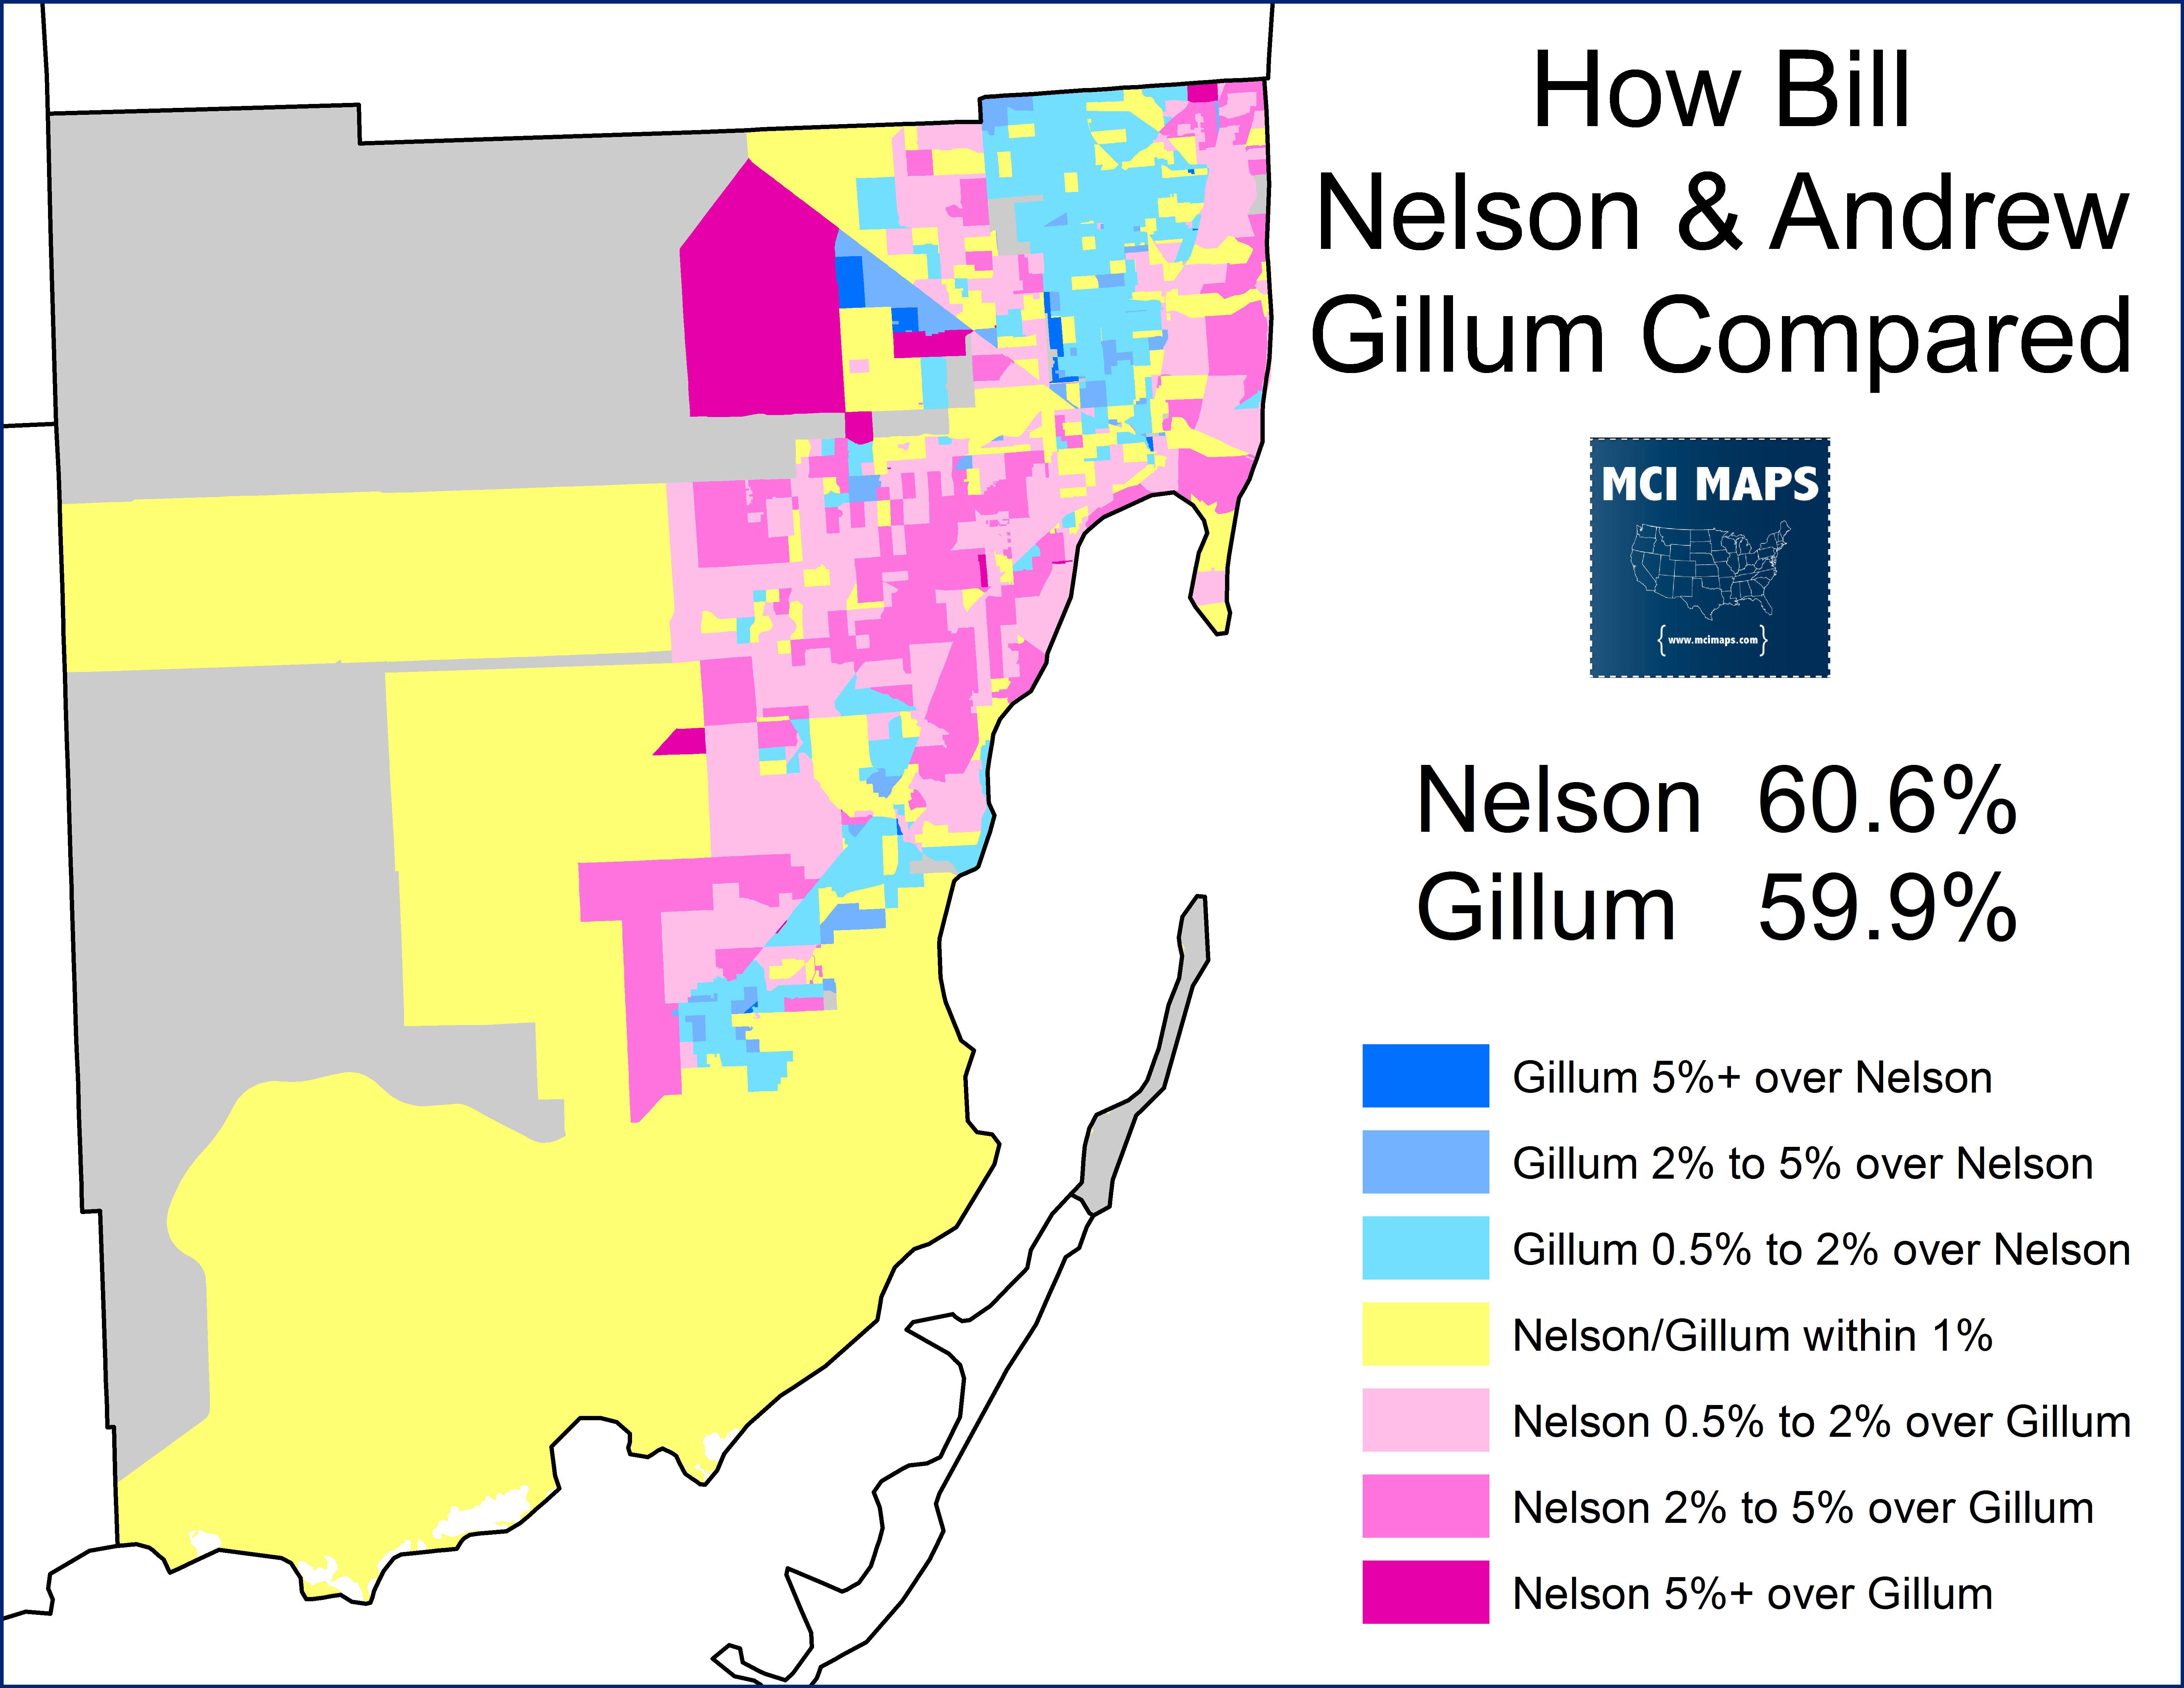
Nelson did slightly better than Gillum with whites and Cubans while doing slightly worse with African-Americans. Overall these differences were only a few points.
Since 2000, most midterms saw Miami-Dade perform worse for the Democratic candidate for Governor than for the candidate for President. Overall, though, the margin for Democrats has been steadily increasing.
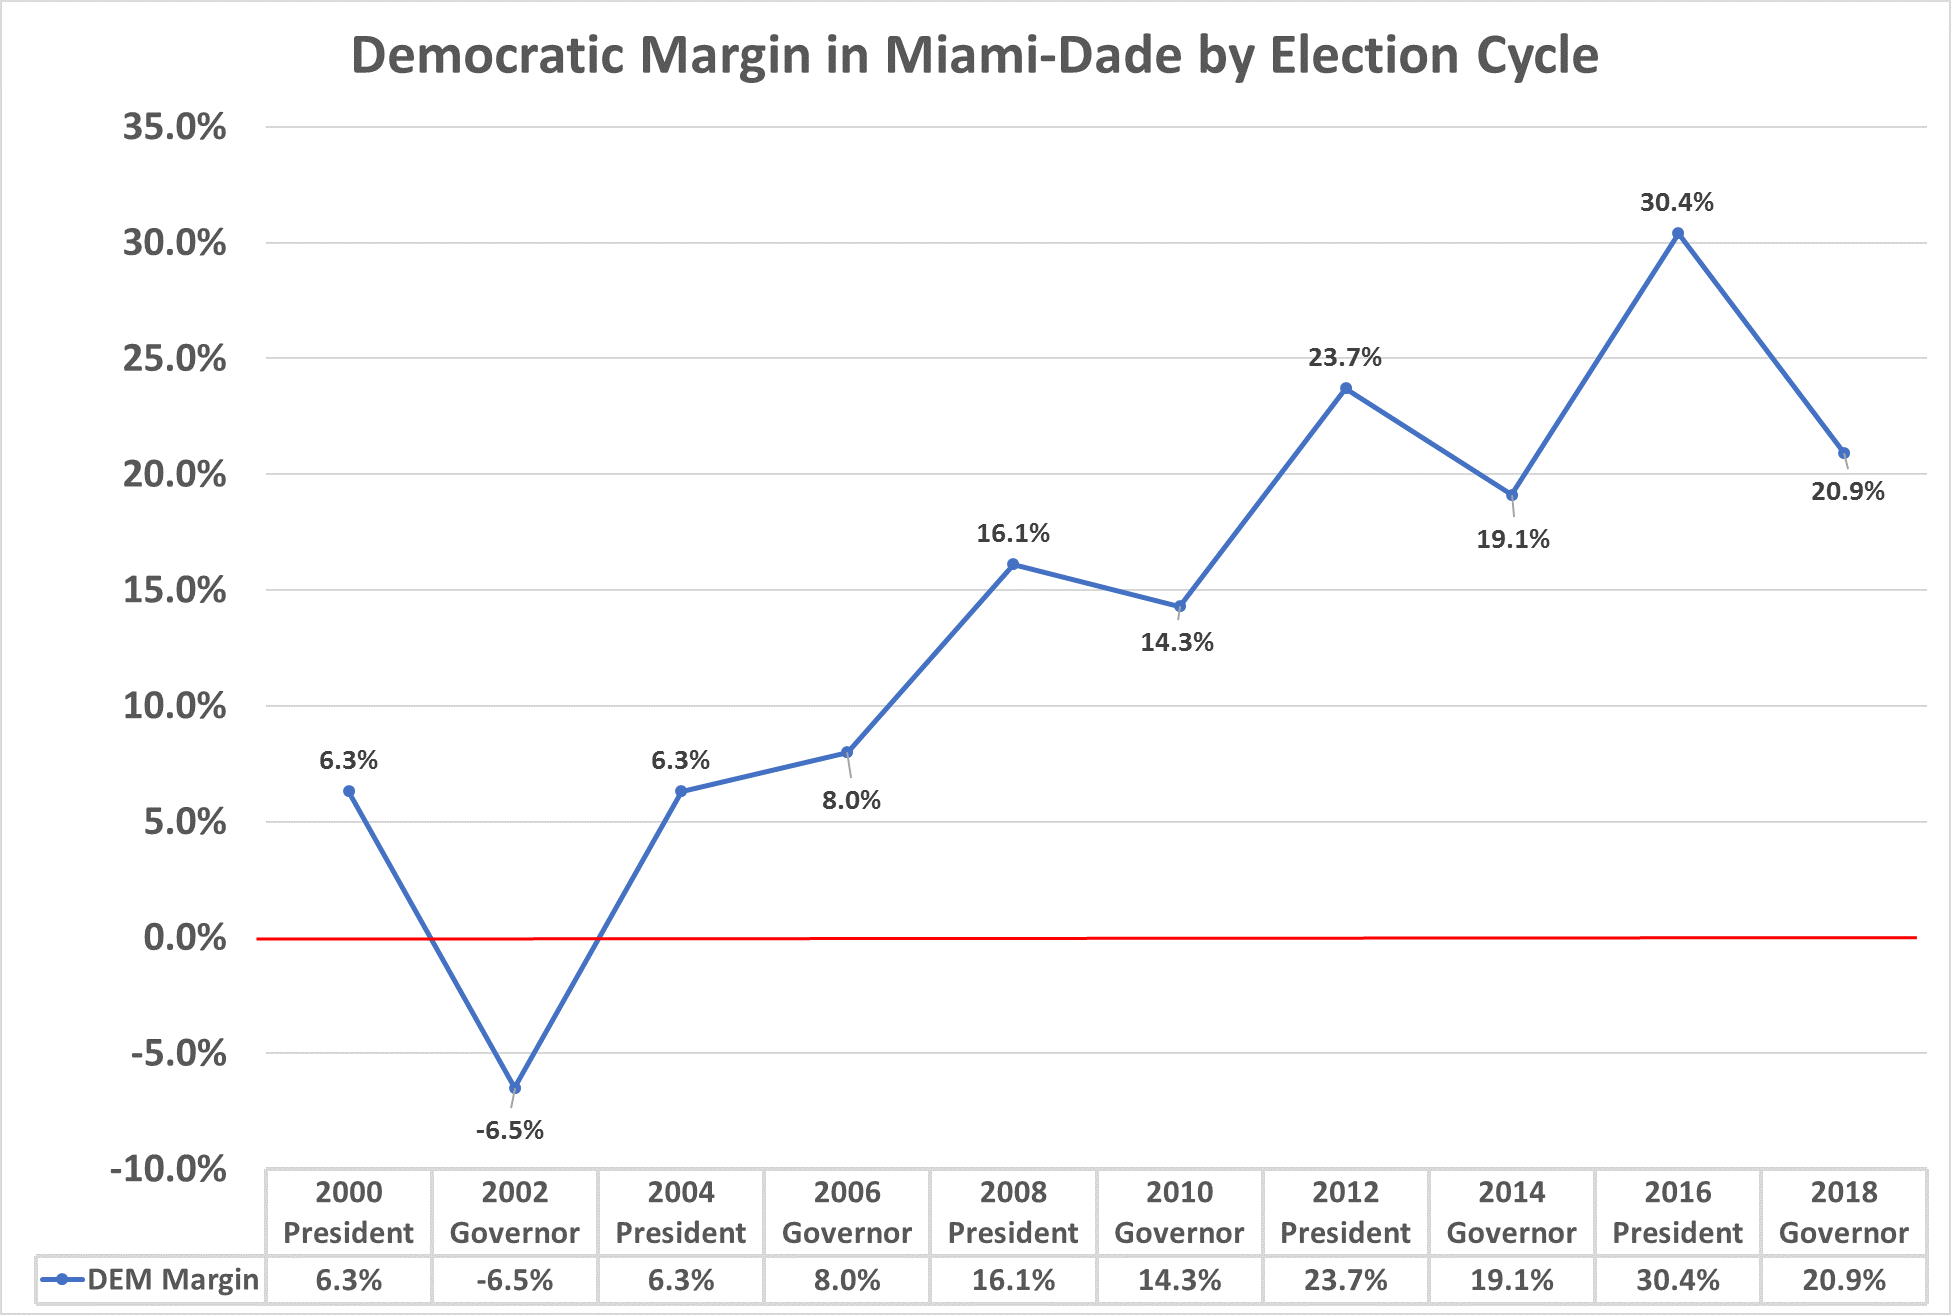
The drop between 2016 and 2018, however, was the largest since 2002 (when Jeb Bush actually won Miami-Dade in his blowout re-election).
Part of the reason for this huge drop was, as I’ve already discussed, Trump’s historic weakness in the county. However, another issue was one Democrats had much better control over – turnout.
Turnout in Miami-Dade
Turnout in Miami-Dade was very strong for a midterm. Turnout in Florida went from 50% in 2014 to 62.5% in 2018. Miami-Dade saw disproportionately higher turnout increased after many midterms in the 39% to 40% turnout range.
This, of course, was good for Democrats. Higher Miami-Dade turnout means more net votes as a result. However, what happened in Miami-Dade, and Florida as a whole, was that Democrats AND Republicans had higher than usual turnout. Democrats showed up to protest Trump, but Republicans likewise showed up to defend him.
Looking at the votes cast broken down by party registration – the partisan gap between the two parties in Miami-Dade was 14.5% for Democrats in 2016, but that dropped to 13.5% in 2018. Registered Republicans increased their share of the vote cast while Democrats stayed roughly the same, and people registered to no major party (NPAs) fell. The table below shows the share of the vote cast based on party registration AND race. As it shows, Hispanics saw a much higher share of their vote coming from registered Republicans in 2018 compared to 2016.
African-Americans stayed the same and Democrats actually improved their turnout with whites. However, that 4 point GOP swing with Hispanics drove the overall county shift to a slightly more GOP electorate. Obviously an improvement in registered Republican share of the vote aided in Republican candidates doing better in the county.
Among Hispanics, older voters were the key driver of registered Republican increasing as a share of the vote. The table below shows 2016 and 2018 Hispanics broken down by party registration and age group. I break these groups down by share of vote cast, registration at that time, and overall turnout. Take the time to look through this table. They key stat is this: it was Hispanics 35 and older who saw their GOP share of vote cast increase the most – despite their registration figures remaining fairly static.
The turnout data shows how registered Republicans over 35 managed to maintain stronger turnout overall, while Democratic and NPA Hispanics fell into lower turnout brackets. The bottom line, older Hispanic Republicans did a much better job showing up than older Hispanic Democrats or older Hispanics not registered to a major party. This resulted in a more Republican electorate.
District-Level Results
Congressional Results
The Republican advantage with older Hispanics moved Miami-Dade overall, but it effected certain districts more than others. This actually helped Democratic Congressional candidates. Looking at vote cast by registration and by congressional district shows that the GOPs improvement as a share of votes cast was largest in the 25th district and more marginal in the 26th and 27th (with Democrats maintaining their advantage).
In 2018, despite some slipping from 2016, registered Democrats remained the plurality of votes cast in the 26th and 27th. This was very important (along with a more friendly NPA electorate in these districts) in winning both congressional seats.
Also to note, the improvement in votes cast for Democrats in the 24th district (a majority-black seat) showed that Democrats did a good job getting the black vote out.
State Senate Results
Registered voters as a share of votes cast by State Senate district tell a similar story. Registered Republicans improved their share of the vote the most in heavily Hispanic districts like the 40th, 39th, and 36th. The shift in the 36th, based around Hialeah (also where the 25th Congressional district is) made picking up that state senate seat this cycle very unlikely.
Democrats did improve in African-American heavy 35 and 38, and avoided major drops in the 37th – which is Hispanic but with a smaller Cuban population.
In 2016, all senate districts in Miami-Dade backed Clinton. This time, the 36th flipped back to the GOP, giving DeSantis and Nelson right around 51% of the vote.
Democrats made a play to with the 36th district, but it was never the most premier target (I always had it ranked as “Lean GOP”). Indeed winning it would have been especially tough with the top-of-the-ballot going GOP.
State House Results
Breaking down Miami-Dade by its many state house seats further highlights the main point – Hispanic Republicans improved their share of the vote from 2016 but African-American and white Democrats also improved.
The most Hispanic and Cuban state house districts all saw jumps in registered Republican share of the vote. Meanwhile the heavily Democratic African-American districts saw improvements for Democratic share of the vote cast. It should also be noted many of these heavily Democratic districts have notable non-Cuban Hispanic populations, which appeared to have better Democratic turnout dynamics.
Looking at partisan makeup as a share of vote cast vs share of registration reveal that Democrats under-performed. The party has a 16 point advantage with Republicans in registration but only a 13.5% advantage with share of the vote cast. However, looking at this by state house district reveals Democrats outdid their registration in African-American districts while under-performing their registration in Hispanic districts.
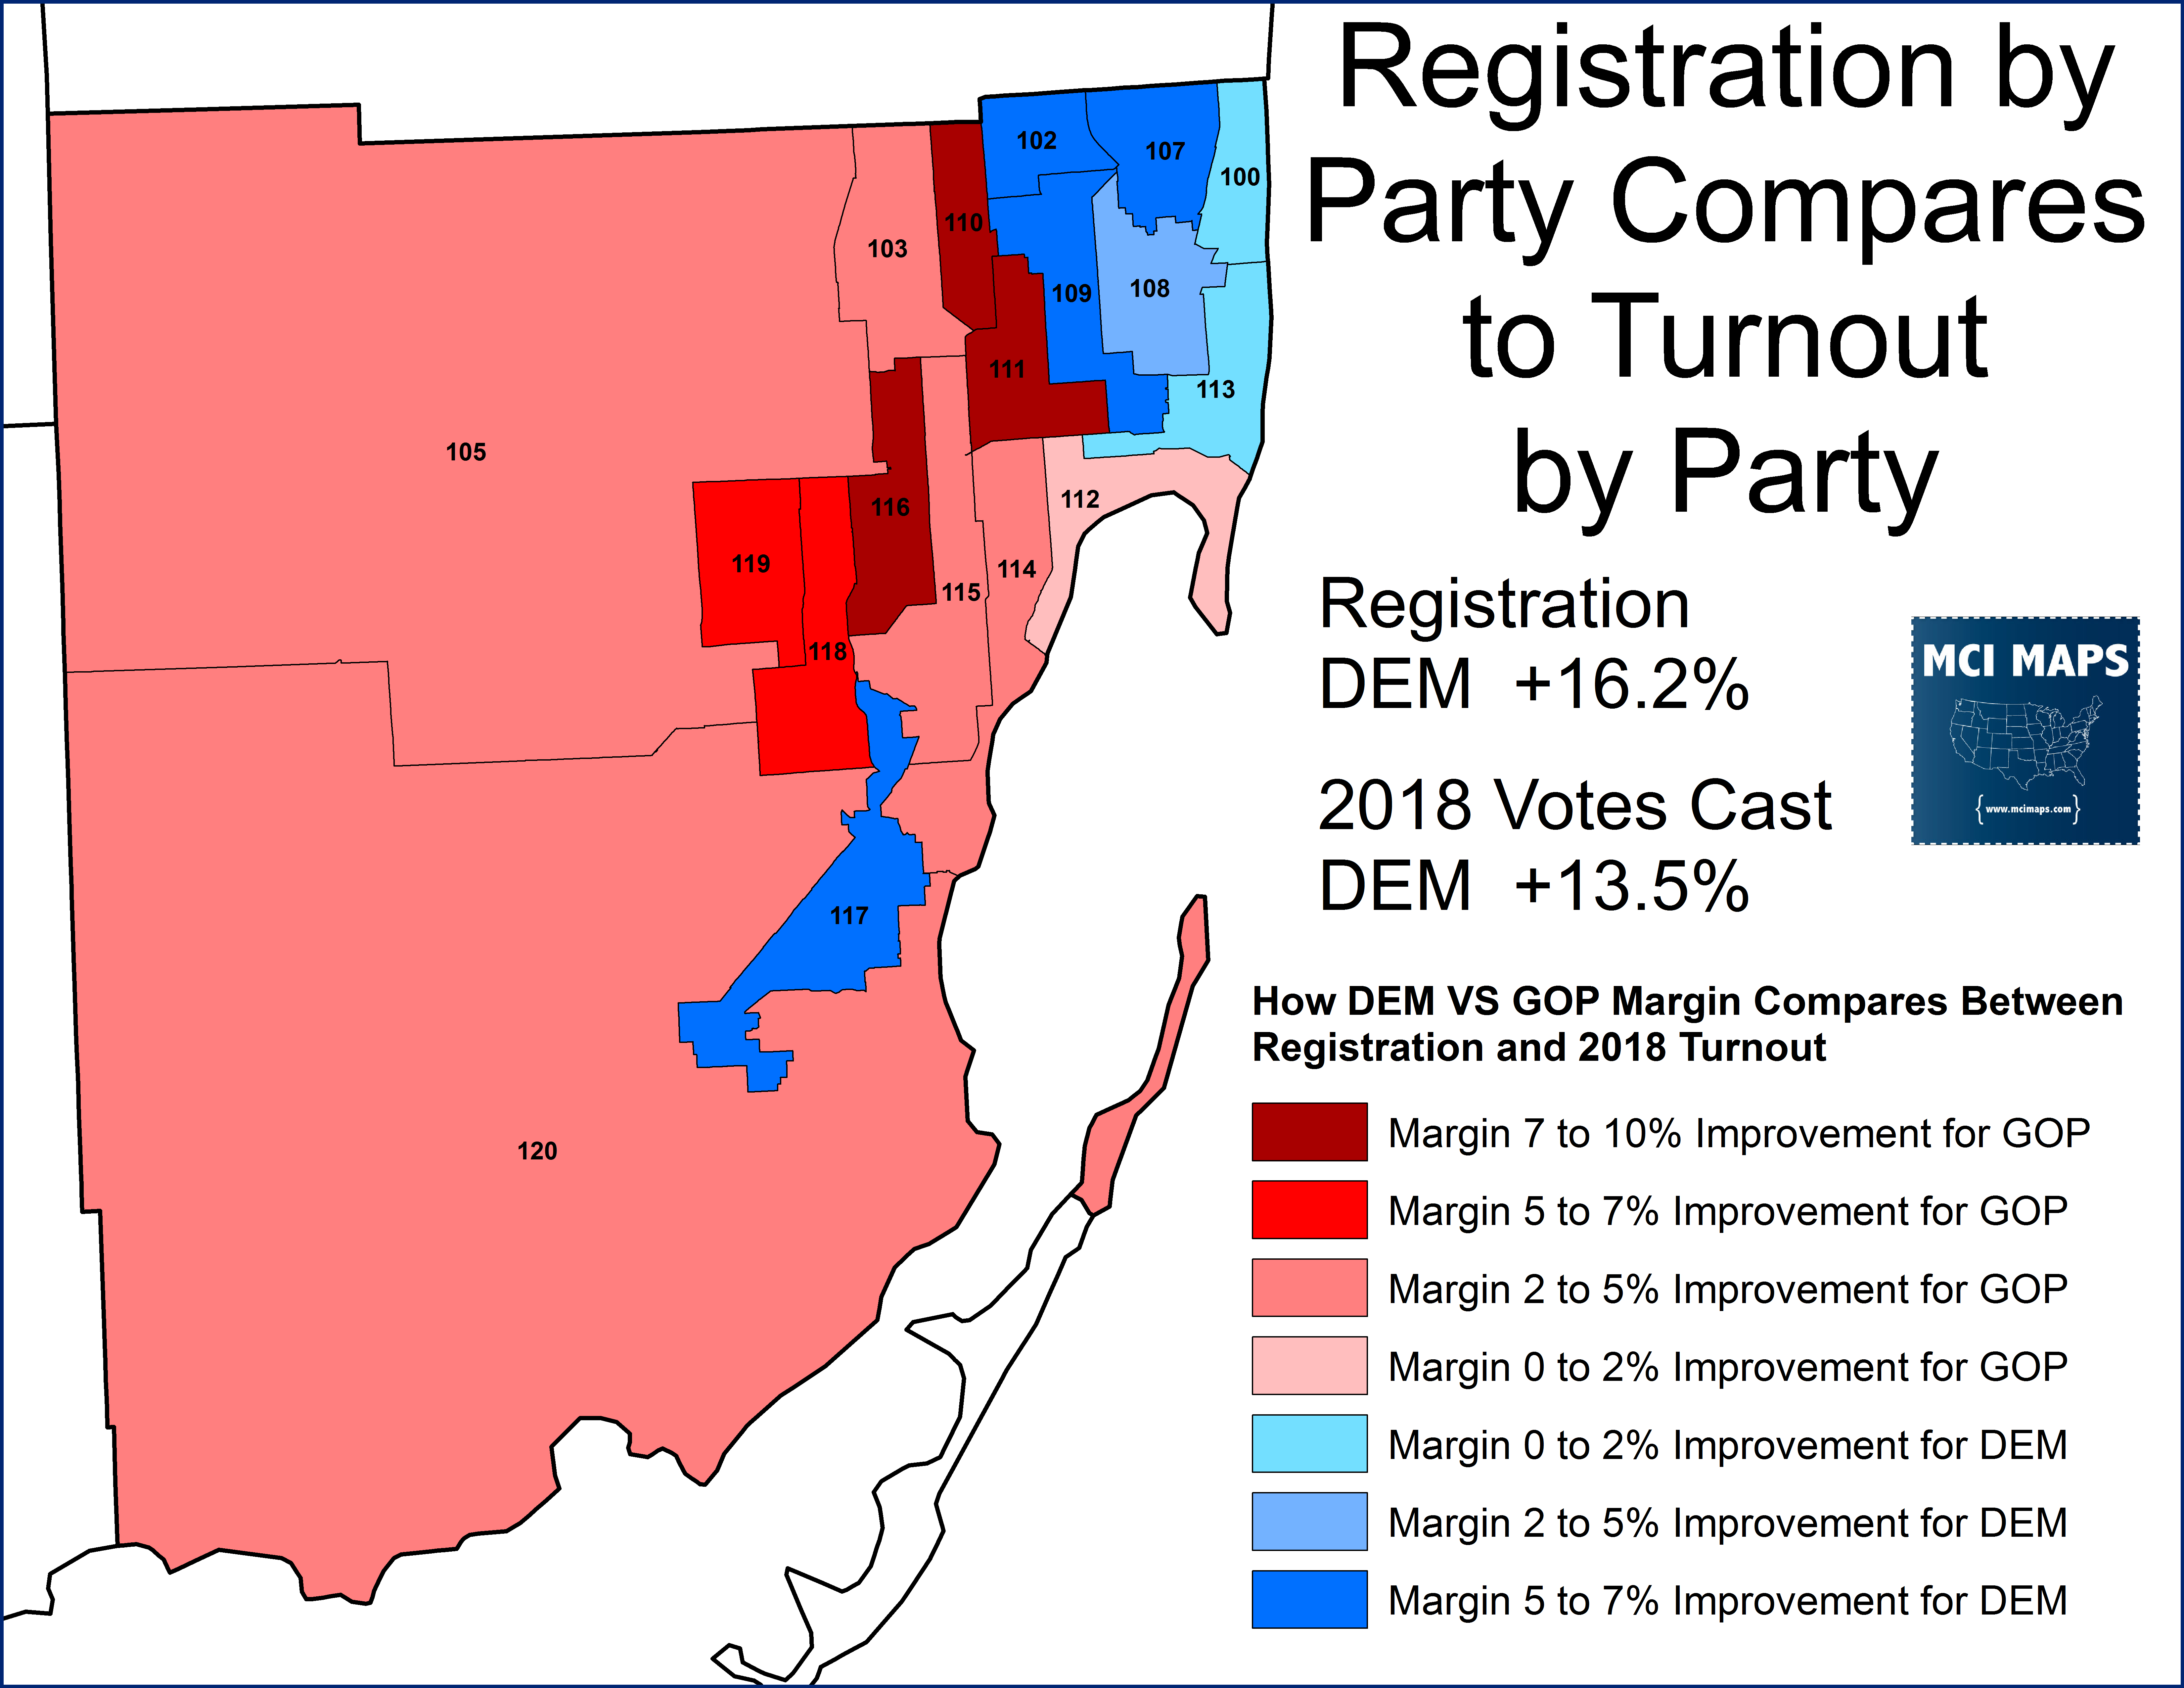
The three house districts were Democrats under-performed their registration the most (116, 110, and 111) and the only three majority-Cuban districts in the state. This further backs up the argument that it was specifically older Cubans (who skew GOP) who came out and voted in strong numbers while young Cubans (who can be more Democratic) did not.
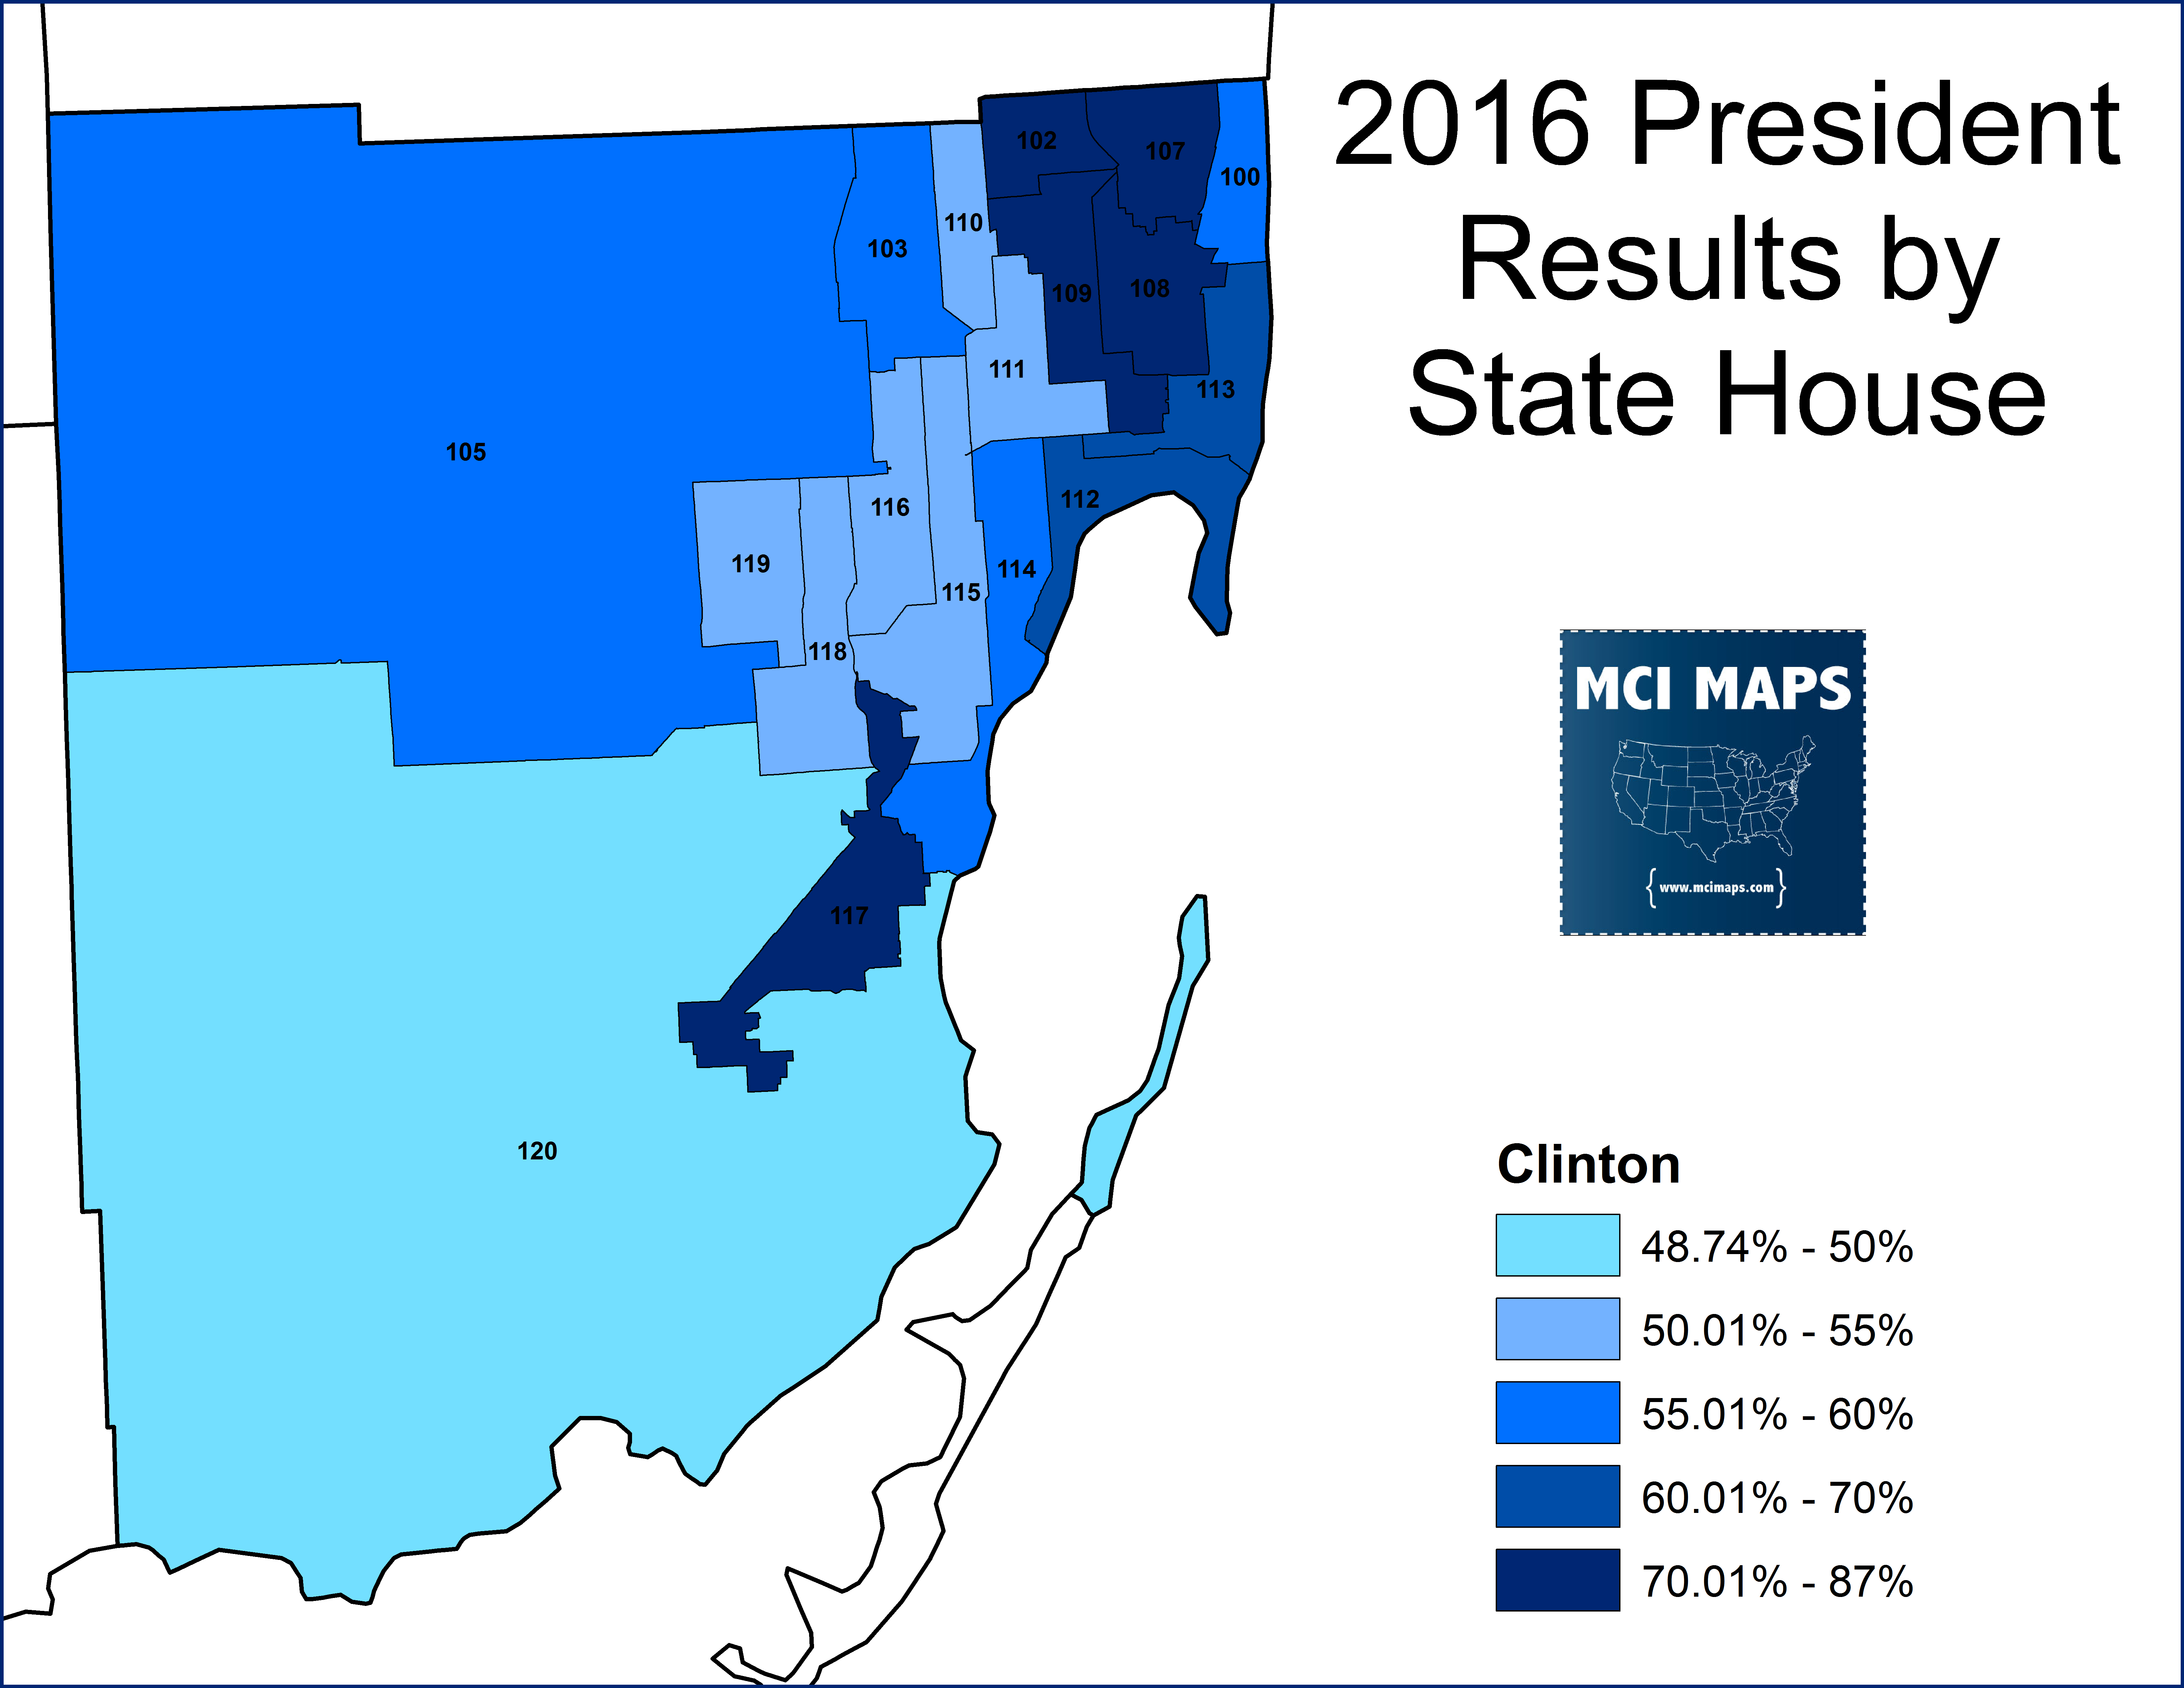
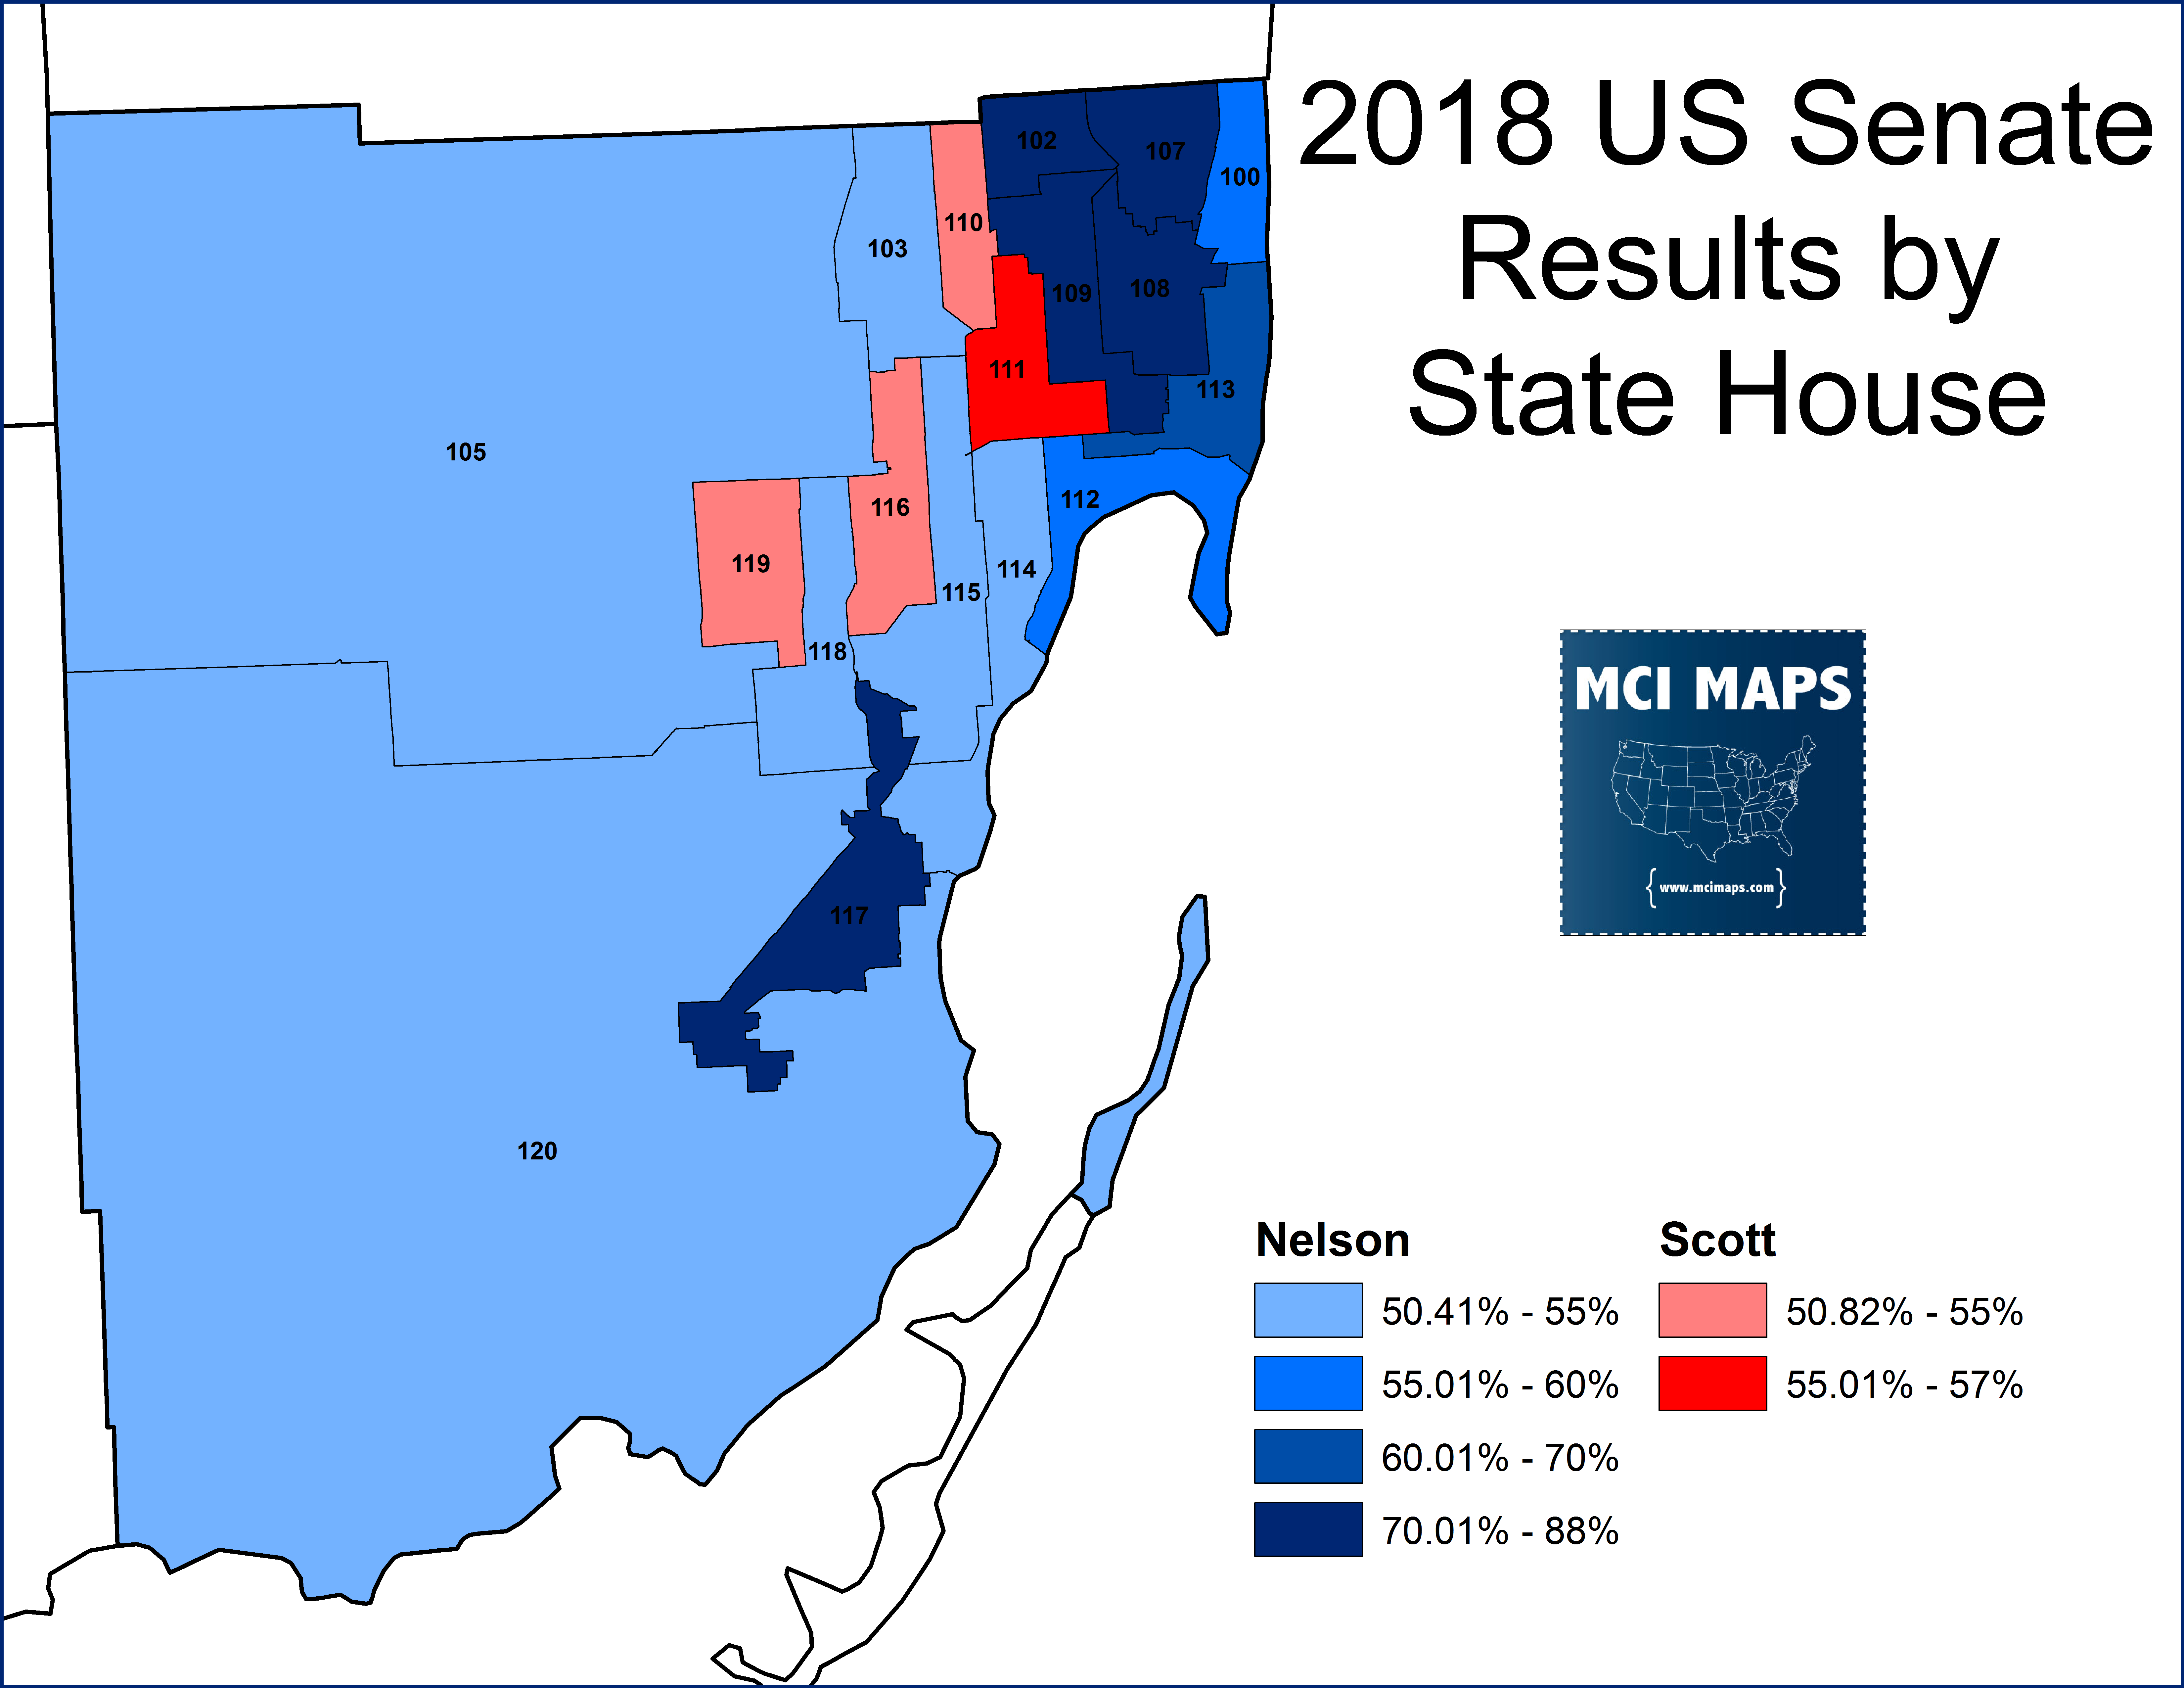
These turnout disparities also conform with the election results in those districts. Clinton was the first Democrat to win all state house seats in Miami-Dade, but several flipped back to the GOP this time. Turnout and Trump’s issues both contribute to this.
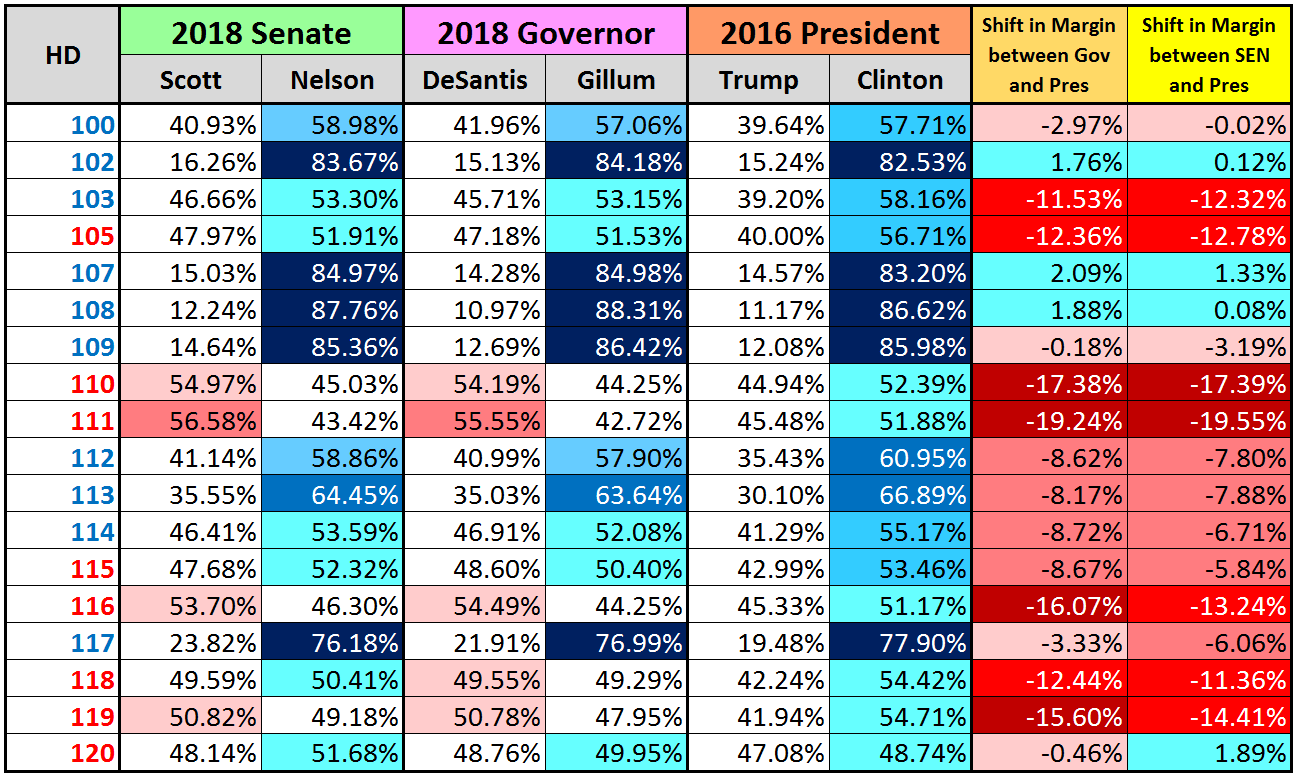

These statewide results had effects down-ballot as well. Democrats often under-perform further down the ticket, especially as the GOP runs Cuban or Hispanic candidates. Think of it like West Virginia, where many democratic state lawmakers sit in districts that Trump, Romney and McCain easily won. The same ticket splitting can occur here. However, this cycle saw many open seats and Democrats hope to make some gains. However, things did not go especially well. Democrats pickup up the open 103 (they actually lost the Dade portion but dominated in the part thats in Broward) but saw one of their incumbents (who narrowly won in 2016) lose. Their effort to take 115 and 105 also fell short, though they did hold 114, which they had picked up in 2016 and held in a 2018 special election.
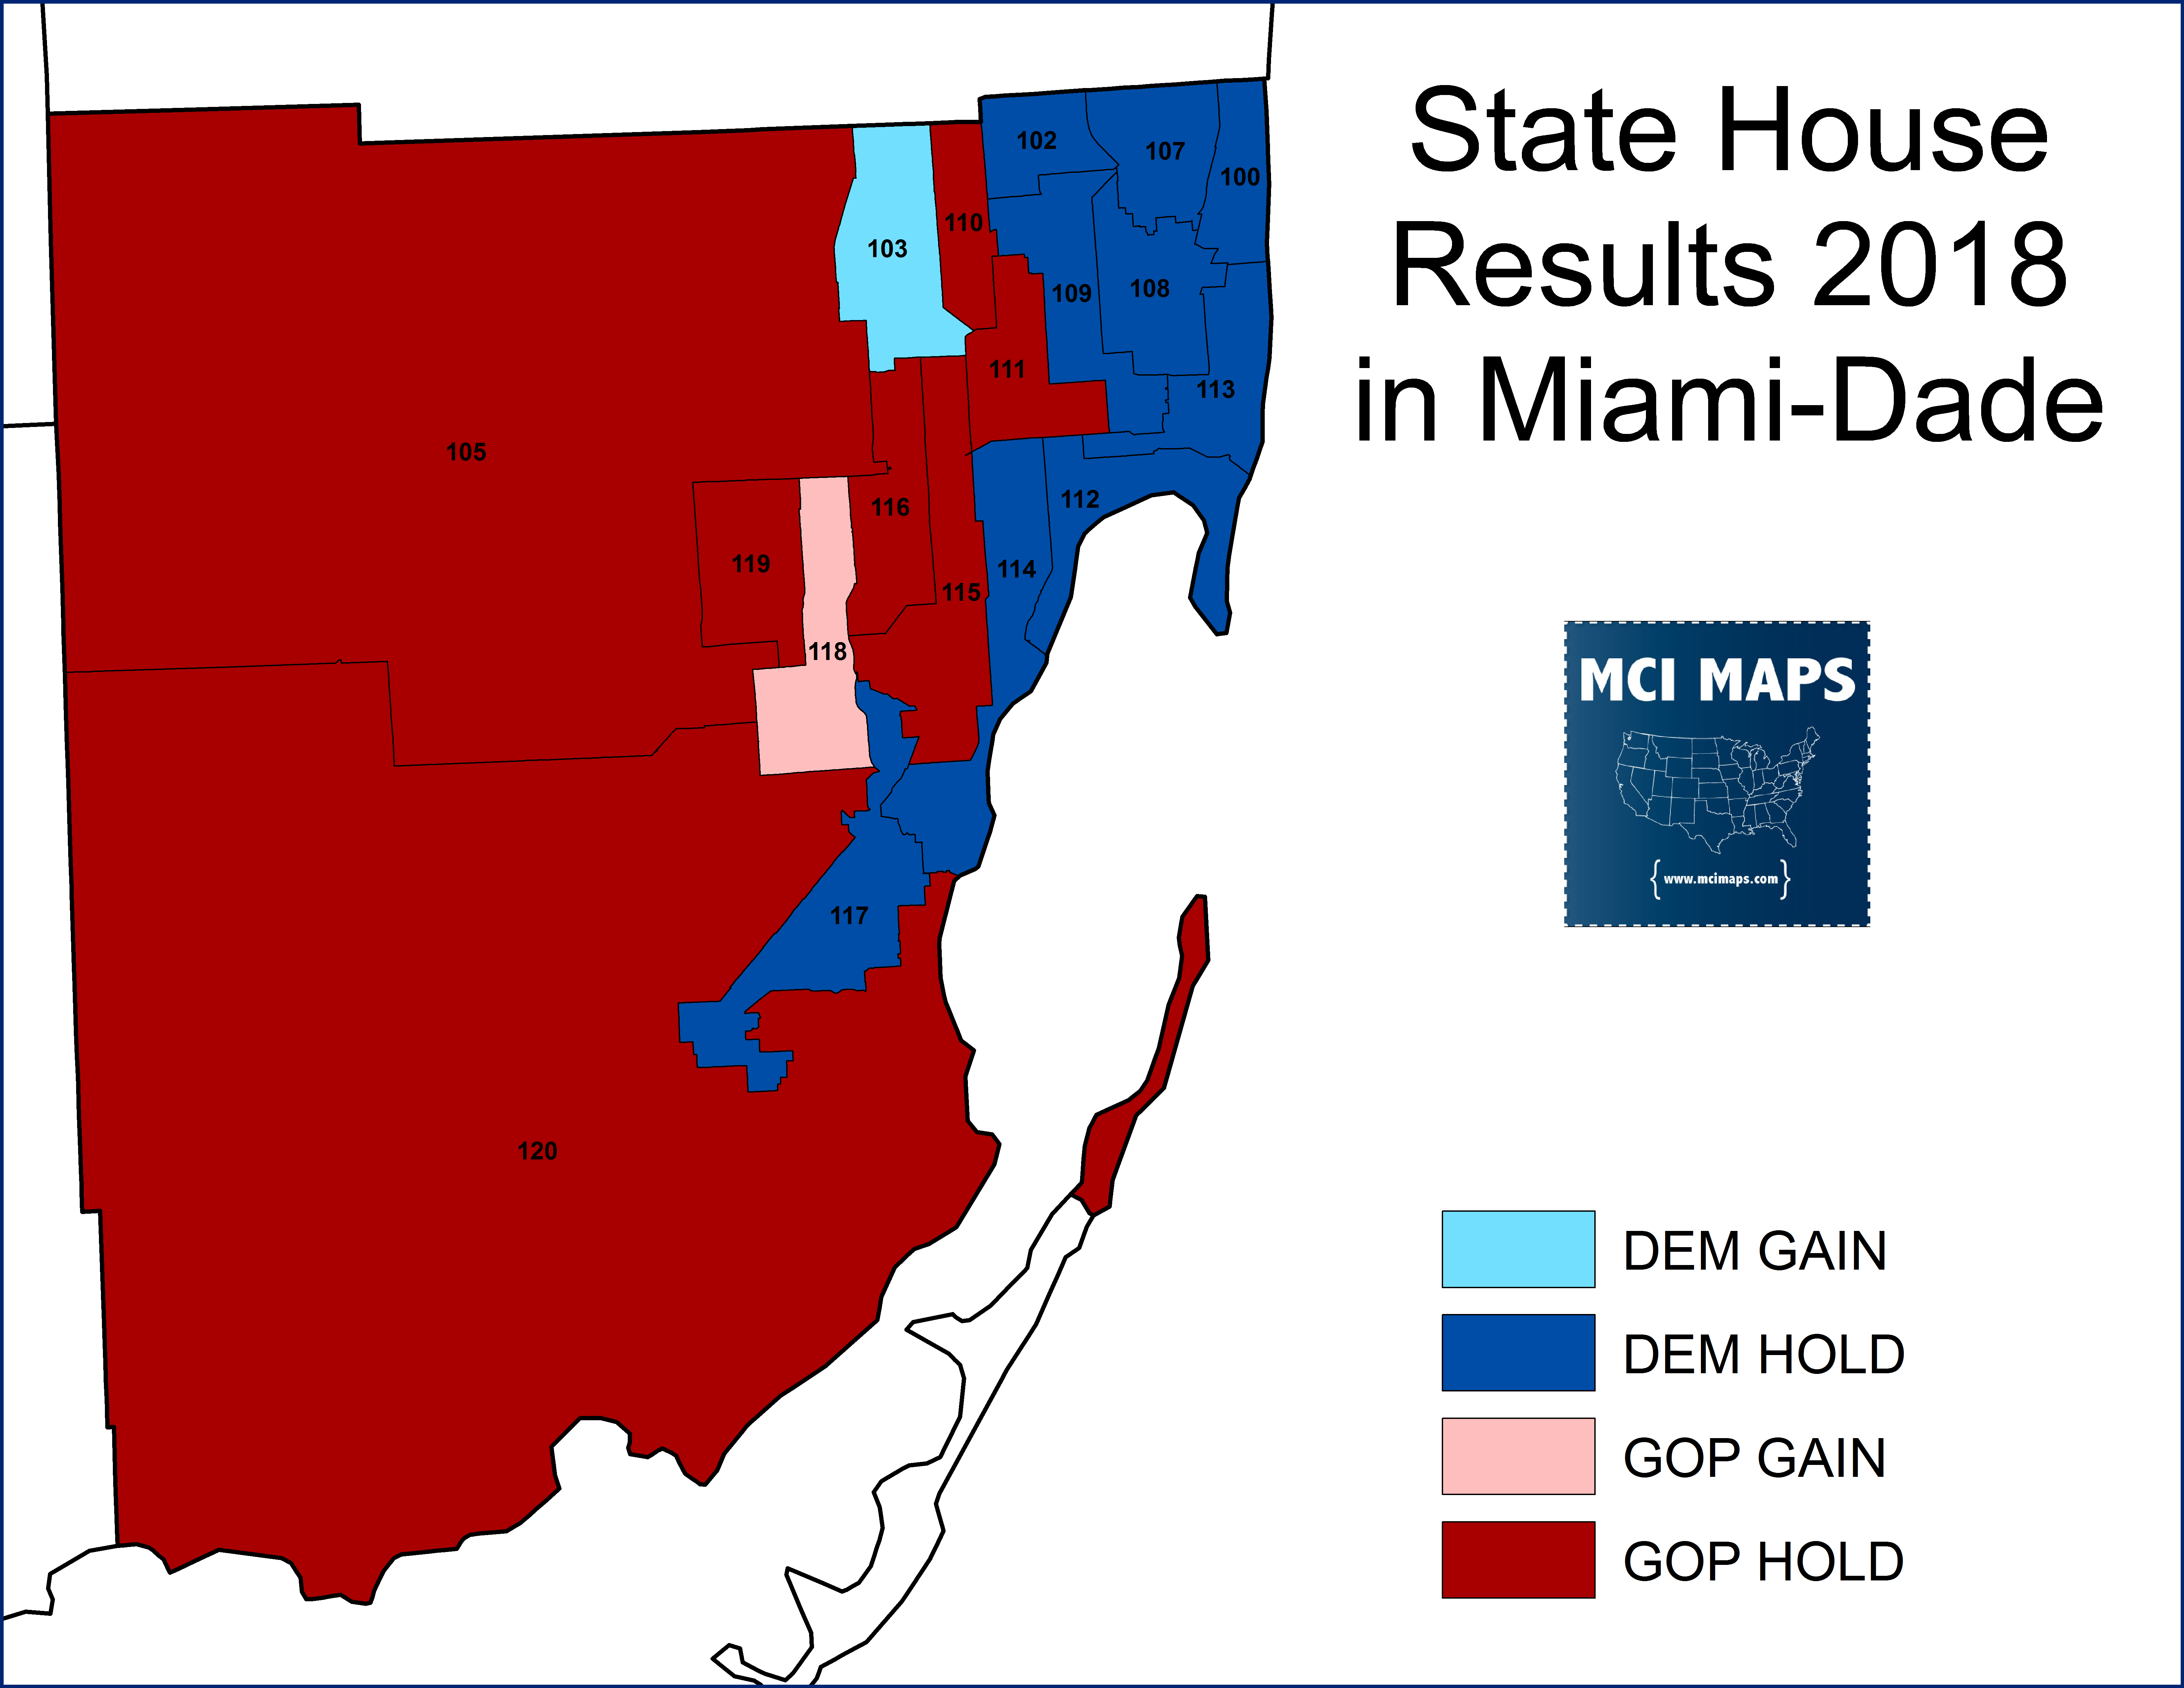
Districts 105, 120, and 115 all have Republican representatives despite backing Nelson and Gillum, while 118 backed Nelson but not Gillum.
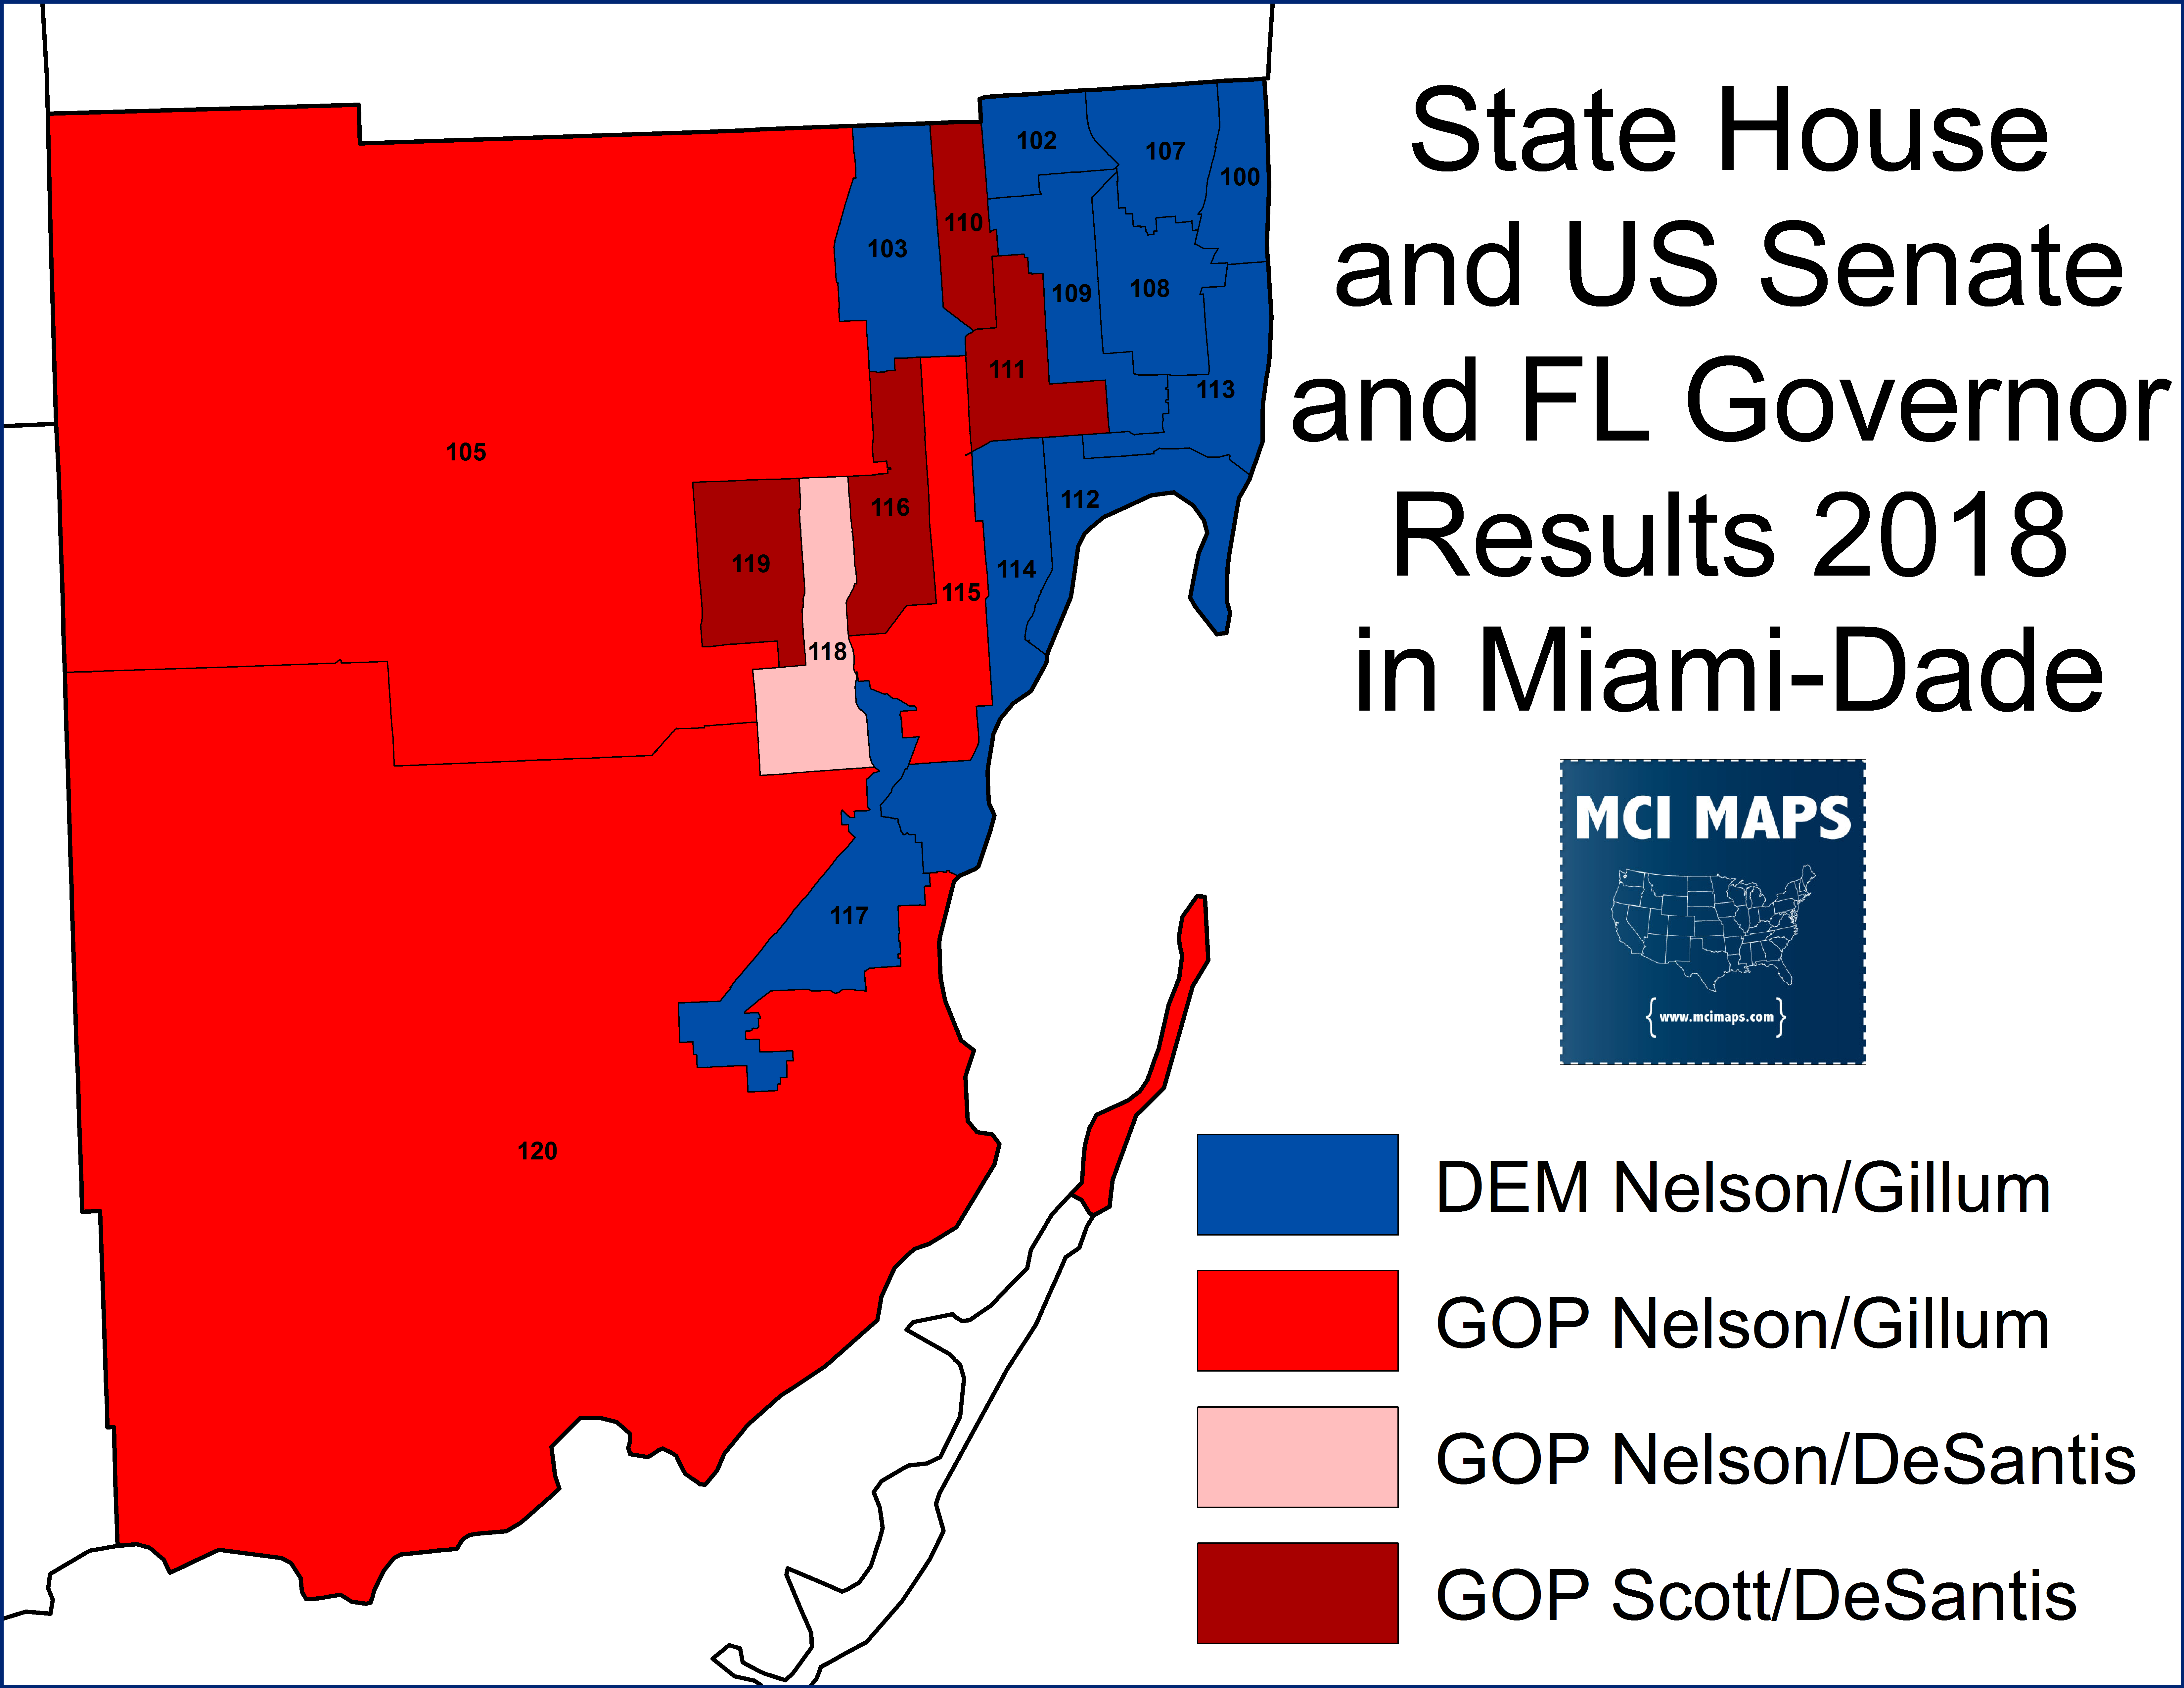
The modest statewide wins in these districts didn’t help down-ballot Democrats. There is almost always a down-ballot drop for state leg democrats in Dade, so bigger wins were likely needed. The registration of who’s voting also matters a good deal here as well, and these districts saw boosts for the GOP as a share of the vote cast. And these shifts mattered – as Democrats came within 1-2% of winning 105 and 115, and lost 118 by 3%.
Conclusion
Miami-Dade is a very unique county in Florida and the nation. Politically, it is the exception to many rules regarding race-based voting. The Cuban dynamic, which is changing as the years go on, means Miami-Dade must be the constant source of investment for Democrats. Turnout among the younger Cuban and overall non-Cuban Hispanic population is critical for the party. Older Cubans vote regularly and they are still solidly GOP. Heading into 2020, Democrats need to recreate the 2016 margin as much as possible while boosting turnout with their registered voters. Democrats were always going to suffer a drop in percent from 2016, but the size was too large and that cost Gillum and Nelson their races.