The United States is in the middle of a nationwide Christmas Tree Shortage; a result of under-planting during the Great Recession. You may have felt this when going out for a tree this year: being stung by higher than normal prices or finding your favorite lot out of trees. Areas that rely entirely on imports, like Miami, have seen lots run of of stock weeks earlier than normal. These shortages and prices are likely to last another year or two. Christmas Trees take 7-10 years to grow so we are right in the middle of harvesting trees that would have to have been planted during the recession; when collapsing prices and tight finances resulted in less planting being done. In a few years we are expected to move out of this shortage in supply. So all this drama begs the question: where do your Christmas Trees come from?
The Supply States
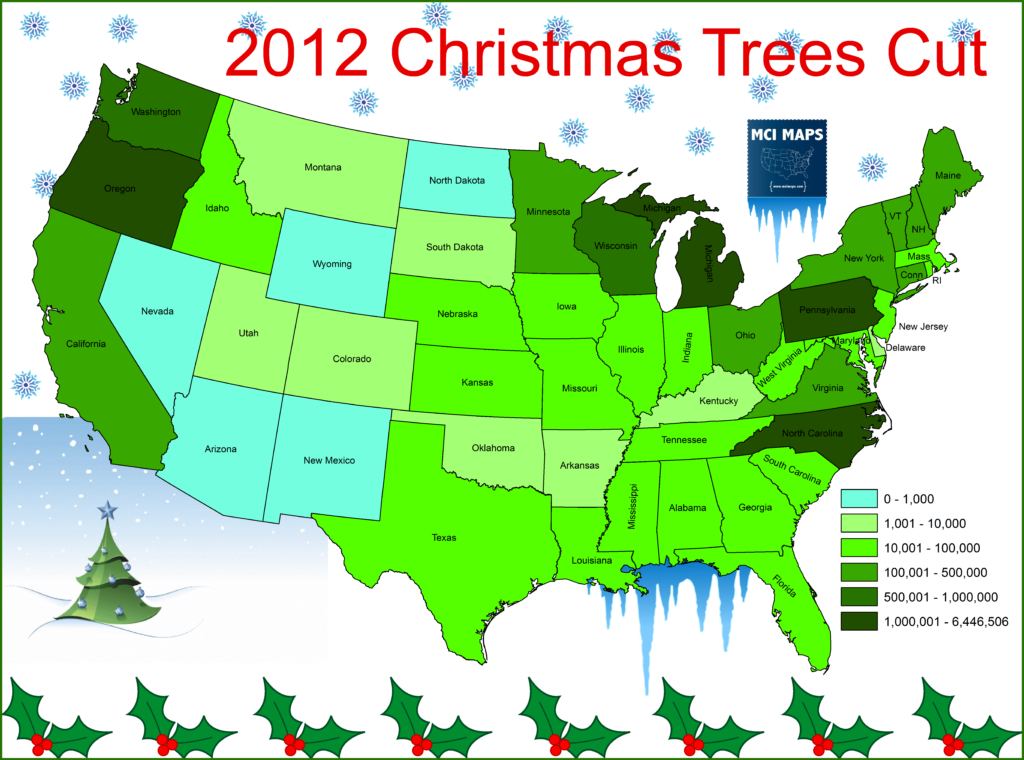
One memorable line from one of my favorite Christmas Movies: “Home Alone 2: Lost in New York.” was Kevin’s mom insisting they could decorate a Palm Tree since they planned to spend Christmas in Florida. This always confused me as a child. What were they talking about? I LIVED in Florida and we always had a normal pine tree we bought from a lot. For those of you who wonder… no we don’t decorate palm trees. I mean, some people do and cities like to. But your average FL family has a pine tree in their house. Like most states, we get them from a lot that gets them from another state. In fact, four states: Michigan, Pennsylvania, Oregon, and North Carolina cover around 75% of the nationwide Christmas Tree supply.
I don’t have year-by-year data, but the Agriculture Department maintains a 5-year census of production and harvests. The most recent data is from 2012. The map below shows the number of trees cut (harvested) for sales by state.
As it shows, almost all states have Christmas Tree production, but a handful of states make up the bulk of those that were harvested in 2012.
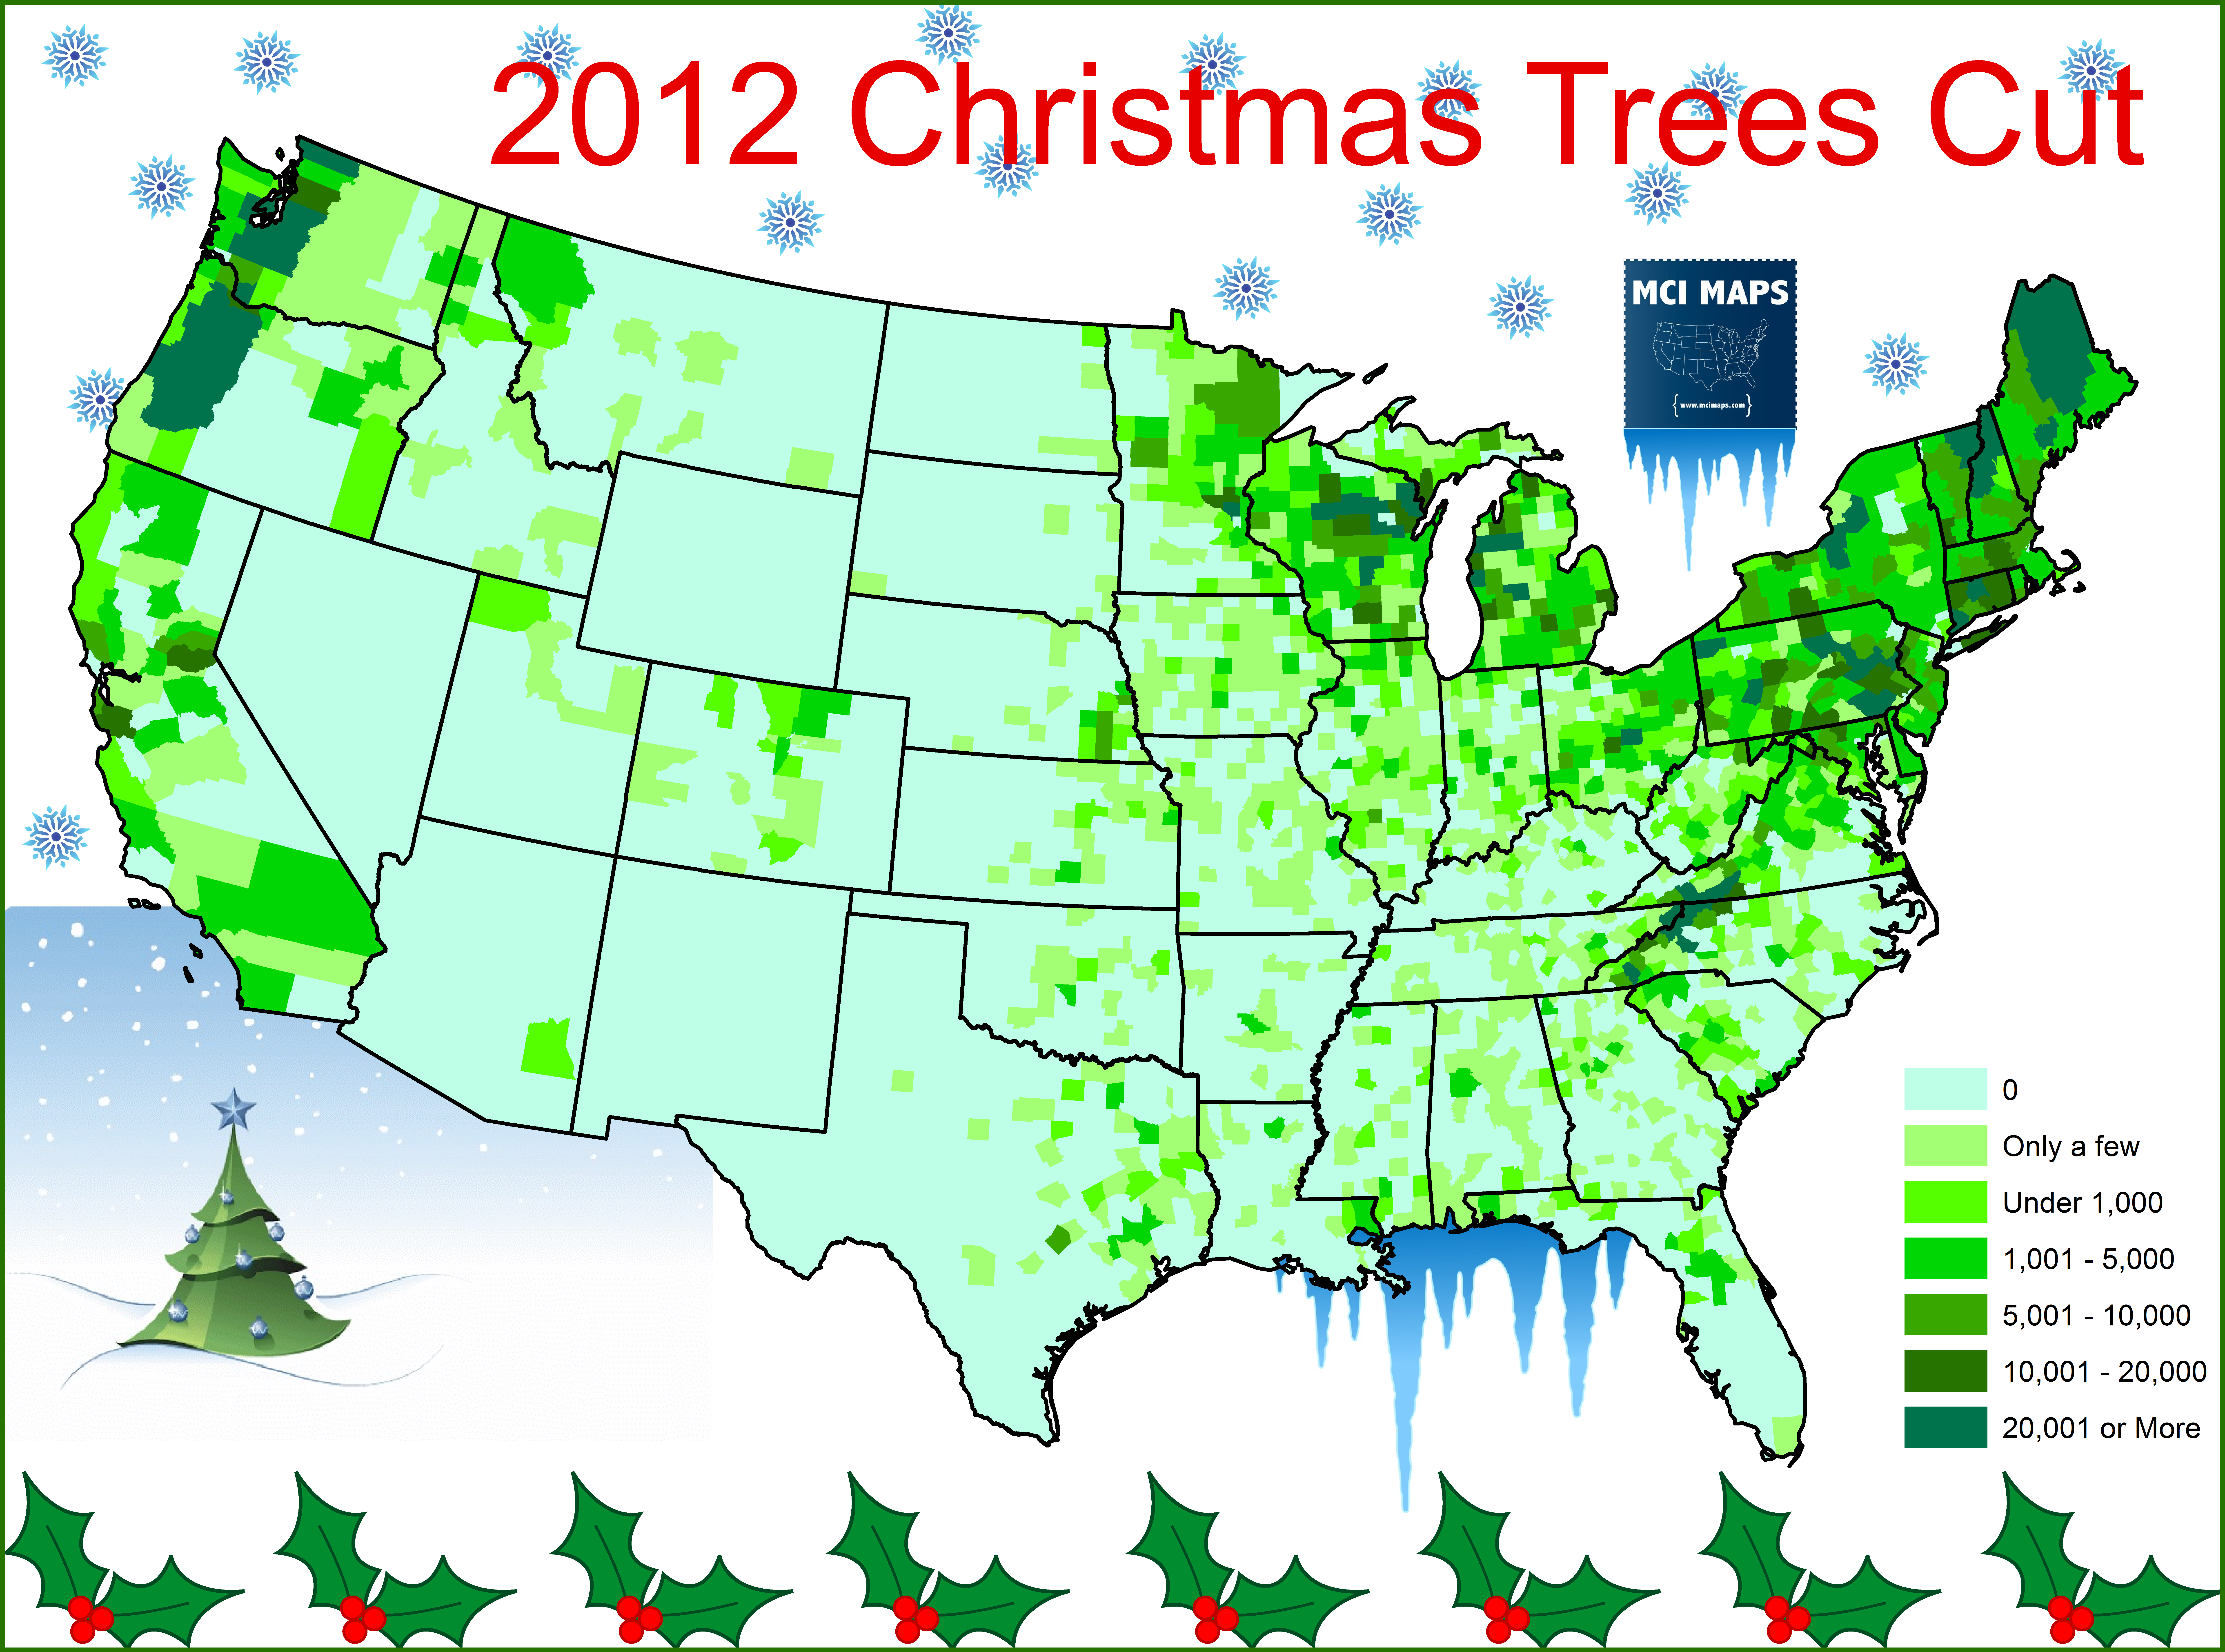
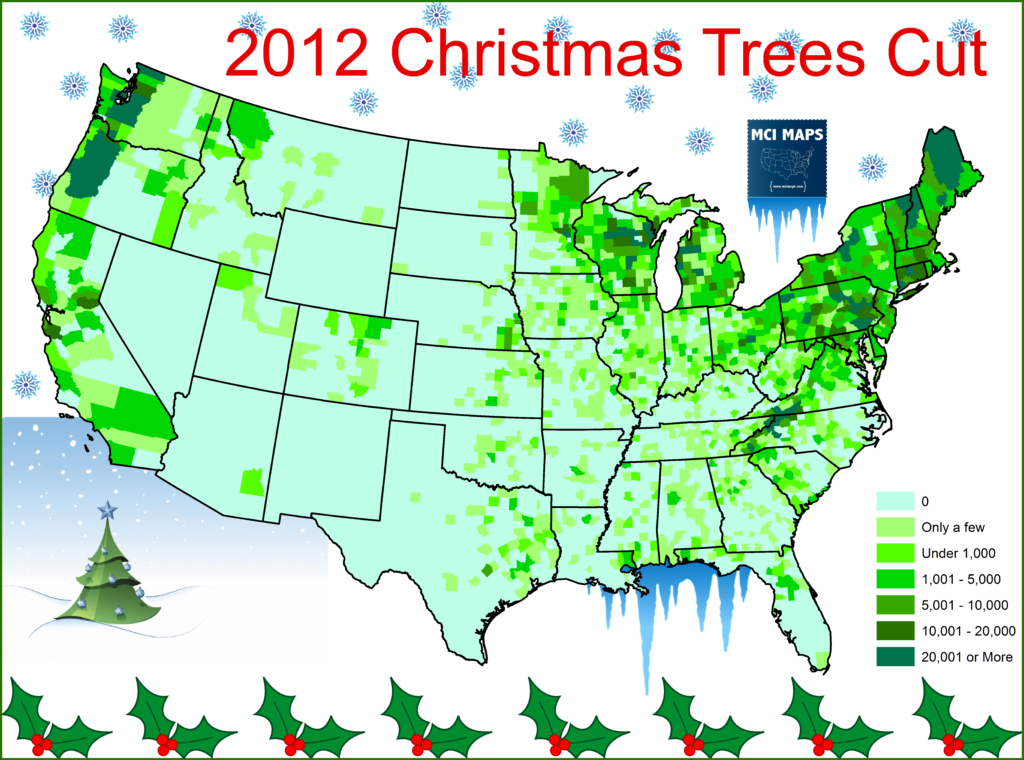
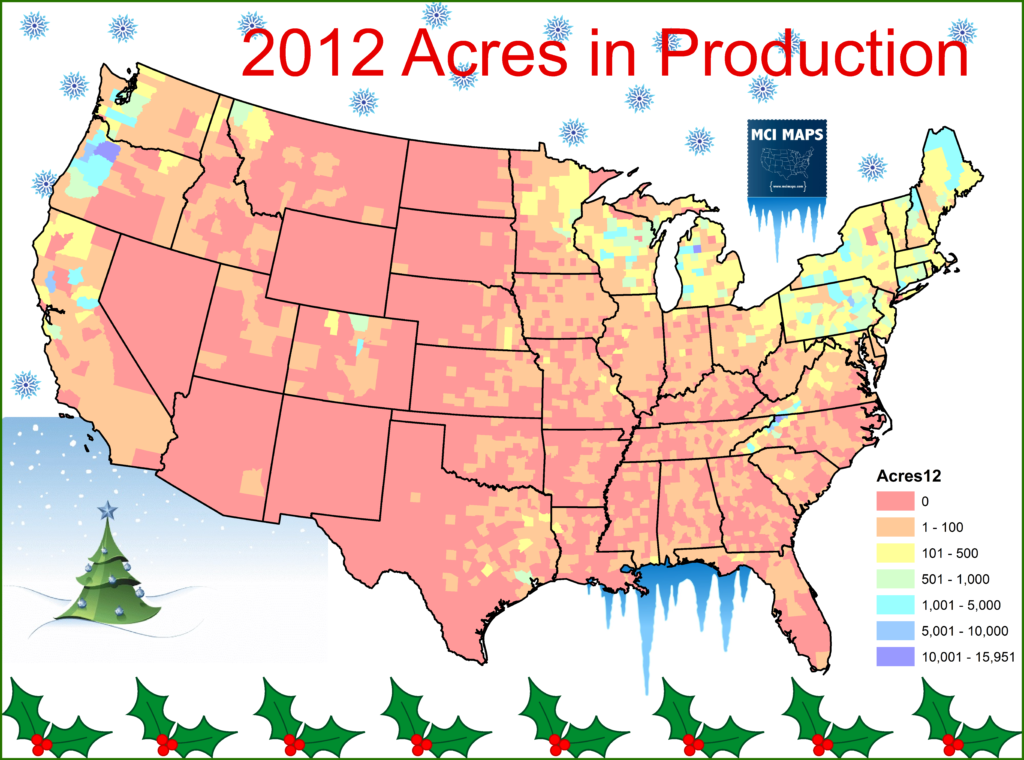
Break this data down by county and we see specific regions of states are responsible for the supply while many counties have little or no effect on the supply.
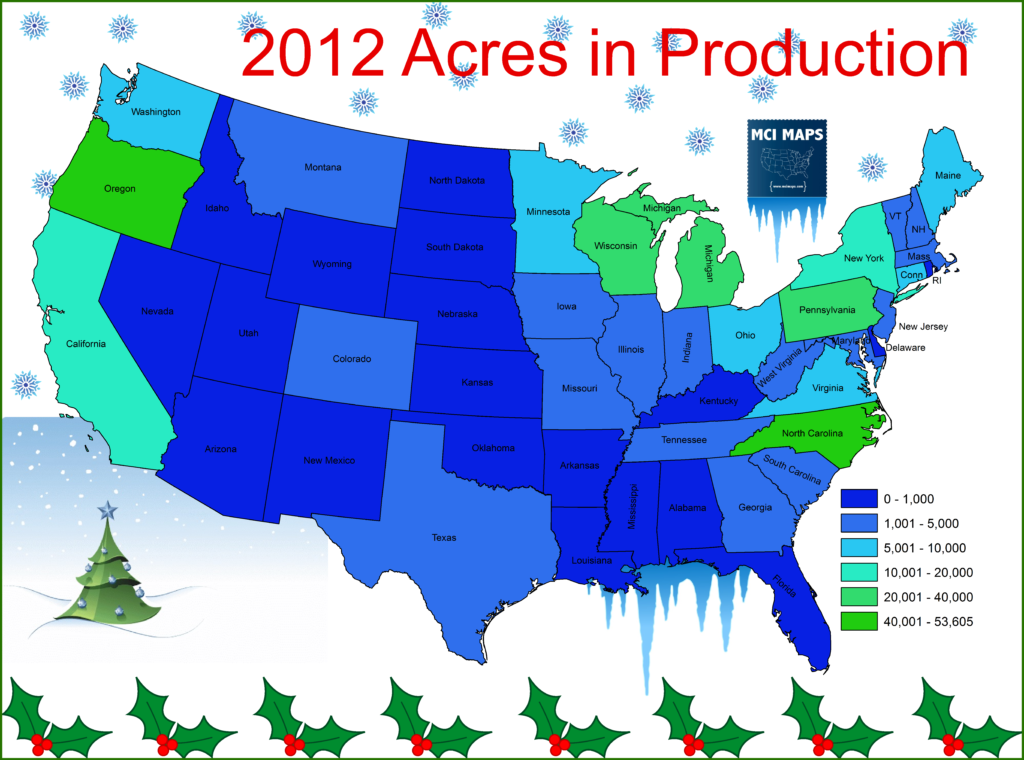
The 2012 data also provided current acreage in production, laid out specifically for Christmas Tree farms. This means active acreage being used to grow these trees. The states with the most acreage correspond with cut tree data.
The county map again highlights that specific parts of states: like Western Oregon, Midwest Michigan, or Appalachia North Carolina, make up the bulk of the states’ Christmas Tree operation.
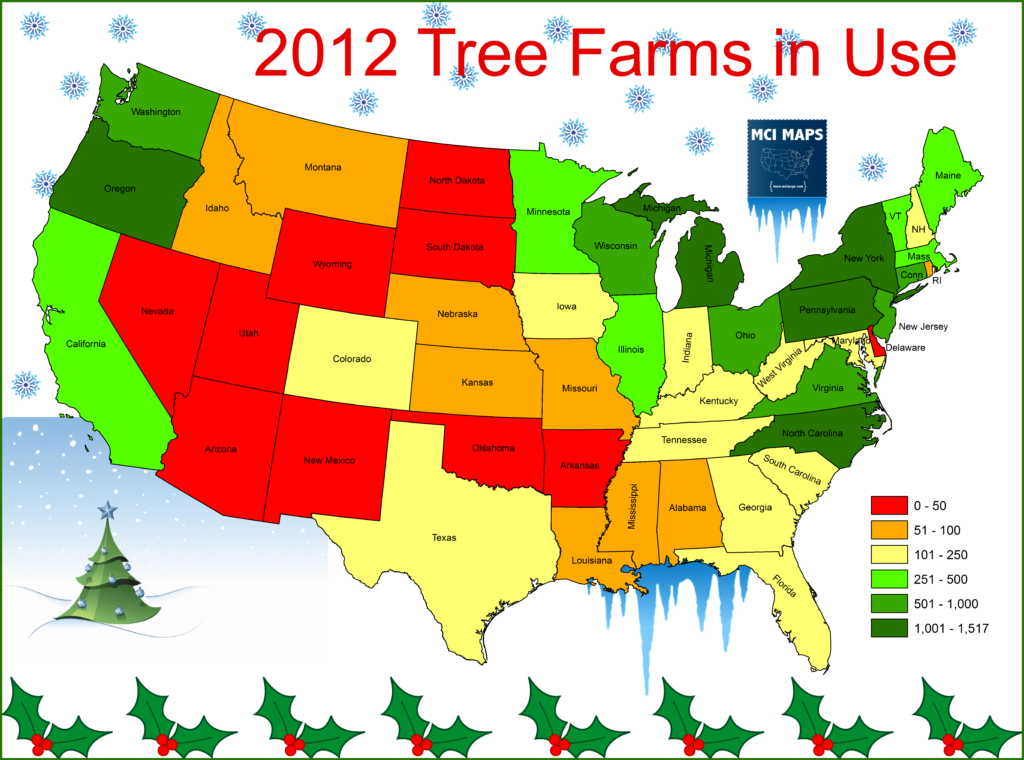
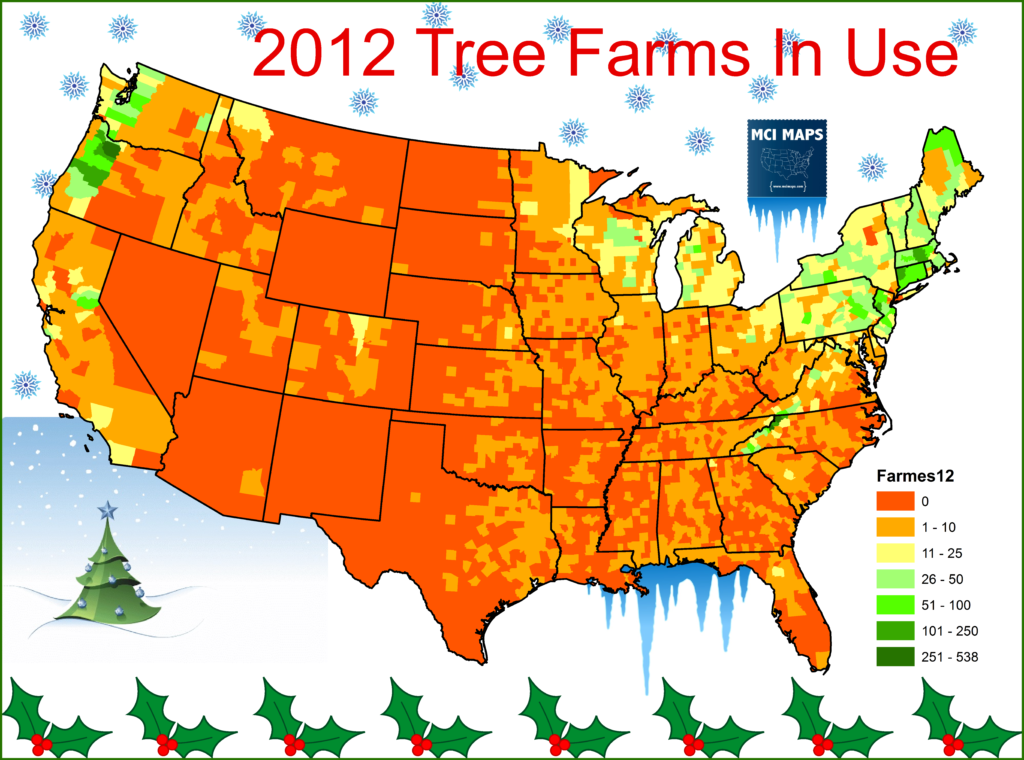
Data on the number of farms is also available. One caverate is the size of the farms is not included. For example: New York has the 3rd most farms but is 6th in acreage being used.
Overall the different data points say a similar story: while Christmas Tree farming exists in much of the US, a handful of states control much of the supply and production. Even in those states, it is specific regions that are heavily clustered with farms and tree harvesting. Overall the Midwest, New England, and Pacific Northwest have the most tree production occurring.
Shifts in Production
In addition to 2012 data, the Agriculture Census had 2007 (pre-recession) data as well. Between 2007 and 2012, around 40,000 fewer acres were in production – which is about 60 square miles. This would definitely mean a drop, as a tree farm can grow 1,500 trees per acre!
That means 40,000 less acres equals 60,000,000 fewer potential trees!
That sounds crazy and way too high to be right, but think about it this way. In 2012 and 2005, around 17 million trees were harvested. Trees take 7-10 years to grow… so you need a constant rotation. That means 10s of millions of trees growing at once to keep the supply constant. A reduction of 40,000 acres of production in 2012 is being felt now as trees are available for cutting. We won’t have new census data for some time, but when the report comes out it will show fewer trees were cut this year, a reflection of the reduced acreage in production years back.
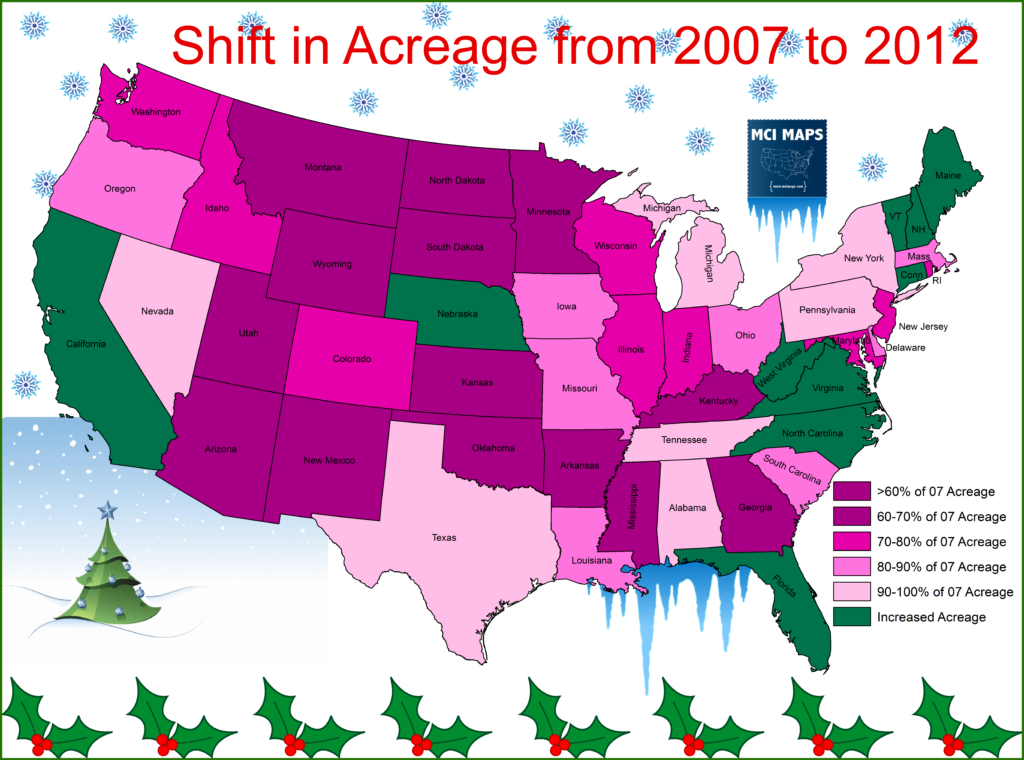
That shift in acreage by state is below. Most states saw acreage decrease, including most of the big suppliers of trees. However, most of New England and North Carolina saw their acreage in production increase.
I can’t say why this is, I just don’t have the data: in some cases its small numbers to begin with (like Florida) but North Carolina’s increase is notable. North Carolina passed Michigan to get the title for 2nd most acreage in production, with Oregon being #1.
Conclusion
We still have another couple years before prices fall on trees as supply increase. However, all indicators say supply will meet demand in the next Christmas or two and prices will fall as a result. As for next year: don’t delay on getting that tree.

