This article is part of a series I will be conducting on the 2016 Democratic Primary.
The Real Reason the Southern States Backed Clinton
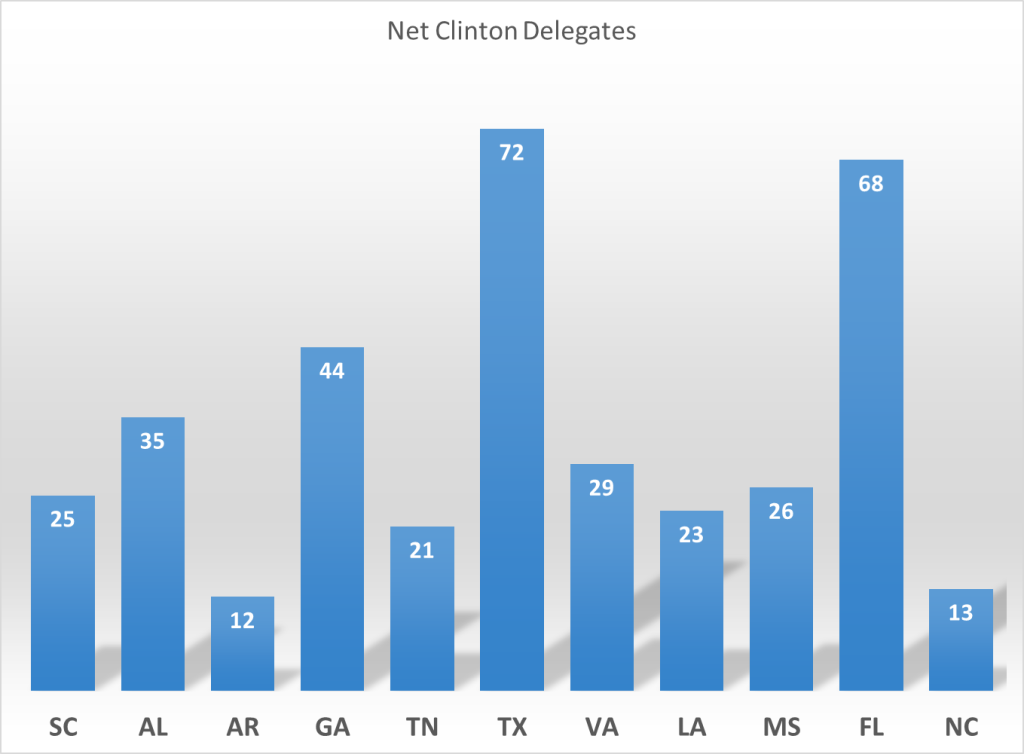
Hillary Clinton was always considered the front-runner for the Democratic nomination. Sanders proved a much stronger opponent than anticipated in 2015, and by early 2016 his campaign was looking for an actual pathway to the nomination. However, any pathway to a majority of delegates in all likelihood closed after the southern primaries delivered major wins to Hillary Clinton in March. South Carolina came first, giving Clinton a punishing 45-point margin. Most southern states followed suit on the March 1st primaries, giving Clinton dominant wins. A handful took place after that, all going for Clinton. The losses put Sanders into a major delegate hole that he was never able dig out of, even with his wins in the West.
Delegate Dominance in the South
Defining the south is tricky at times, but for the sake of argument, lets count all the former Confederate states. Clinton netted 368 pledged delegates out of those states alone.
This net of pledged delegates is larger than any nationwide pledged delegate margin Clinton ever accumulated. Without the southern states, Clinton wouldn’t have a majority of the pledged delegates right now.
Sanders diehards joked about Clinton being the President of the Confederacy, and Sanders himself said the south voted that way because it was conservative. However, the argument that the southern primaries were chosen by conservatives does not line up with the data.
South Carolina Warning
There was not a single data analyst or prominent journalist that didn’t understand that the reason the South would be tough for Sanders was because of the African-American vote. Even as Sanders made inroads with whites, he was still struggling with non-white Democrats heading into the first round of primaries. I wrote about the situation back in January. Sanders first big test with the African-American vote would be in South Carolina. In the Nevada caucuses, Sanders had lost African-Americans badly, and a South Carolina shocker seemed very unlikely. However, South Carolina proved worse than expected, with Clinton getting 73% of the vote. Only 34% of the vote was white in that primary. Exits had Clinton getting 55% of the white vote and a staggering 86% of the African-American vote.
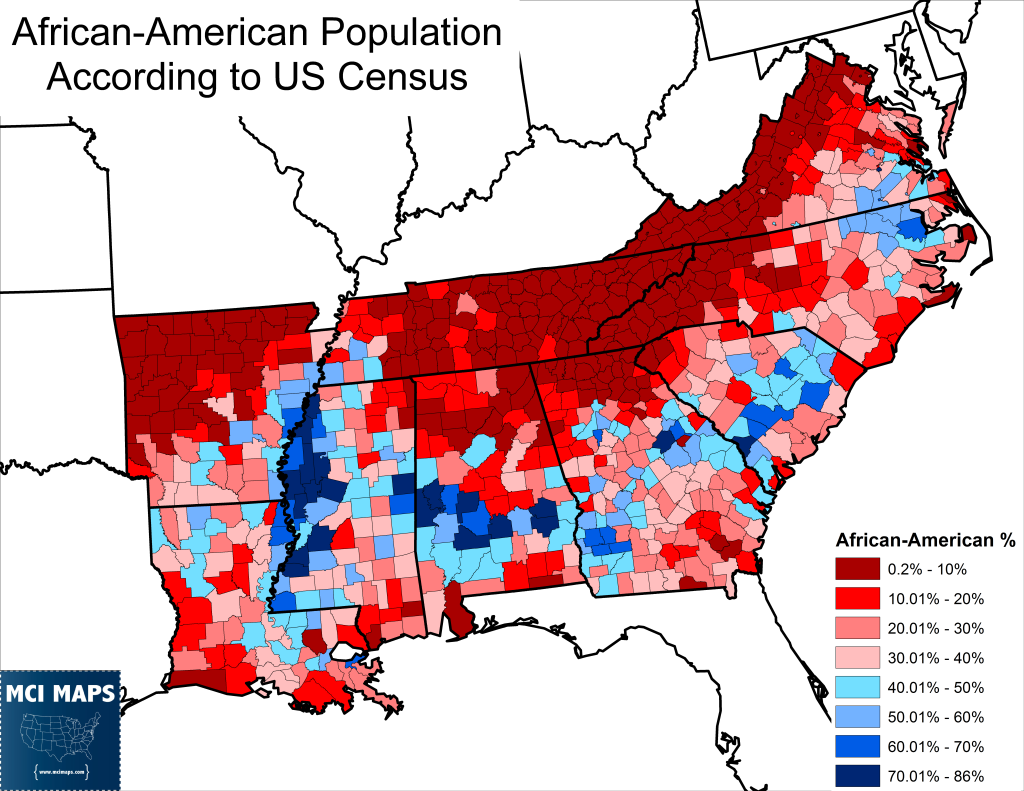
South Carolina was the first sign that Sanders was in trouble with African-Americans. Anyone with a basic understanding of American’s history and demographics knows that African-Americans make up a notable share of the southern population. The map below uses census data to show the concentration of the African-American population in the deep and upper south states (Texas and Florida will be looked at separately).
After South Carolina, the consensus was that Sanders would brutally lose the south if he couldn’t improve with African-Americans, which is eventually what happened.
A Less White Primary in the South
The census’ racial makeup for South Carolina is 67% white. However, only 34% of the Democratic primary in South Carolina was white. South Carolina is one of a handful of states to release its turnout data by race for free. Their figures showed that all but five counties in the state were majority non-white in the Democratic primary.
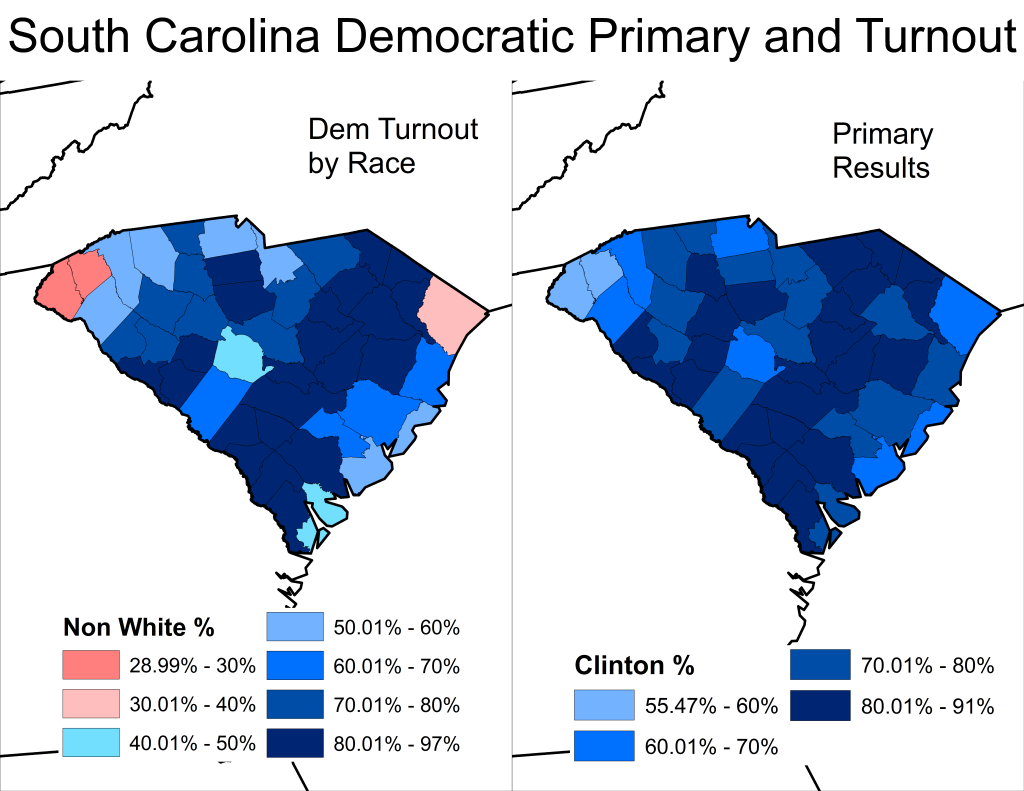
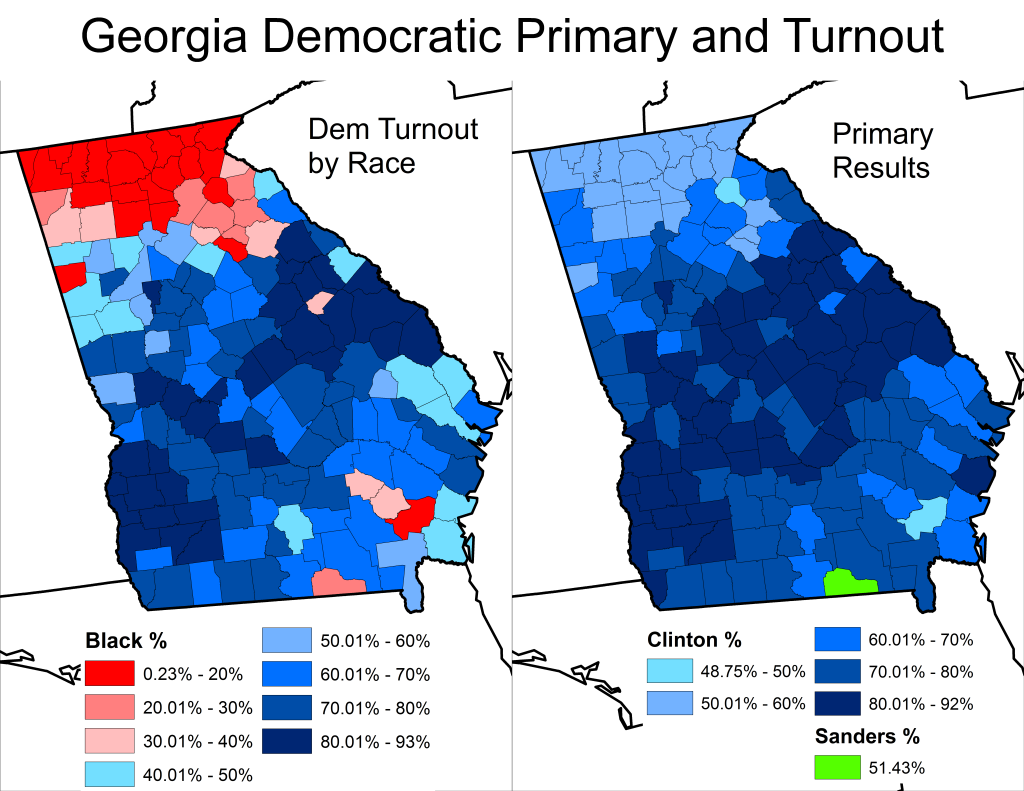
Not every state released its turnout by race. Some charge money for that data, others don’t do registration by race. Another state that does release that data is Georgia, which likewise showed a large minority vote. 59% of the Georgia Democratic primary was African-American, and Clinton ran strongest in counties where the African-American vote was largest.
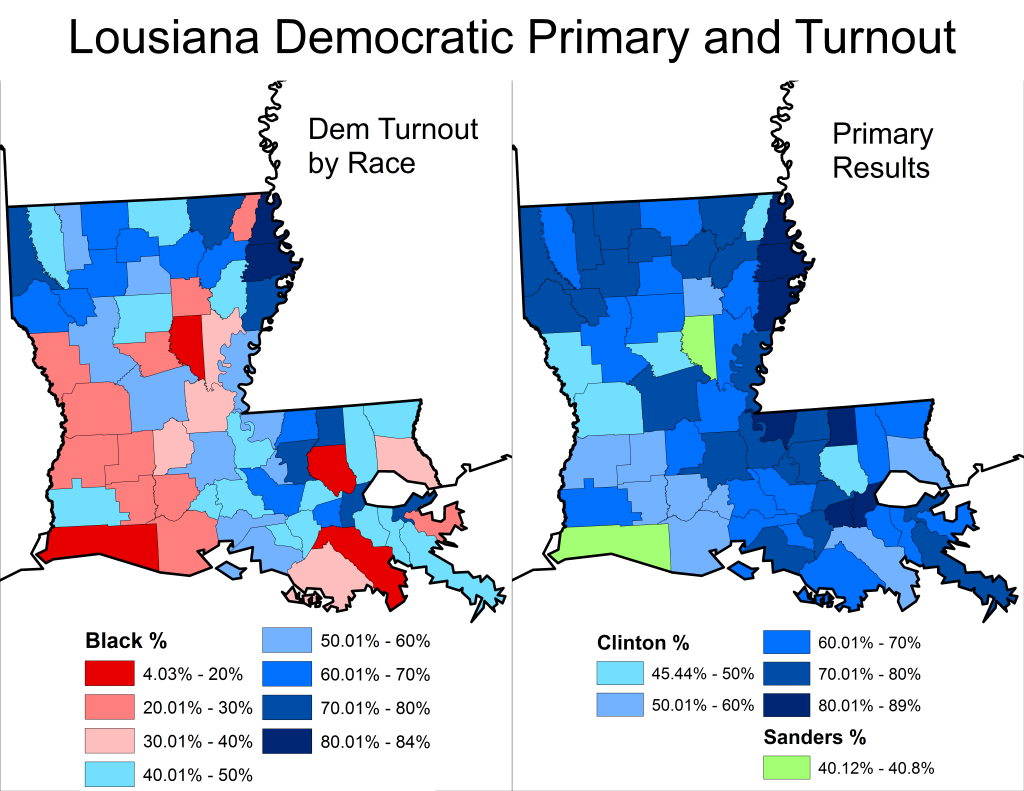
The same thing was the case in Louisiana, which was only 43% white in the Democratic primary, with Clinton again doing strongest in African-American areas.
Across the south, the white share of the Democratic primaries fell from 2008, leaving a primary electorate much more diverse.
White Conservative Defections
A key reason for this shift is that most of the southern primary states have open primaries, with most of them not even using partisan registration. When a voter in Mississippi, Alabama, Georgia, Tennessee, Texas, South Carolina, or Virginia registers to vote, they can’t even pick a party to register with. All of those states, in addition to Arkansas, have open primaries where voters could vote for the Democratic or Republican side. With conservative whites moving further away from the Democratic party, and much more likely to vote for the GOP nomination, this left Democratic primaries in the south much more liberal and African-American.
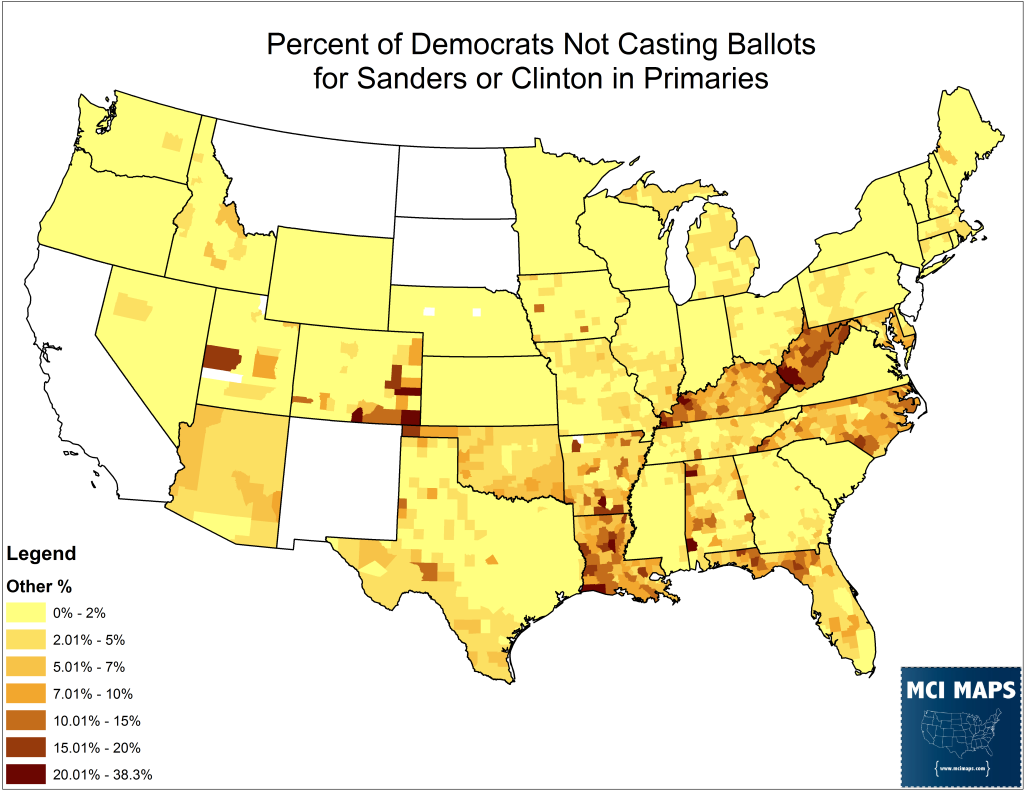
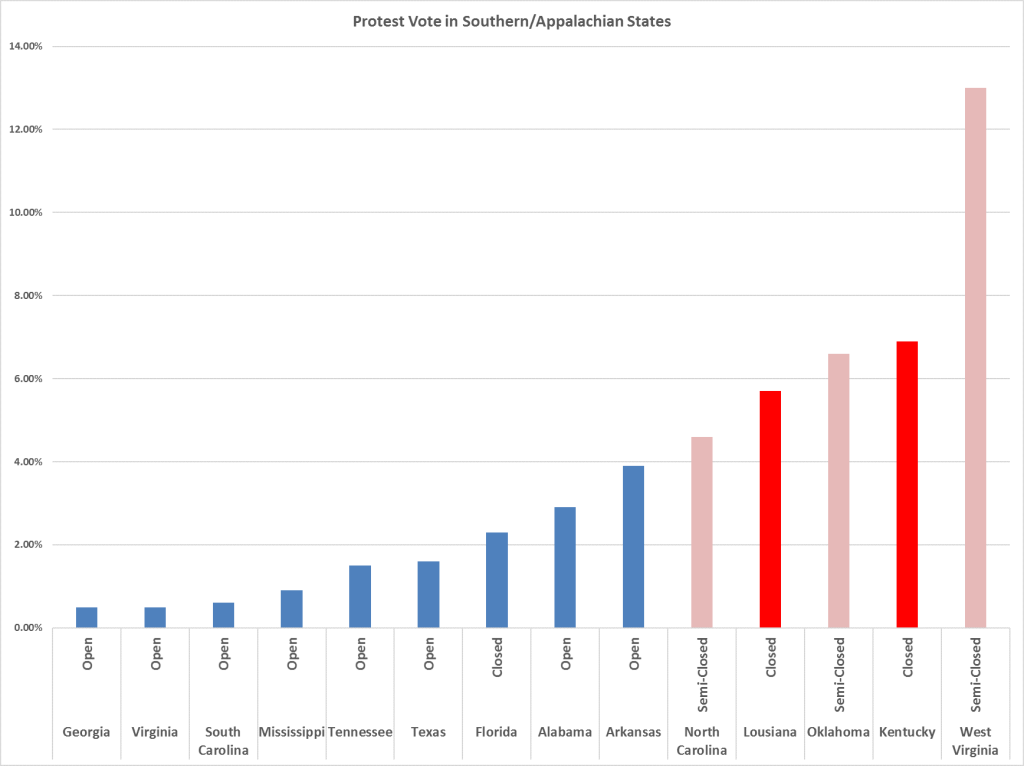
In cases where registered Democrats had to vote in the Democratic primary, conservatives cast protest votes by voting for unknown or withdrawn candidates. The protest vote was weak in most states, but jumped in parts of the south and in Appalachia.
Southern states with low protest votes used open primaries, giving conservatives the option to vote on the GOP side, thus lowering the protest vote. In fact, the four states with the largest protest vote (all in the south or Appalachia) did not allow registered Democrats to vote on the GOP ballot, hence resulting in a large protest vote.
Alabama and Arkansas had a decent protest vote despite being open. However, both states hosted their regular primaries the same day as for state/local offices. This likely shifted the figures as conservatives who wanted to vote Democratic for state legislature or local commissions (where there are still lingering conservative Democratic officeholders) didn’t like their Presidential picks.
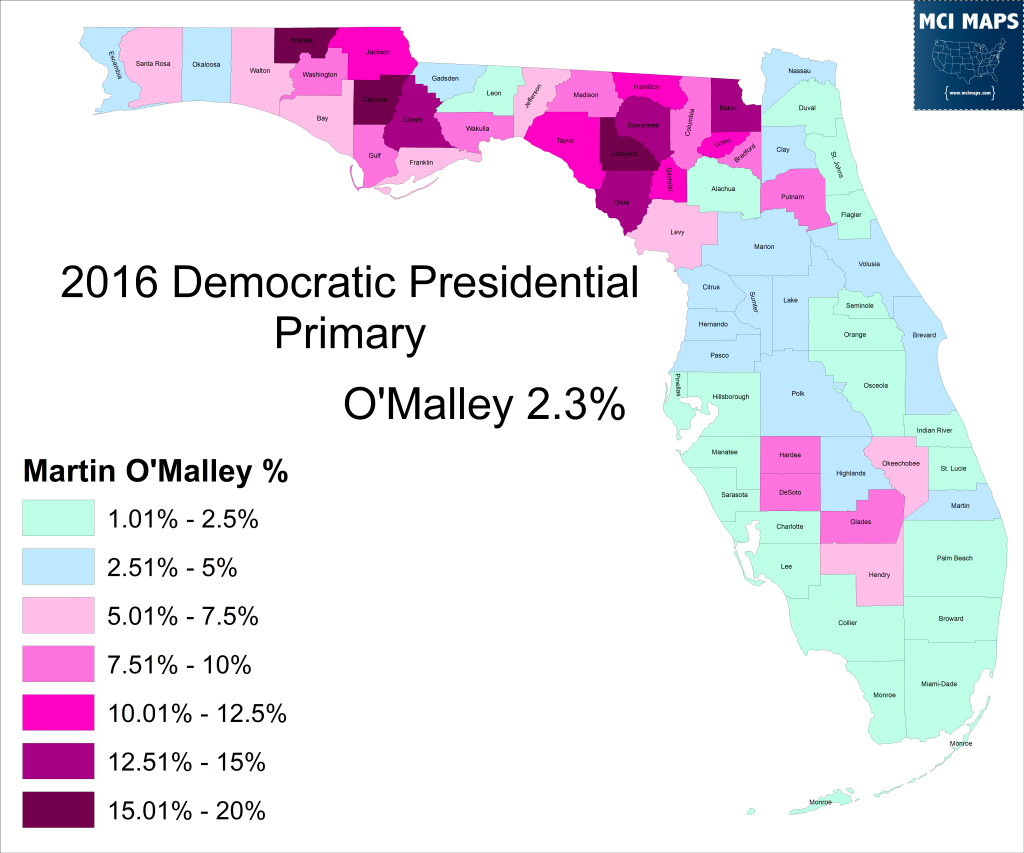
In Florida, the protest vote was small, but it was much higher in the northern rural counties where conservative Democrats still reside.
In states where conservatives were forced to vote the Democratic ticket, they often cast protest votes or left the ballot blank. In West Virginia, more Democrats voted for the Gubernatorial primary than for the presidential primary. There is also evidence in West Virginia that many conservatives voted for Sanders as a protest against Clinton. A similar dynamic exists in Oklahoma, where exits showed conservative Democrats backing Sanders over Clinton. In most of these southern primaries, the conservative vote was too small for exit polls to even get a good sample of voters due to conservatives opting to vote in the GOP primary when they had the opportunity.
Comparing to 2008
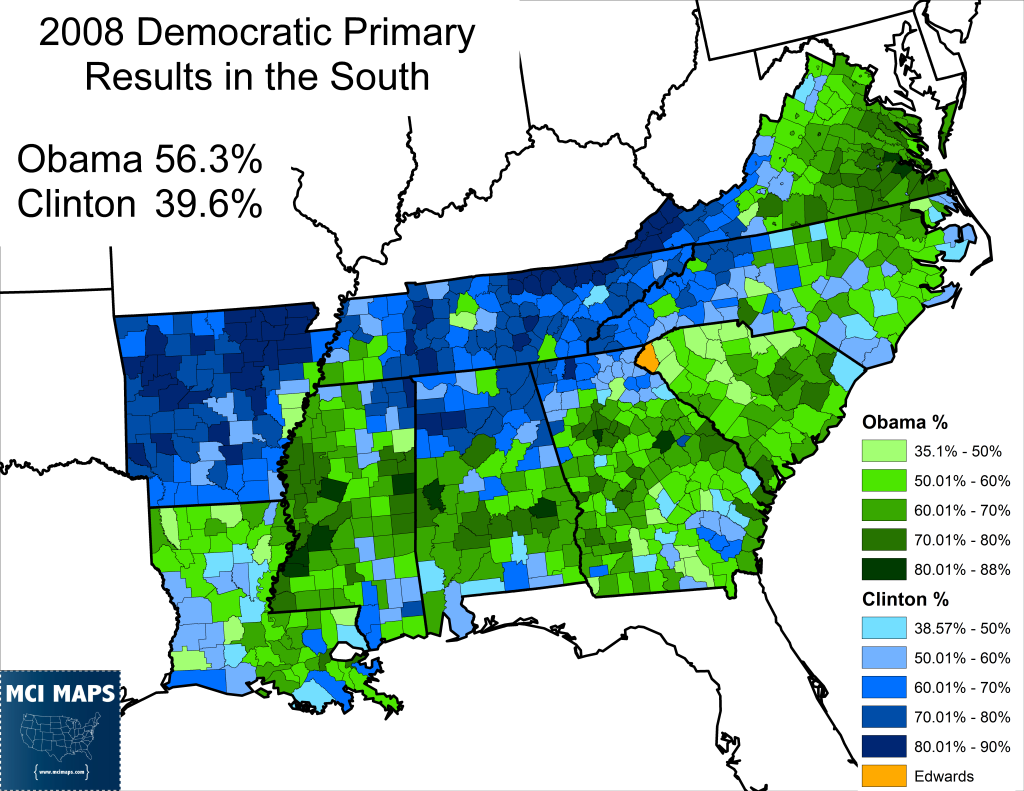
One common fact overlooked by Sanders folks saying Clinton won the south because it was conservative, is that Obama won most of these states in 2008. In the southern states (not counting Florida or Texas which I will address separately) Obama beat Clinton 56-39 in 2008.
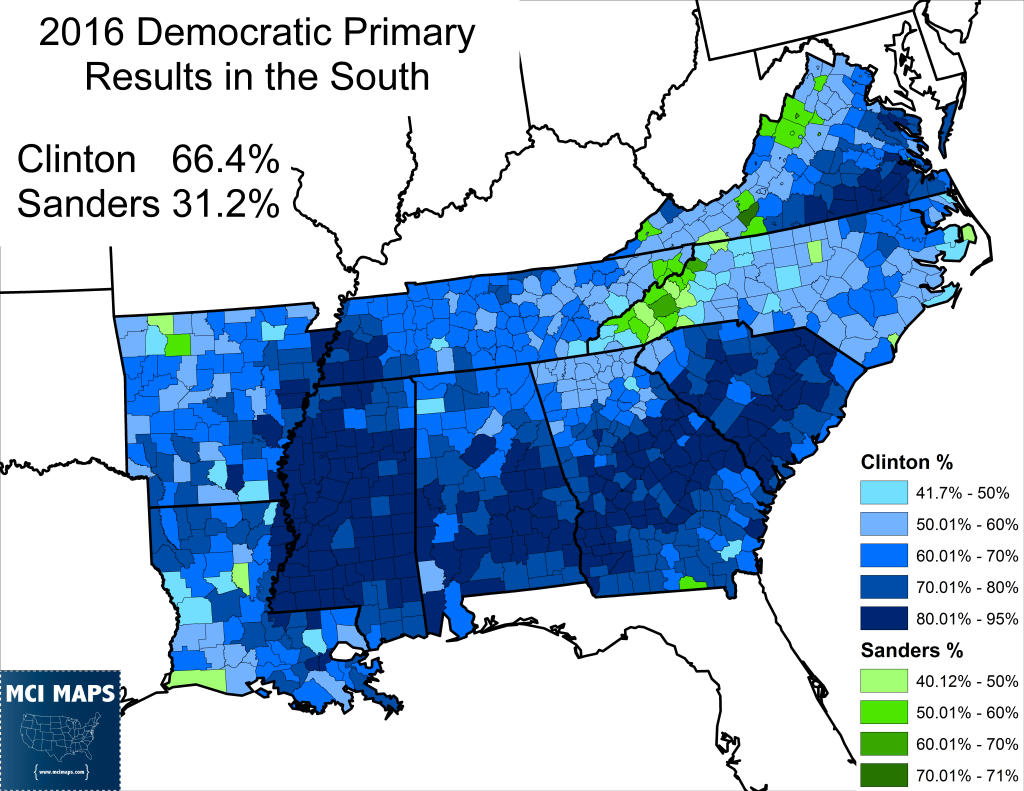
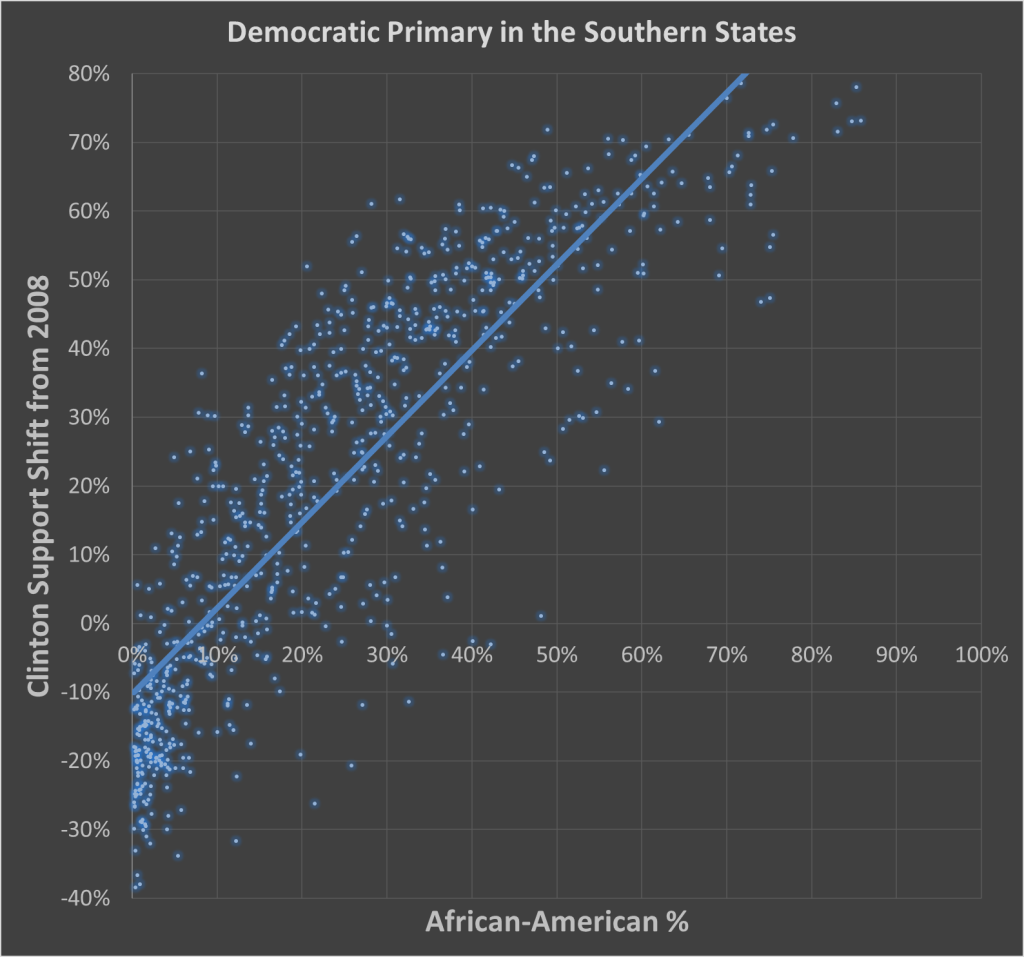
Obama’s county wins generally overlay with where a larger share of the African-American vote resided. That African-American share of the primaries rose from 2008 as white conservatives stopped voting in Democratic primaries. Clinton ran up a large margin with those African-Americans and more narrowly won the white vote over Sanders. In those same states this time around, Clinton got 66%.
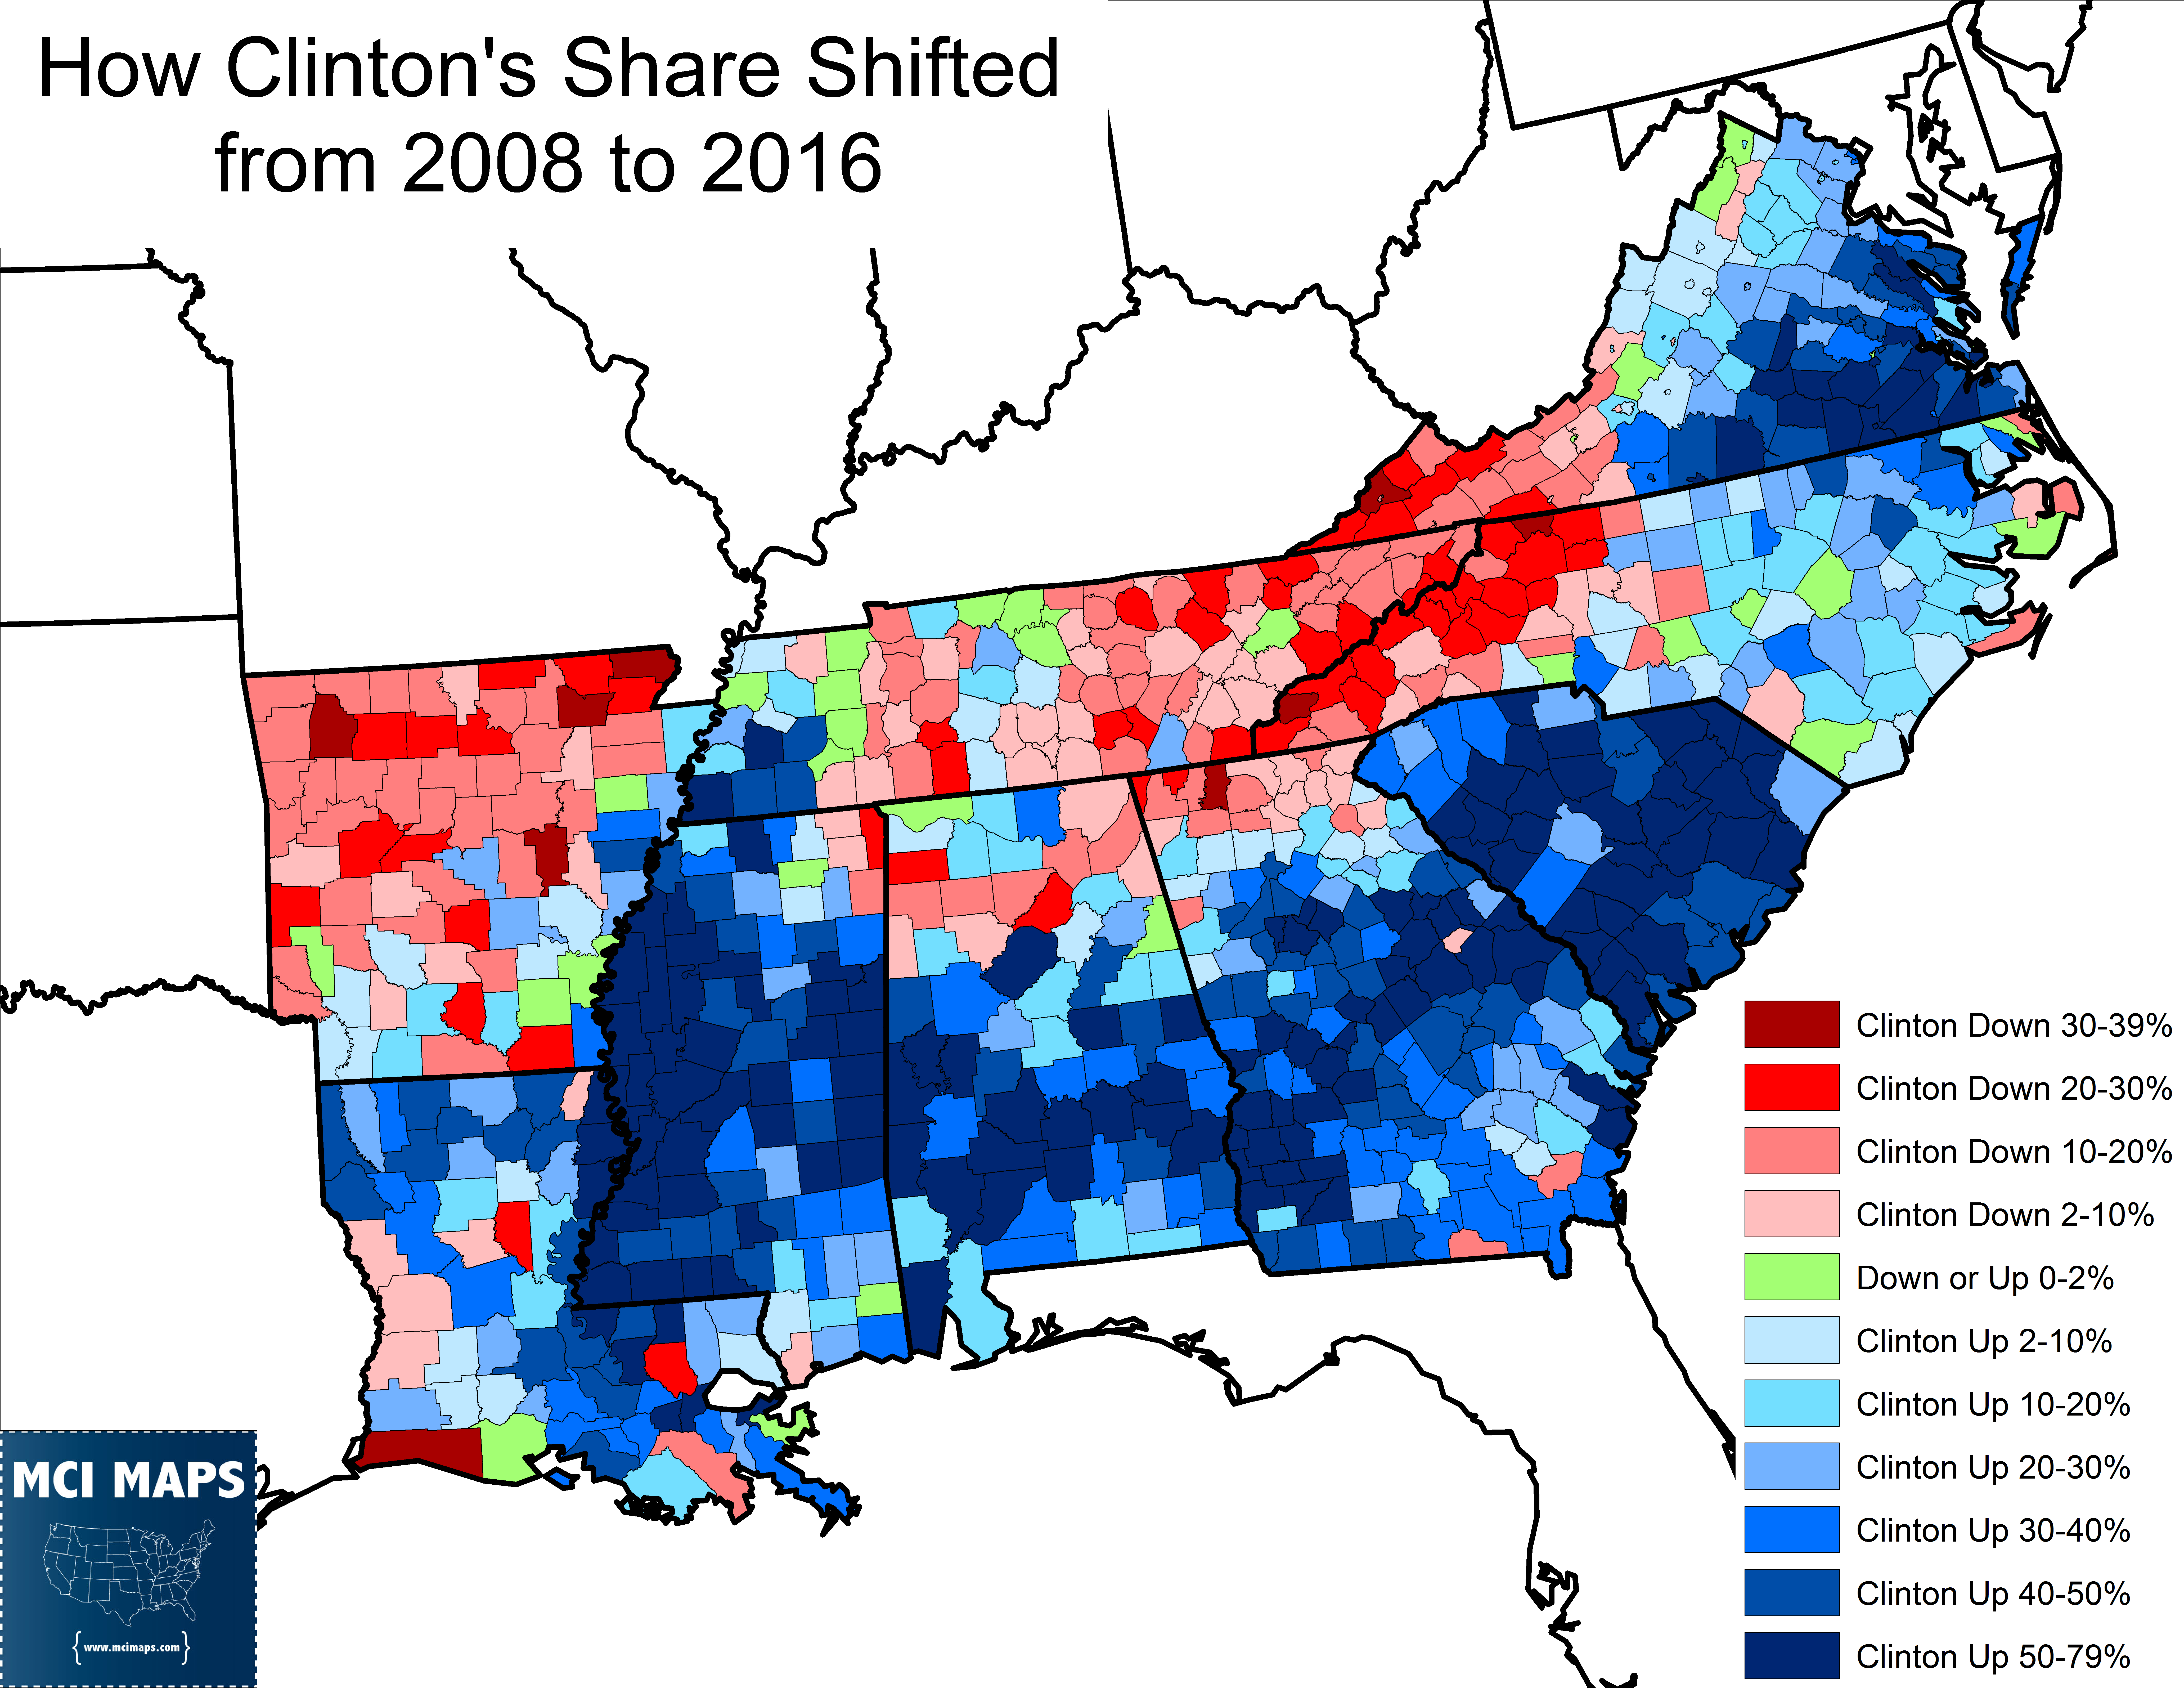
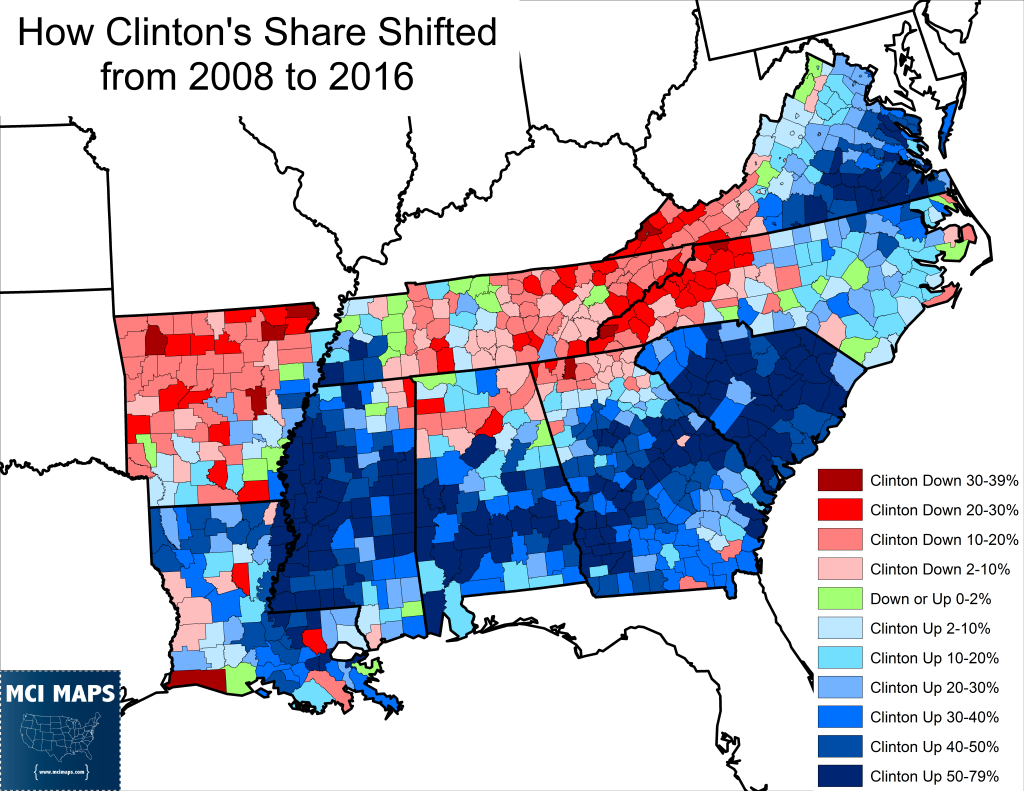
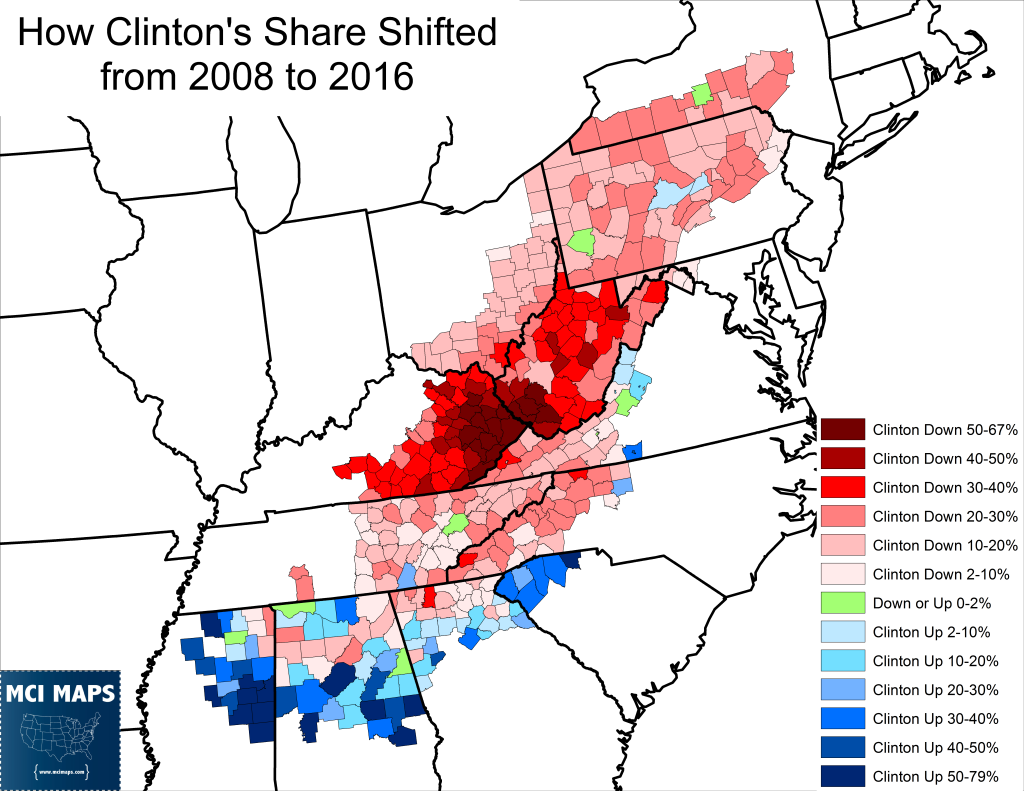
Clinton still won whiter areas in the southern states, but by much weaker margins than in 2008. The map below shows how her vote shifted over the last eight years.
Clinton’s vote share fell largely in white areas of the south while rising in African-Americans areas.
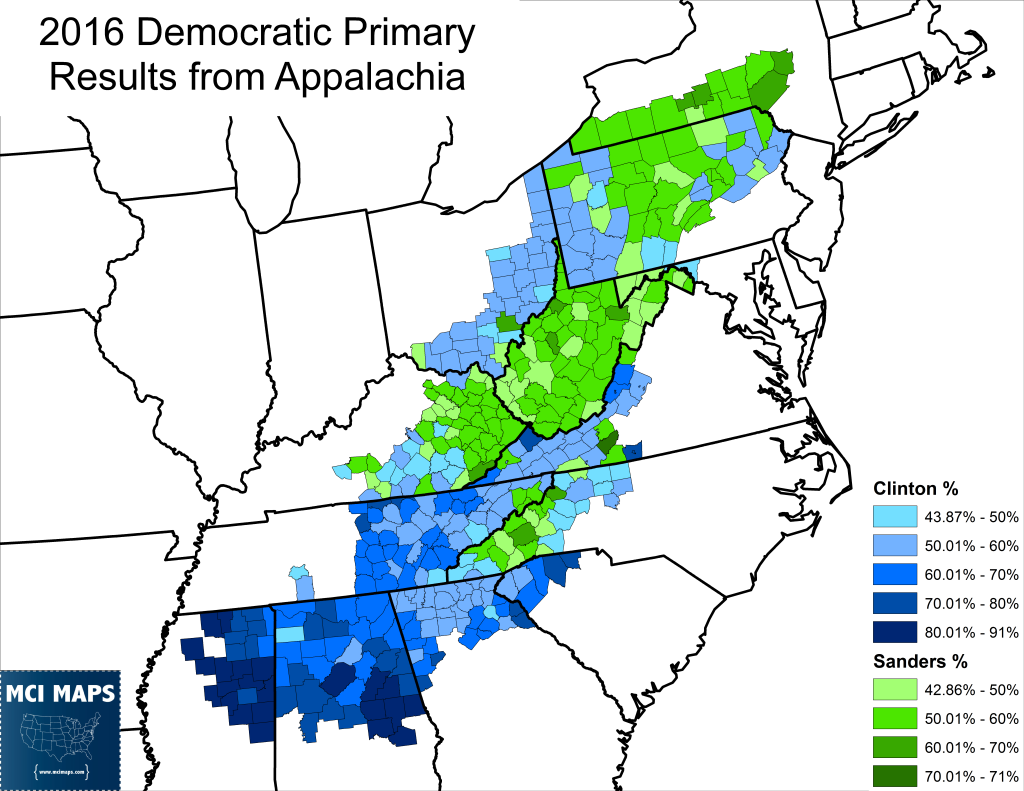
The whiter areas of the South that saw Clinton drop in support are part of a region known as Appalachia, a conservative, white region of the south that was notably one of the few areas where Obama did worse than Kerry between 2004 and 2008. A good deal of the region is also dominated by coal. Obama is very unpopular in that region due to race and economics (Democrats pushing for clean energy jobs). In 2008, Clinton dominated that region over Obama. However, this time was different as she ran as the successor to Obama’s legacy and that hurt her with conservatives in the area.
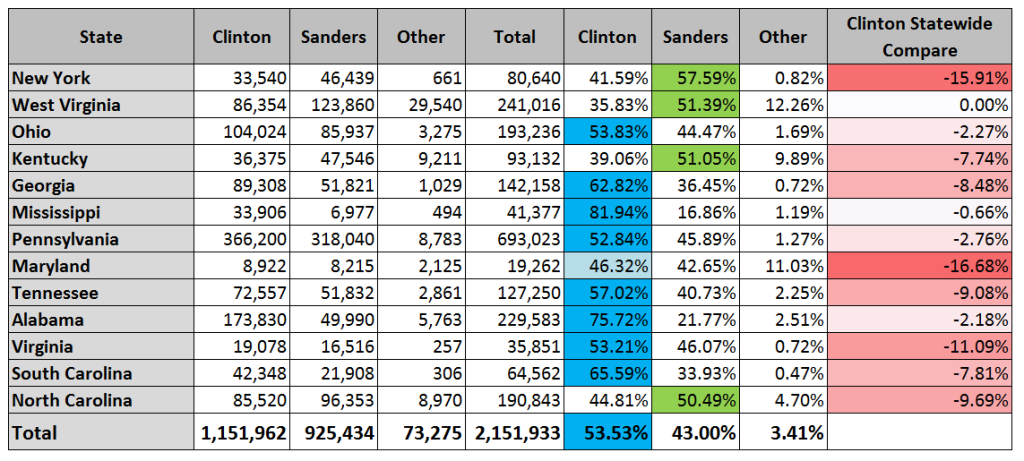
Appalachia is hard to define. For my part, I used the official county listings from the Appalachian Regional Commission. Another analysis by Stephen Wolf on DailyKos Elections defines the Appalachian vote using a narrower county selection. My selection found Clinton still winning the region, but by a much closer 53-43 margin.
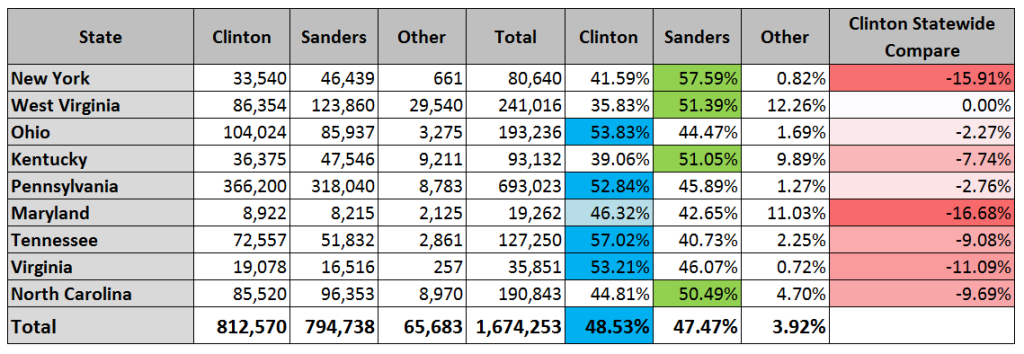
The chart shows the candidate margins in the portions of the state in Appalachia. Clinton notably did worse in the Appalachian portion of a state than her state-wide share.
Compared to 2008, Clinton lost ground in most counties, except in the deep south, and especially in the West Virginia and Kentucky coal counties.
The GA/MS/AL results are trickier because the open primary nature there allowed for the vote in those states to increase their non-white share of the Democratic primary. In Georgia, where the turnout data is available, the African-American share of that portion in Appalachia was still 42%, much higher than census figures. Alabama and Mississippi likely saw similar dynamics, but data is not readily available.
If we took out Alabama, Mississippi, South Carolina, and Georgia from this analysis, the vote between Clinton and Sanders in the region gets much closer.
When we talk about conservative regions of the Democratic party, we aren’t talking about the deep south. We are talking about the coal mines that make up Appalachia, and the vote there was much more divided.
Florida and Texas
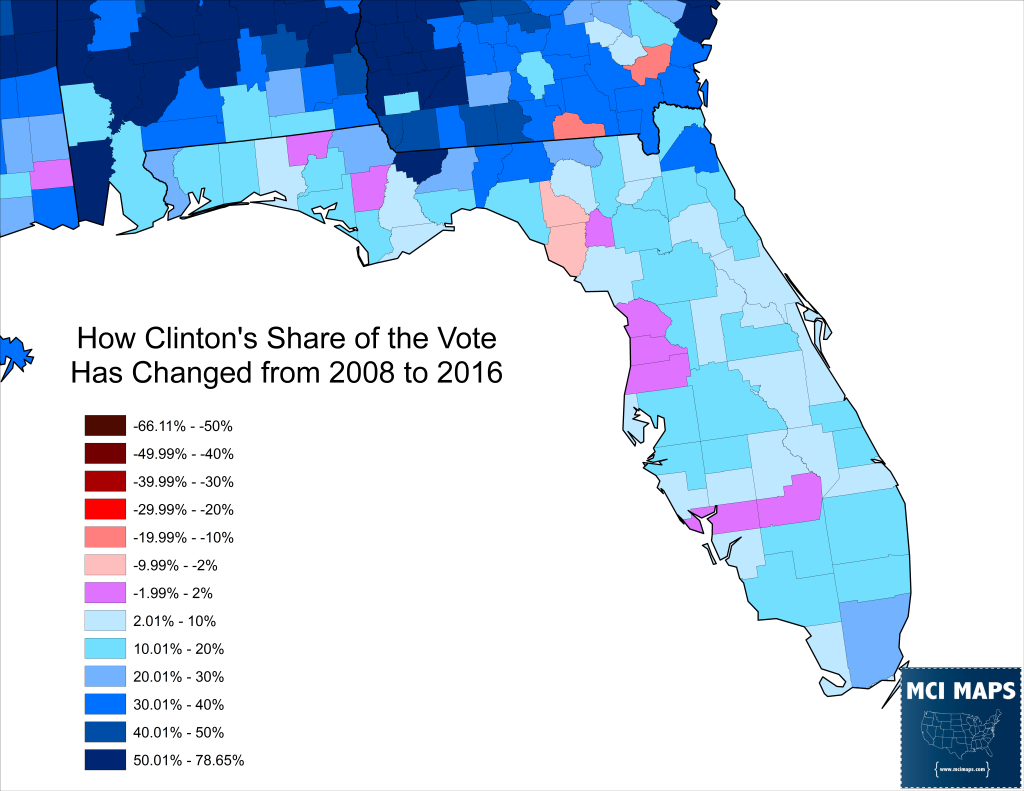
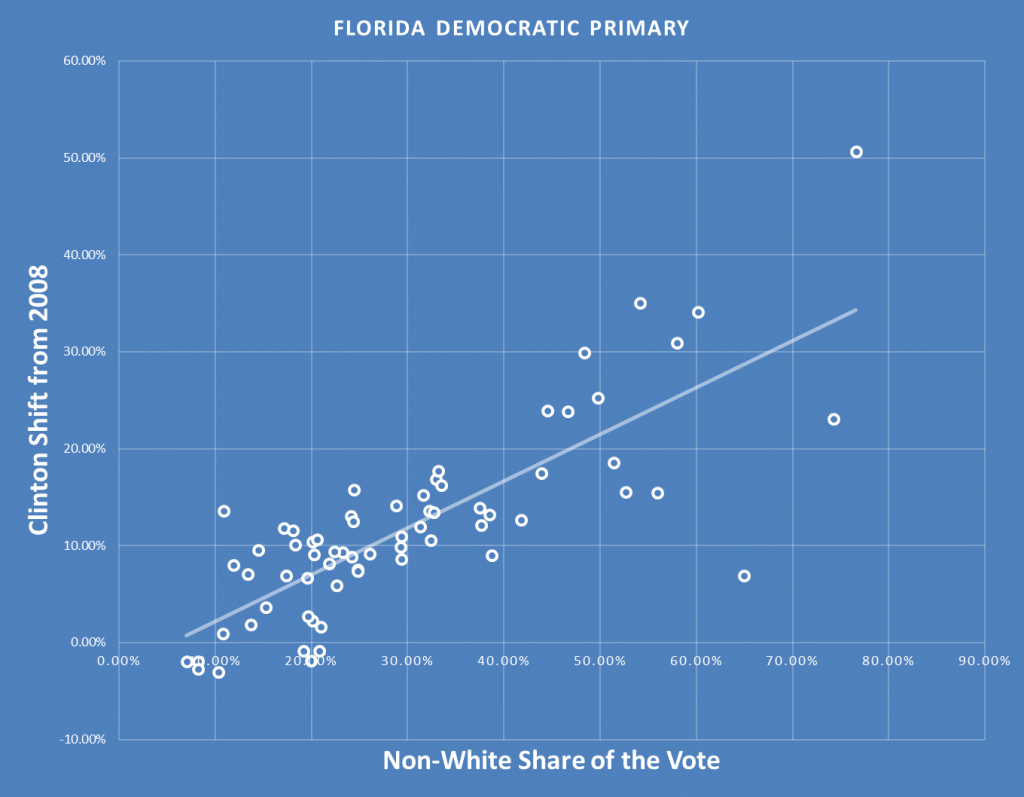
Florida was worth talking about separately. In 2008, the primary was not contested. However, Obama still won the African-American areas. This time, Clinton managed to keep her share of the vote fairly static in whiter areas and increased her share of the vote in African-American and Hispanic parts of the state. As the non-white share of the vote rose, so did her margin.
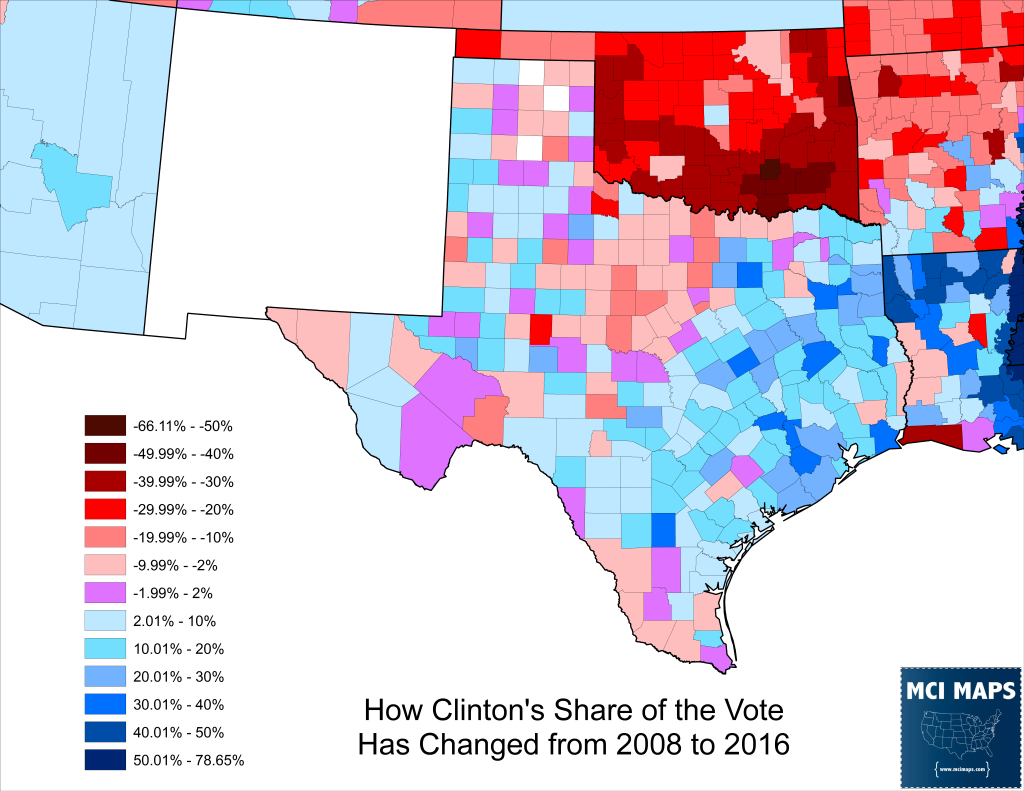
In Texas, Clinton won Hispanics as Obama had in 2008 and dominated with African-Americans. However, she did worse or static in the southern border counties with large Hispanic populations. Overall, Clinton did better in more African-American areas but did slightly worse or static with Hispanic areas (where she largely won in 08).
A More Liberal South
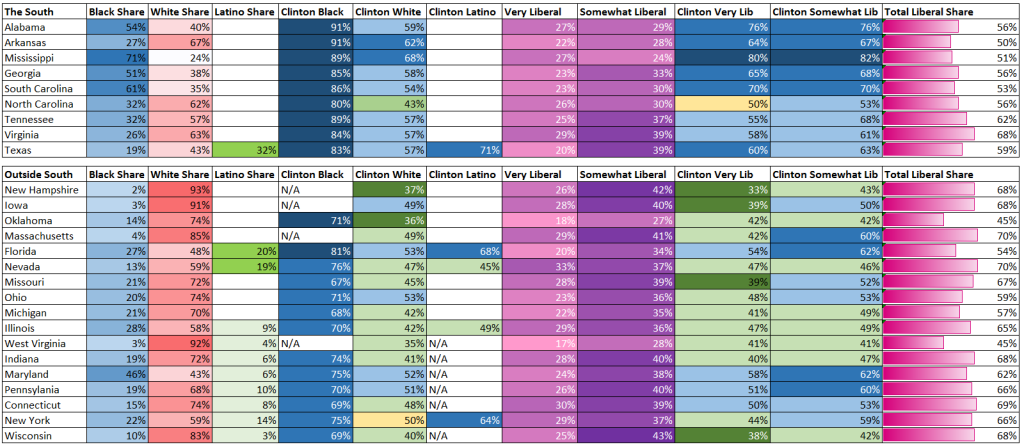
Even when it has been made clear that race dominated how the vote broke down in the south, the other argument made was that the southern African-Americans must have been conservative. However, exit polls do not back that claim up. The chart below shows key exit poll data from states where they were conducted. Unfortunately, not every state had exit polls.
The data highlighted are the racial makeup, Clinton’s share of the vote by race, the share of the voters considering themselves liberal, Clinton’s share of those voters, and the combined Very and Somewhat liberal vote.
The first item that jumps out is that the Southern States were much more African-American. These were exit numbers, and its notable Georgia exits understated the actual African-American vote.
Clinton won southern African-Americans by a much larger margin than those in northern states (largely concentrated in the cities). However, Clinton still won northern African-Americans by large margins. Clinton lost whites in most northern states, but won them in all available southern states except for North Carolina. Another important detail is that a majority of voters in all southern states considered themselves liberal. Virginia and Tennessee had a larger liberal share of the vote than Ohio. Only two states were below 50% liberal in the primary. West Virginia and Oklahoma. What was key for Clinton in the South was that she won liberals solidly, no doubt boosted by African-Americans. Overall, the Northern states had larger liberal shares of the vote than the Southern states. However, the notion of conservative southern voters is over-stated. What doomed Sanders in the south was the minority vote.

