Well, that was one hell of a political earthquake. For the first time since 1992, a Democrat has won a US Senate Election in Alabama. Democrat Doug Jones, a US Attorney, defeated former Alabama Chief Justice Roy Moore by 1.5% of the vote. Moore, always a controversial figure in Alabama politics, finally became too toxic for voters to support any longer. Moore’s hard-right positions and lack of respect for the law already made him a weak candidate. However, accusations from multiple men and women that Moore had a habit of dating and hitting on teenage girls when he was in his 30s put the race into chaos in November. Jones, meanwhile, was a prosecutor who gained attention in the late 90s for prosecuting the culprits of the 1963 African-American church bombing that killed 4 little girls. Jones ran an aggressive operation to swing over moderate Republicans and get African-American Democrats to surge to the polls; propelling him to a narrow win in a state that backed Trump by over 25% just one year ago.
Demographics
Two key demographic items should be addressed before delving into results in Alabama: race and education. The maps below show the the education and racial makeup of the counties. College educated voters have been a group growing more supportive of Democrats, especially when Trump-esq candidates are on the ballot. Key counties boast higher education levels: the suburbs and the University counties. Tuscaloosa is home to University of Alabama and Lee is home to Auburn. Madison and Shelby are two notable suburban counties that favor Republicans (Shelby is deep red while Madison is more split).

The other key demographic is race. Alabama is very racially polarized, with whites and blacks voting in near equal loyalty to the two parties. Several counties around Alabama’s “black belt” are less white and turnout shifts could make them more in play for a Democrat, as well as reducing the number of white voters a Democrat would need to win those counties.
The Results
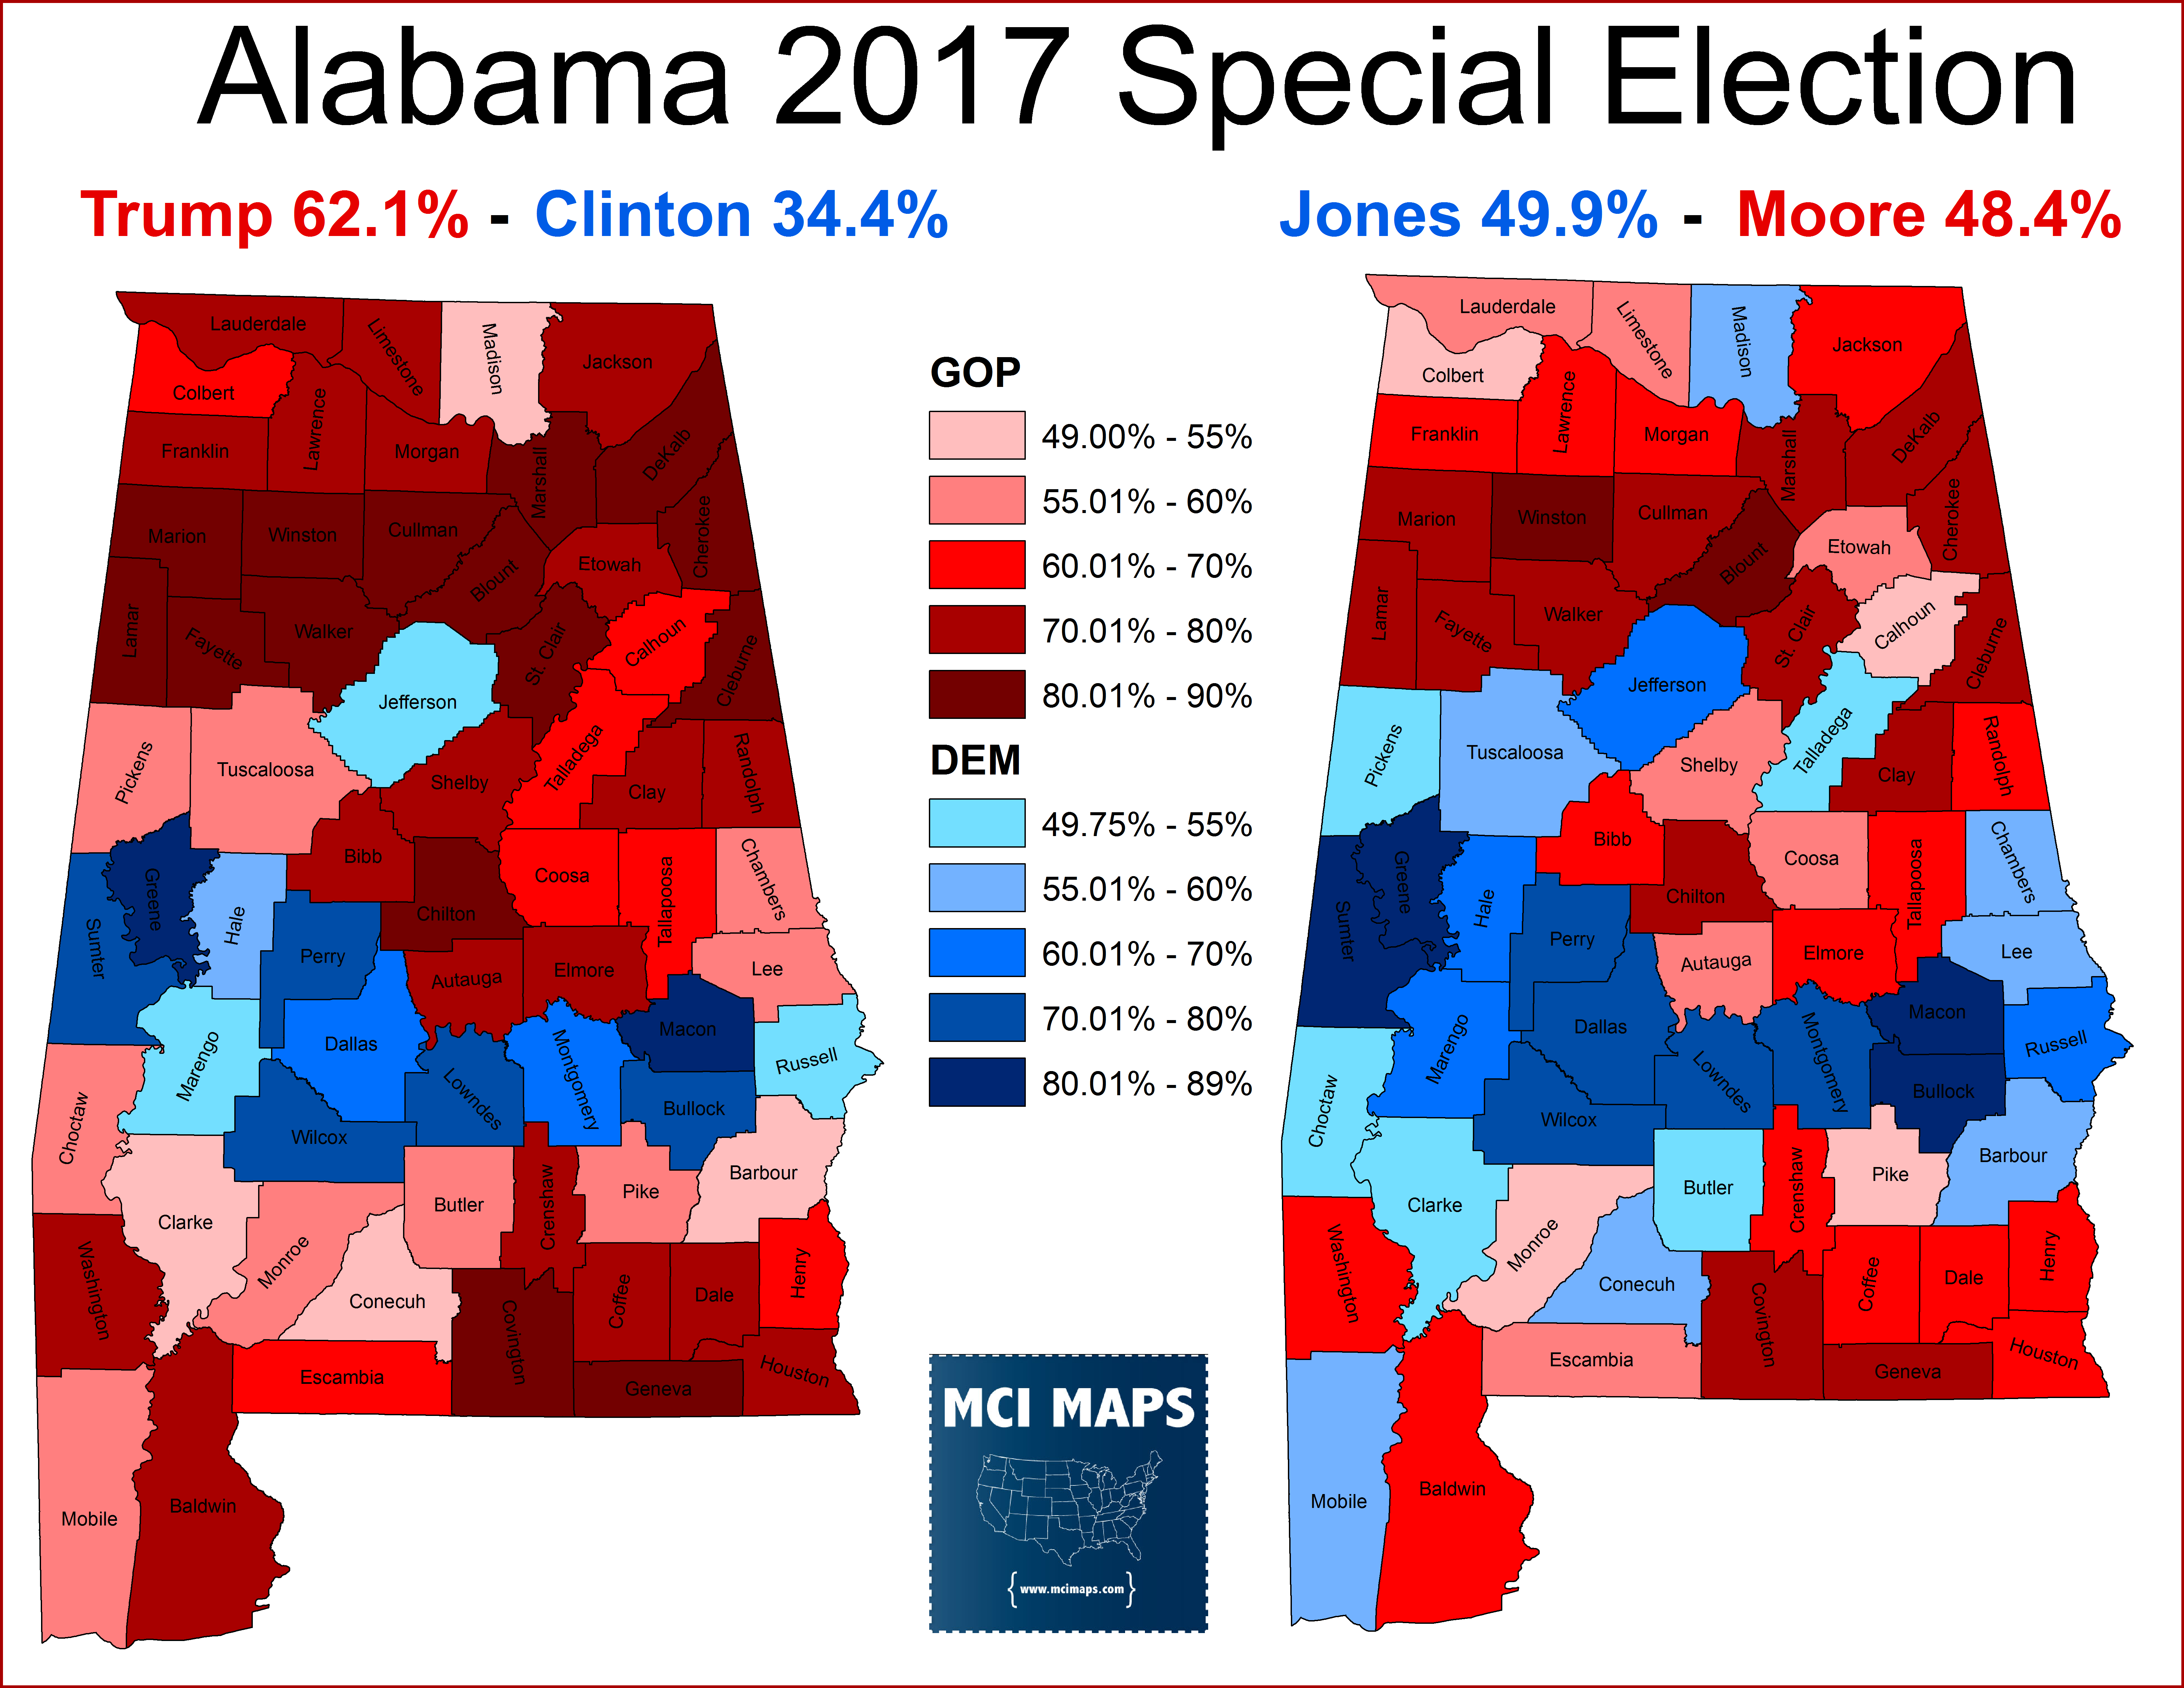
Jones’ 2017 win really stands out when compared to how the Presidential vote fell in the district. Jones flipped several counties from Trump. Many had modest African-American populations while others: like Madison and Mobile, where white and suburban and urban. Jones flipped the two University Counties as well.

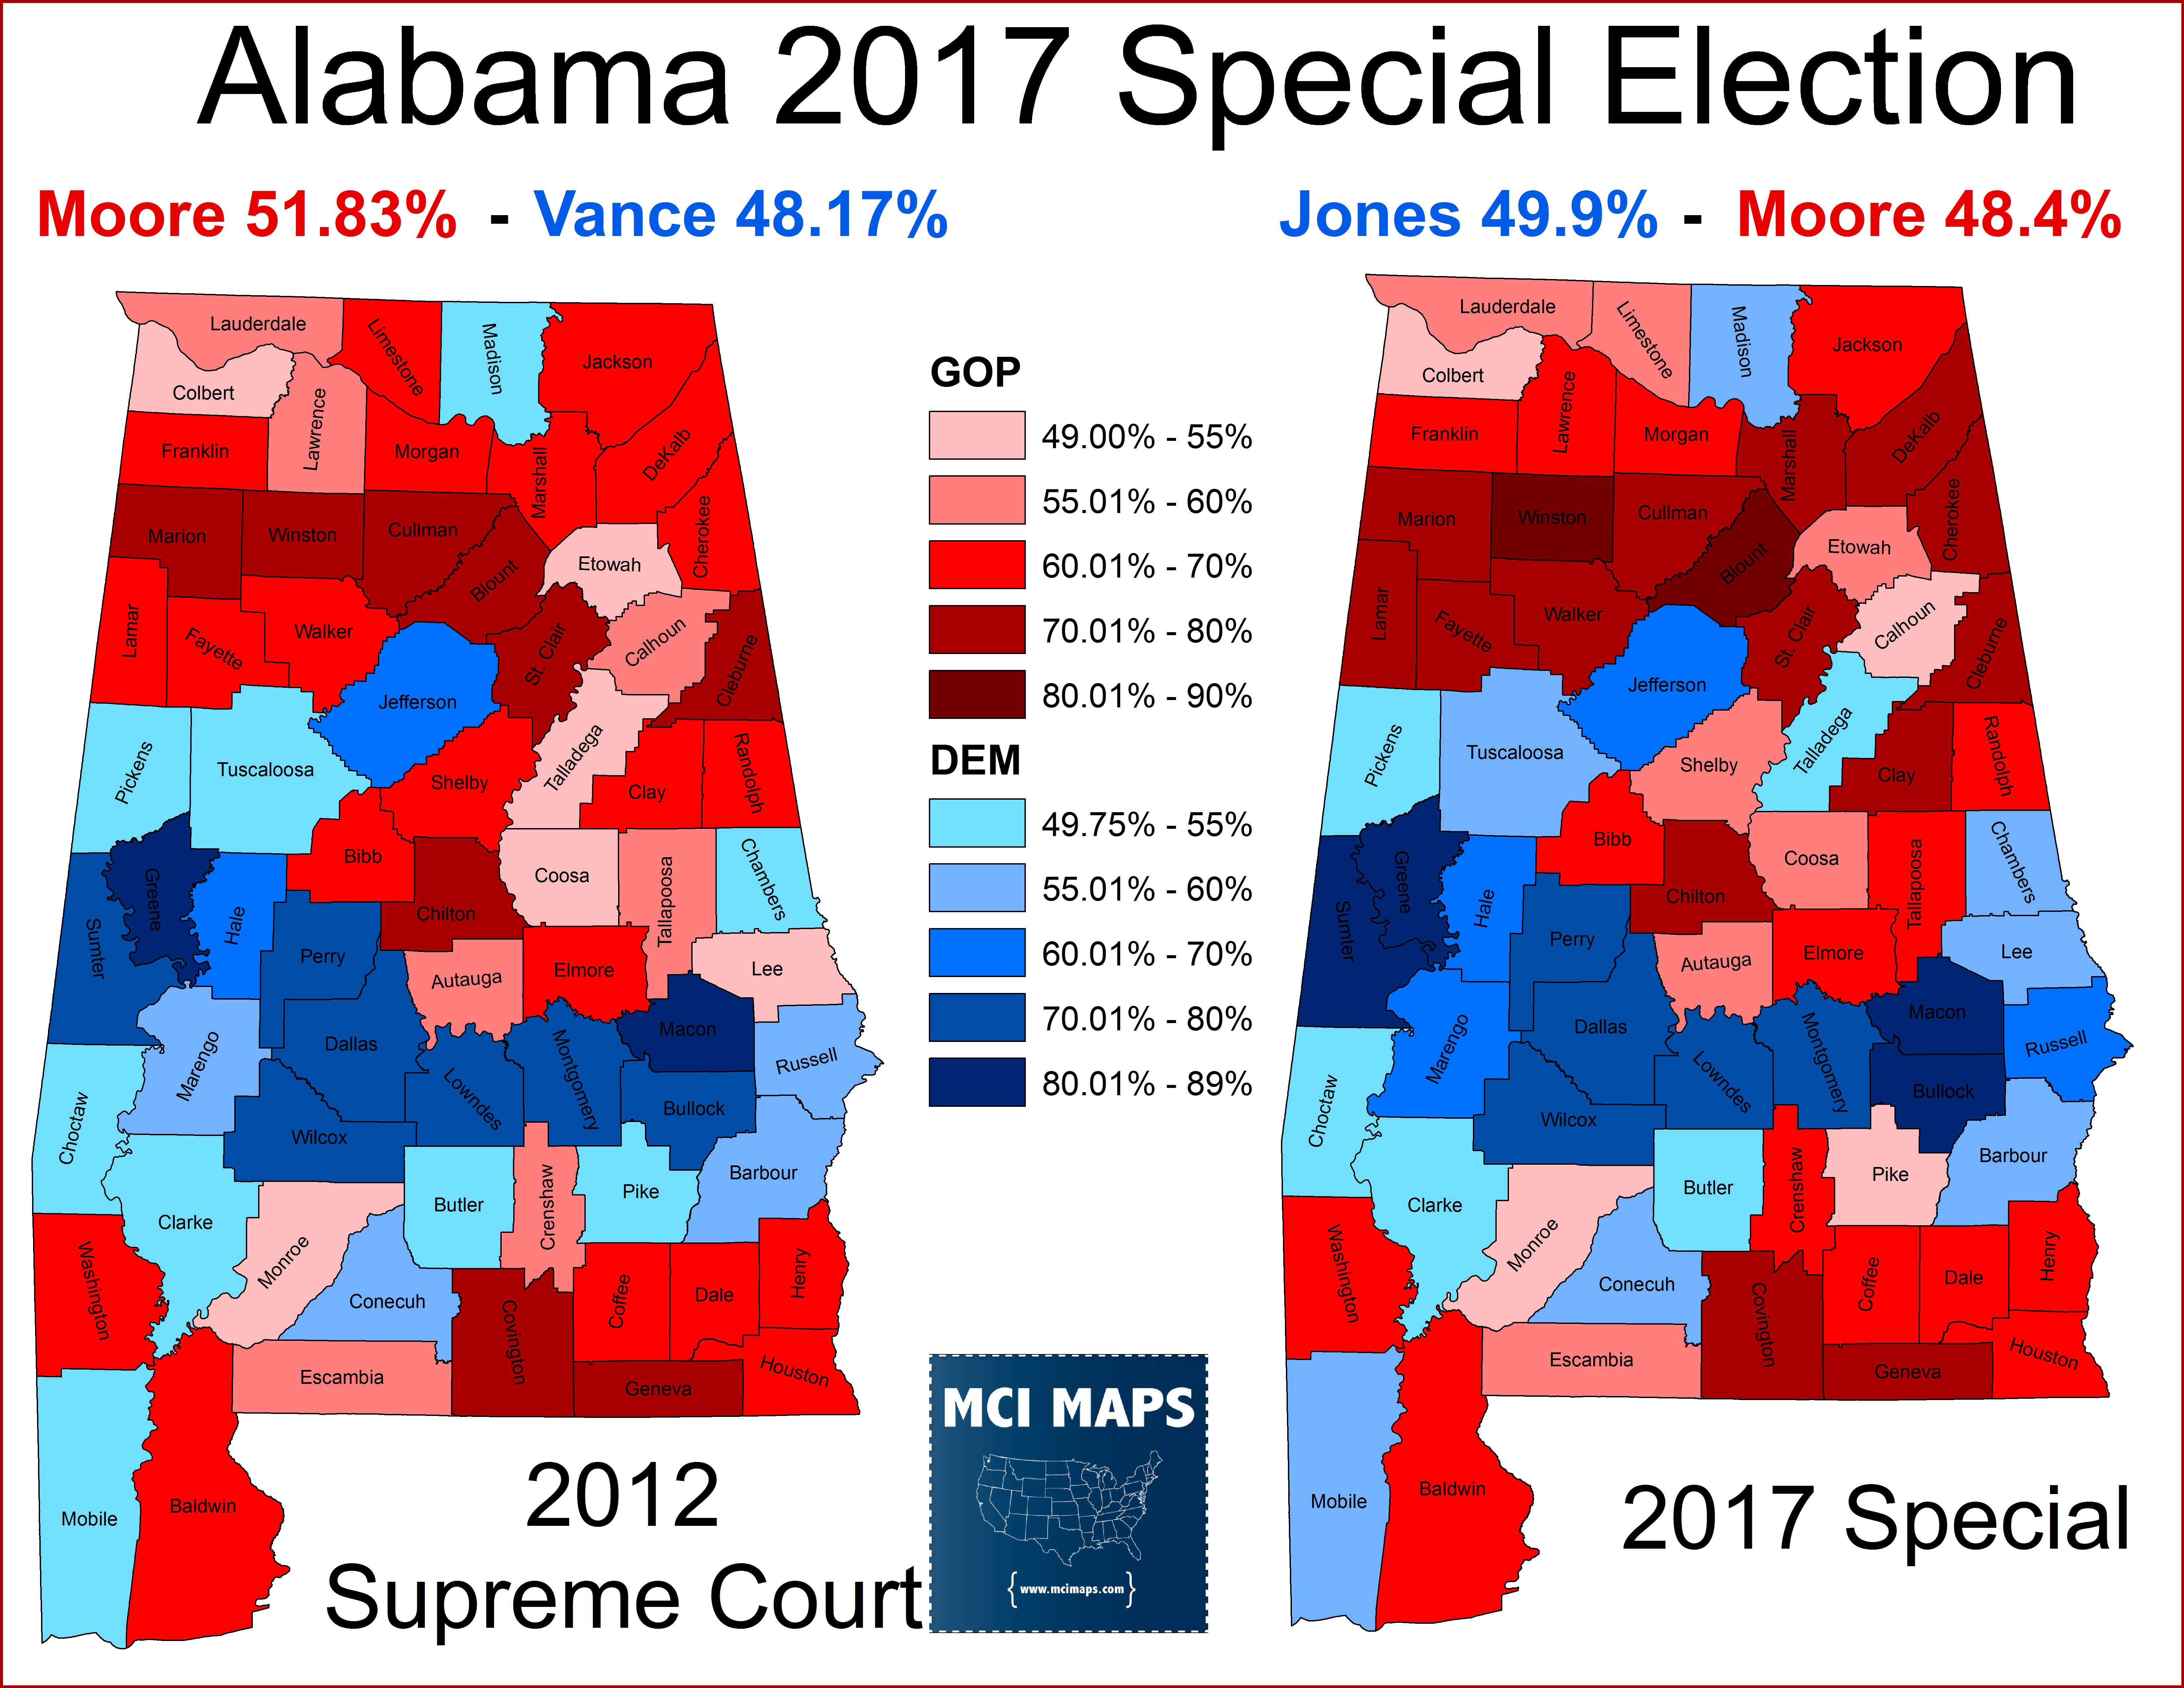
The Senate map is actually very similar to the map for Moore’s last election in 2012. Moore won an open seat for the Alabama Supreme Court in 2012 and only beat the Democrat by 4%. The red-blue counties come off close to the same, with only a few abandoning Moore.
For Jones it wasn’t just about winning counties, it was reducing margins in the red and improving them in the blue. Jones did this very well. Compare Jones’ share of the vote to what Obama and Clinton got, and Jones improved across the board.
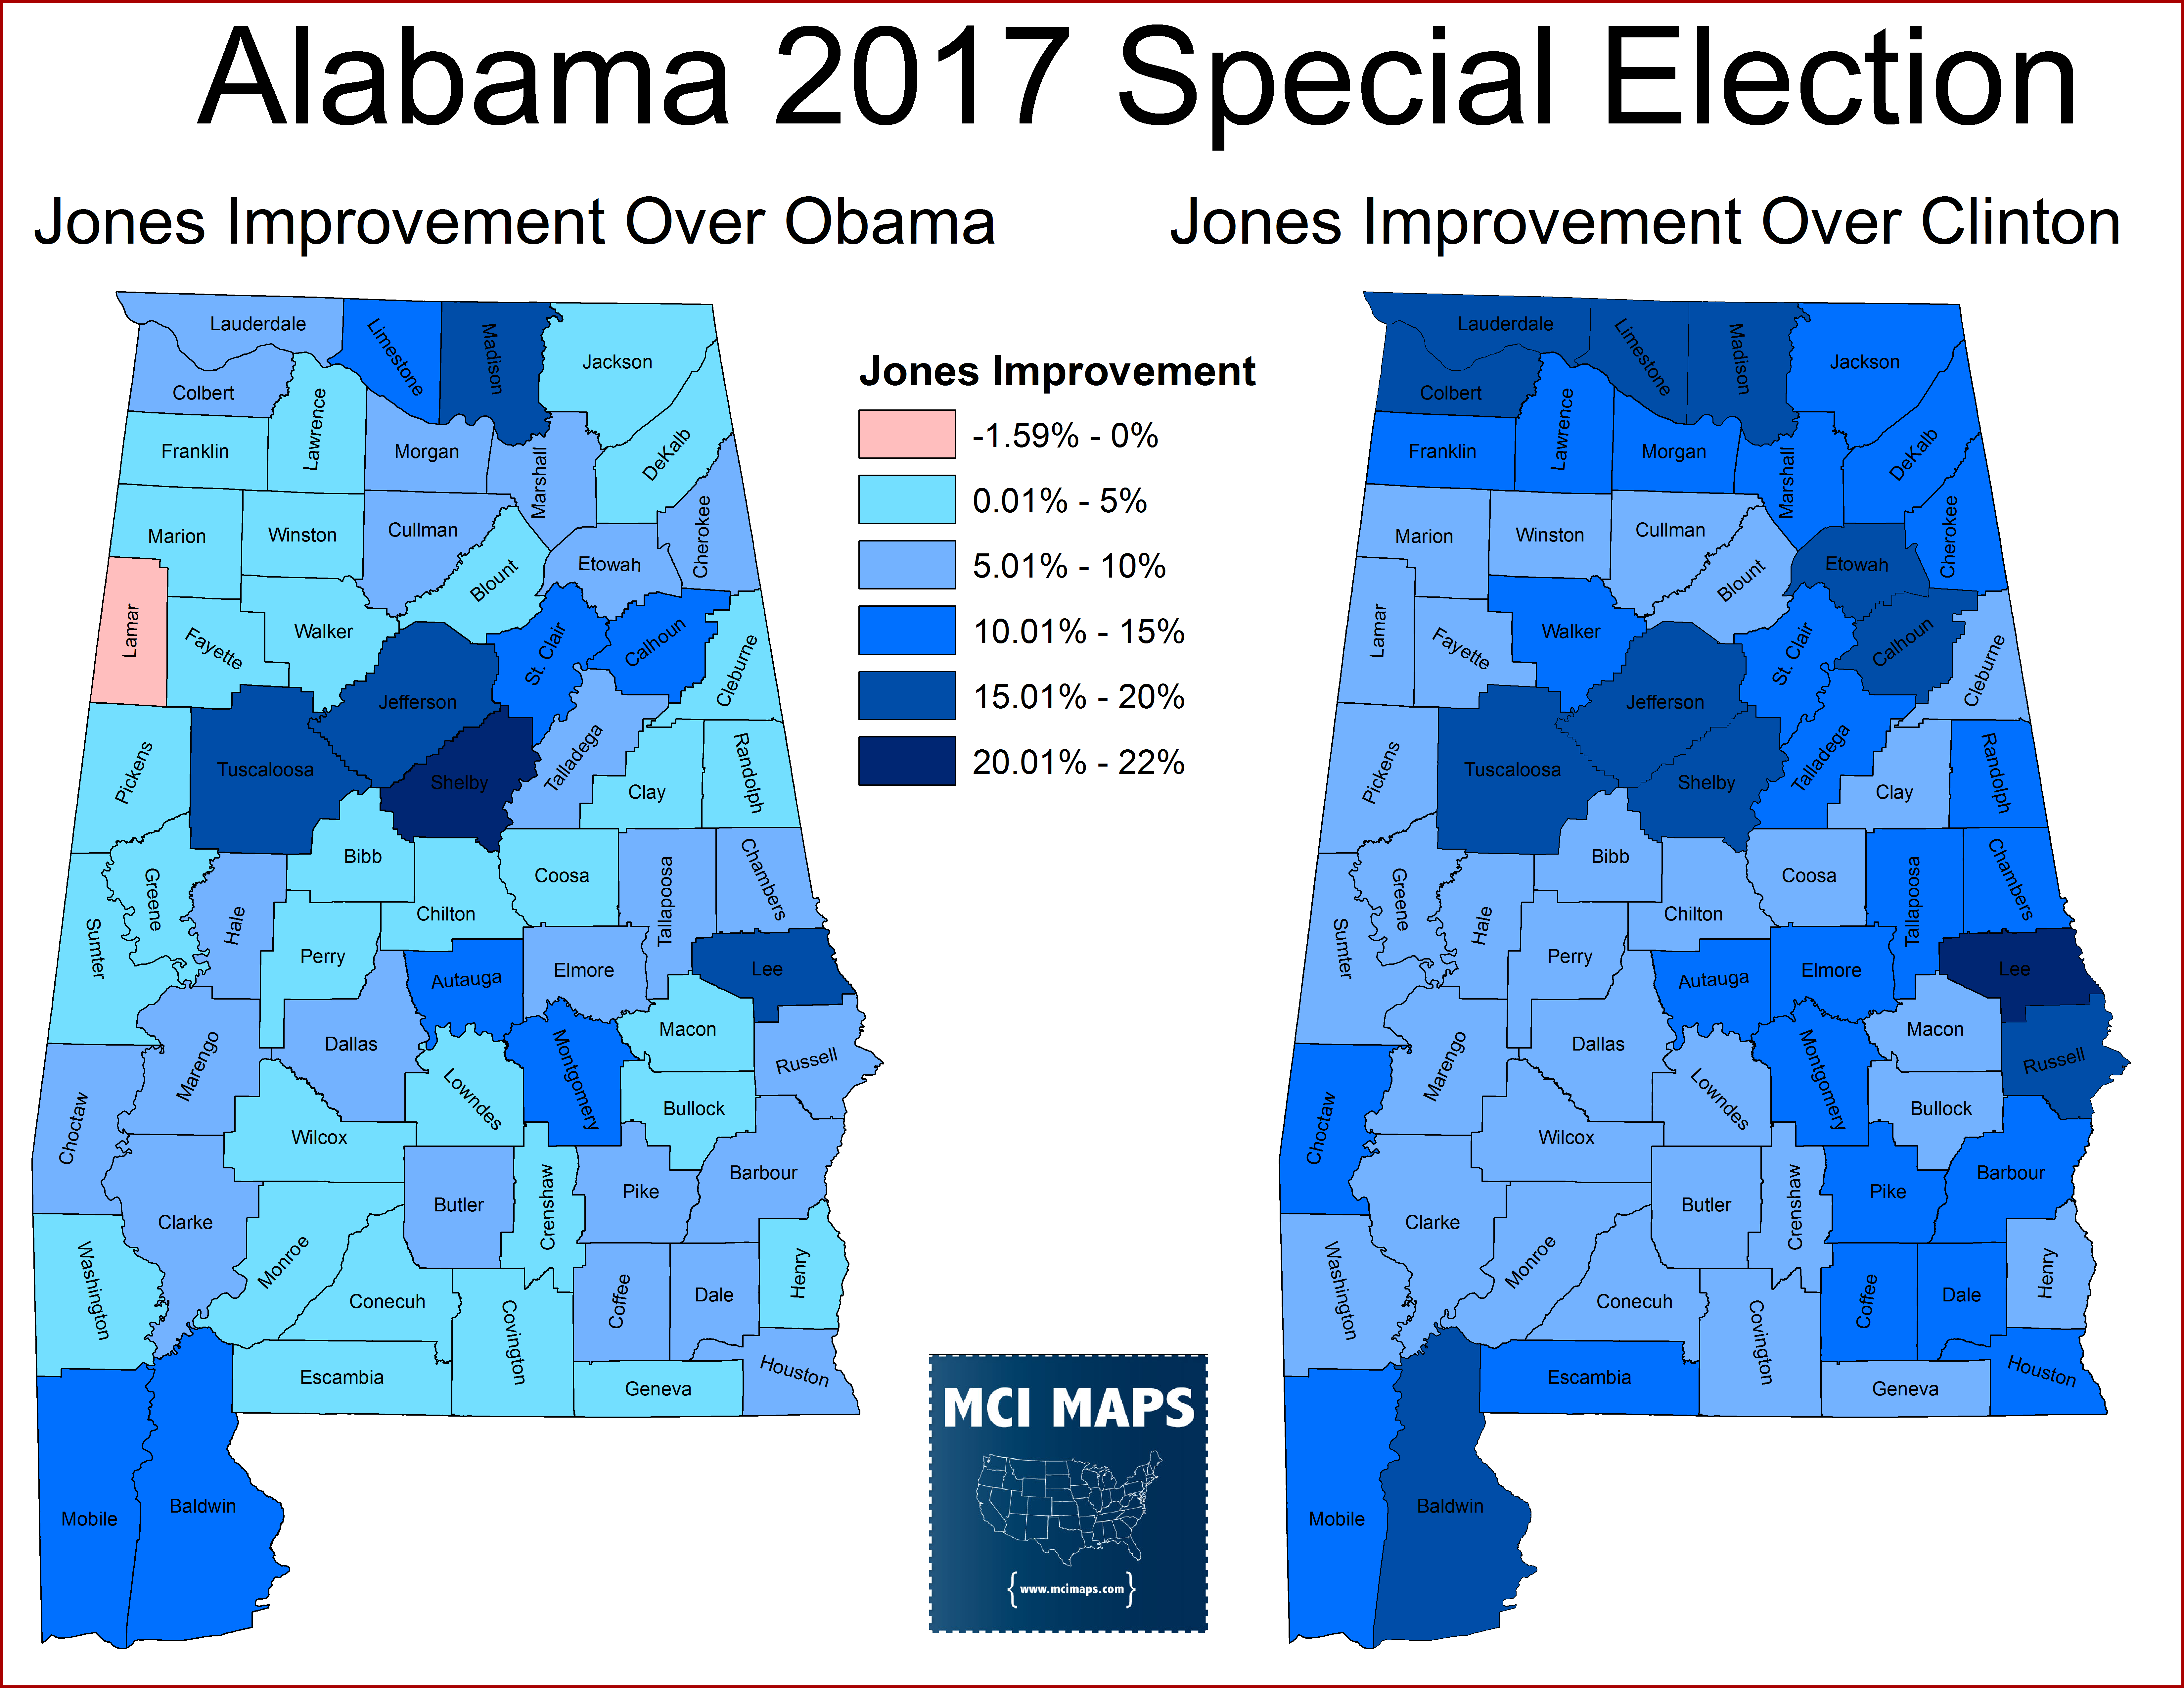
Jones’ gains were not uniform: they were weaker in rural counties (and the black belt where the margins were already very high) but were much stronger in the suburbs, universities, and overall less rural counties. Look back at the education map and we see a clear trend. The trend is strongest compared to Obama, as the scatterplot below shows.

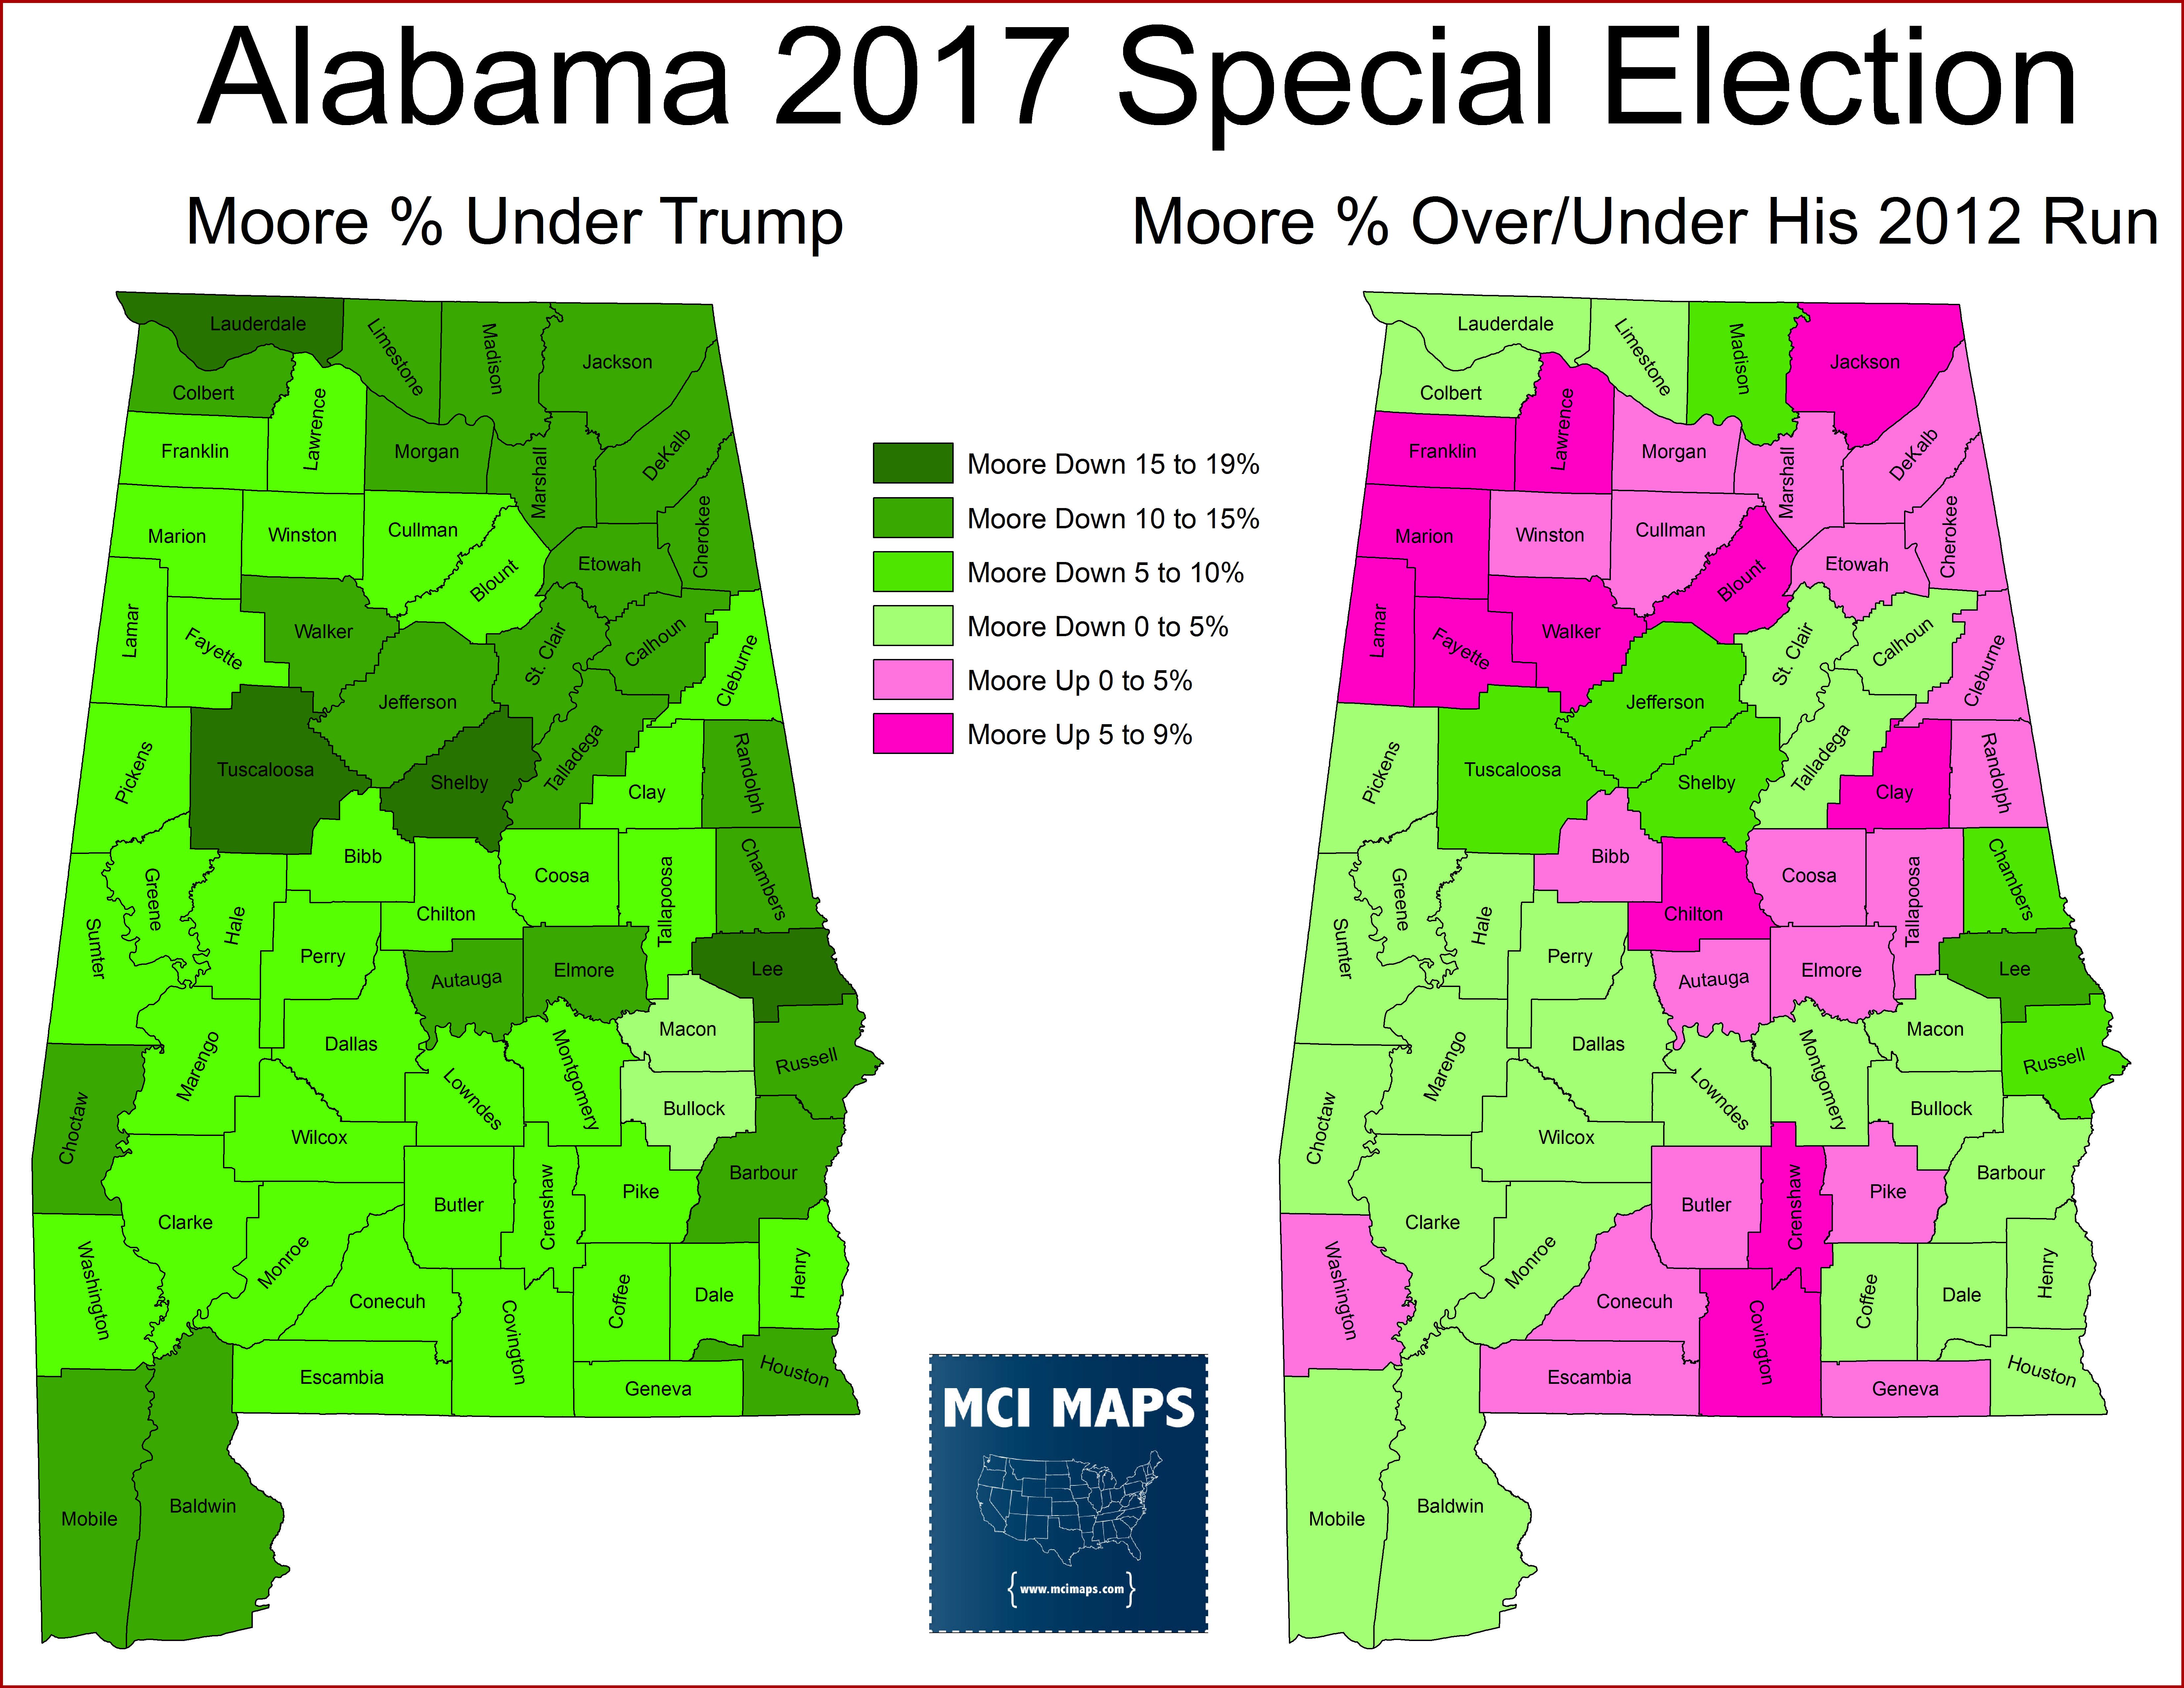
Meanwhile, Moore did worse than Trump across the board, but really tanked in non-rural counties. However, Moore did better than he had done in his narrow win in 2012 in several rural counties; meanwhile losing ground in more urban/suburban ones.
There are some demographics to note from the exit polls when looking at this race. Unfortunately the news didn’t do exit polls of Alabama in 2016, so I used 2012’s Presidential race for comparison.
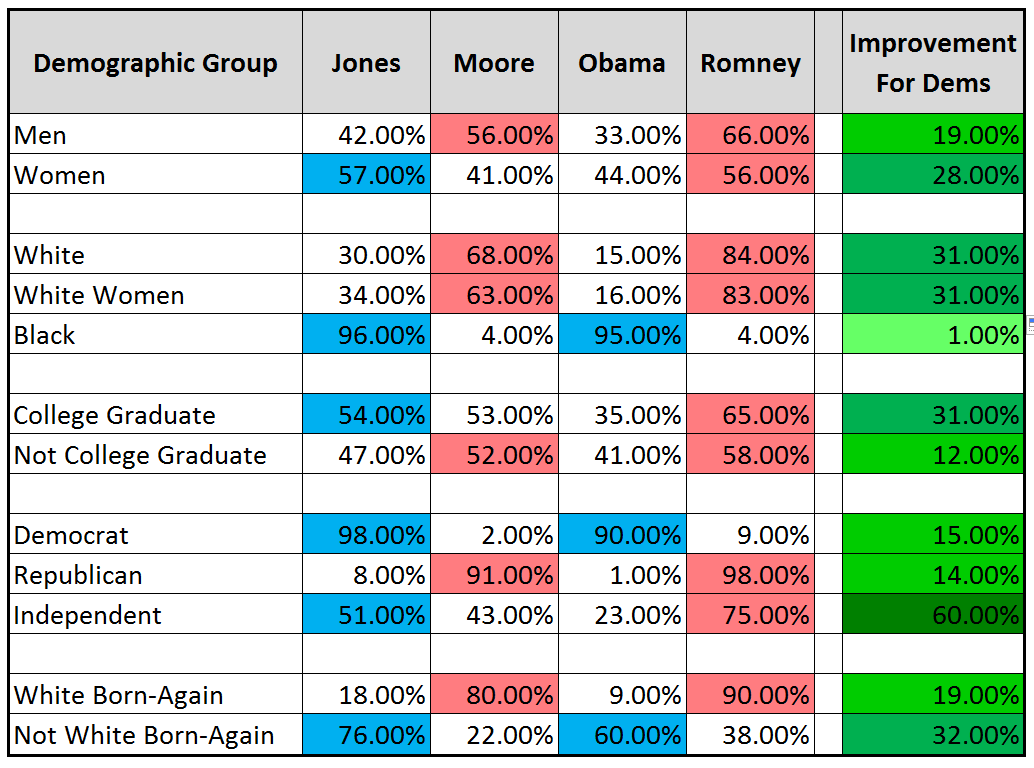
As this chart of key exit data shows, Jones did better than Obama with every group, often by large margins. The 2012 numbers and 2017 numbers must be compared to get a good picture. The states white population is very GOP. White voters, men and women, would always back Moore, but the margins mattered. Born-agains still backed Moore, but less than they did Romney in 2012. White women backed Moore, but by much less than they backed Romney.
A Much More Blue Electorate
One big hope for Jones was that democratic enthusiasm + GOP suburbanites staying home would create a bluer environment in order to pull of a win. Indeed it appears that happened. Exit polls and the results tell us a good deal. First, the exits.
- Self-ID’s Democrats made up 37% of vote, compared to 34% in 2012
- Liberals made up 23% of vote, compared to 16% in 2012
- White born-again Evangelical went from 47% to 44% of vote
- Black share went from 28% in 2012 to 29% this time
All of these shifts are within the margin of error, but they all collectively point to the same conclusion.. a bluer electorate. The increase in the African-American share (or even it holding with 2012) was a key excitement point early in the night.
The results themselves reveal more about the electorate. The map below shows turnout on the left and on the right it shows what % the vote cast for the special was compared to the vote cast for President last year. Basically, if 10,000 were cast for President and in the Senate race 5,000 were cast, that would be 50%.
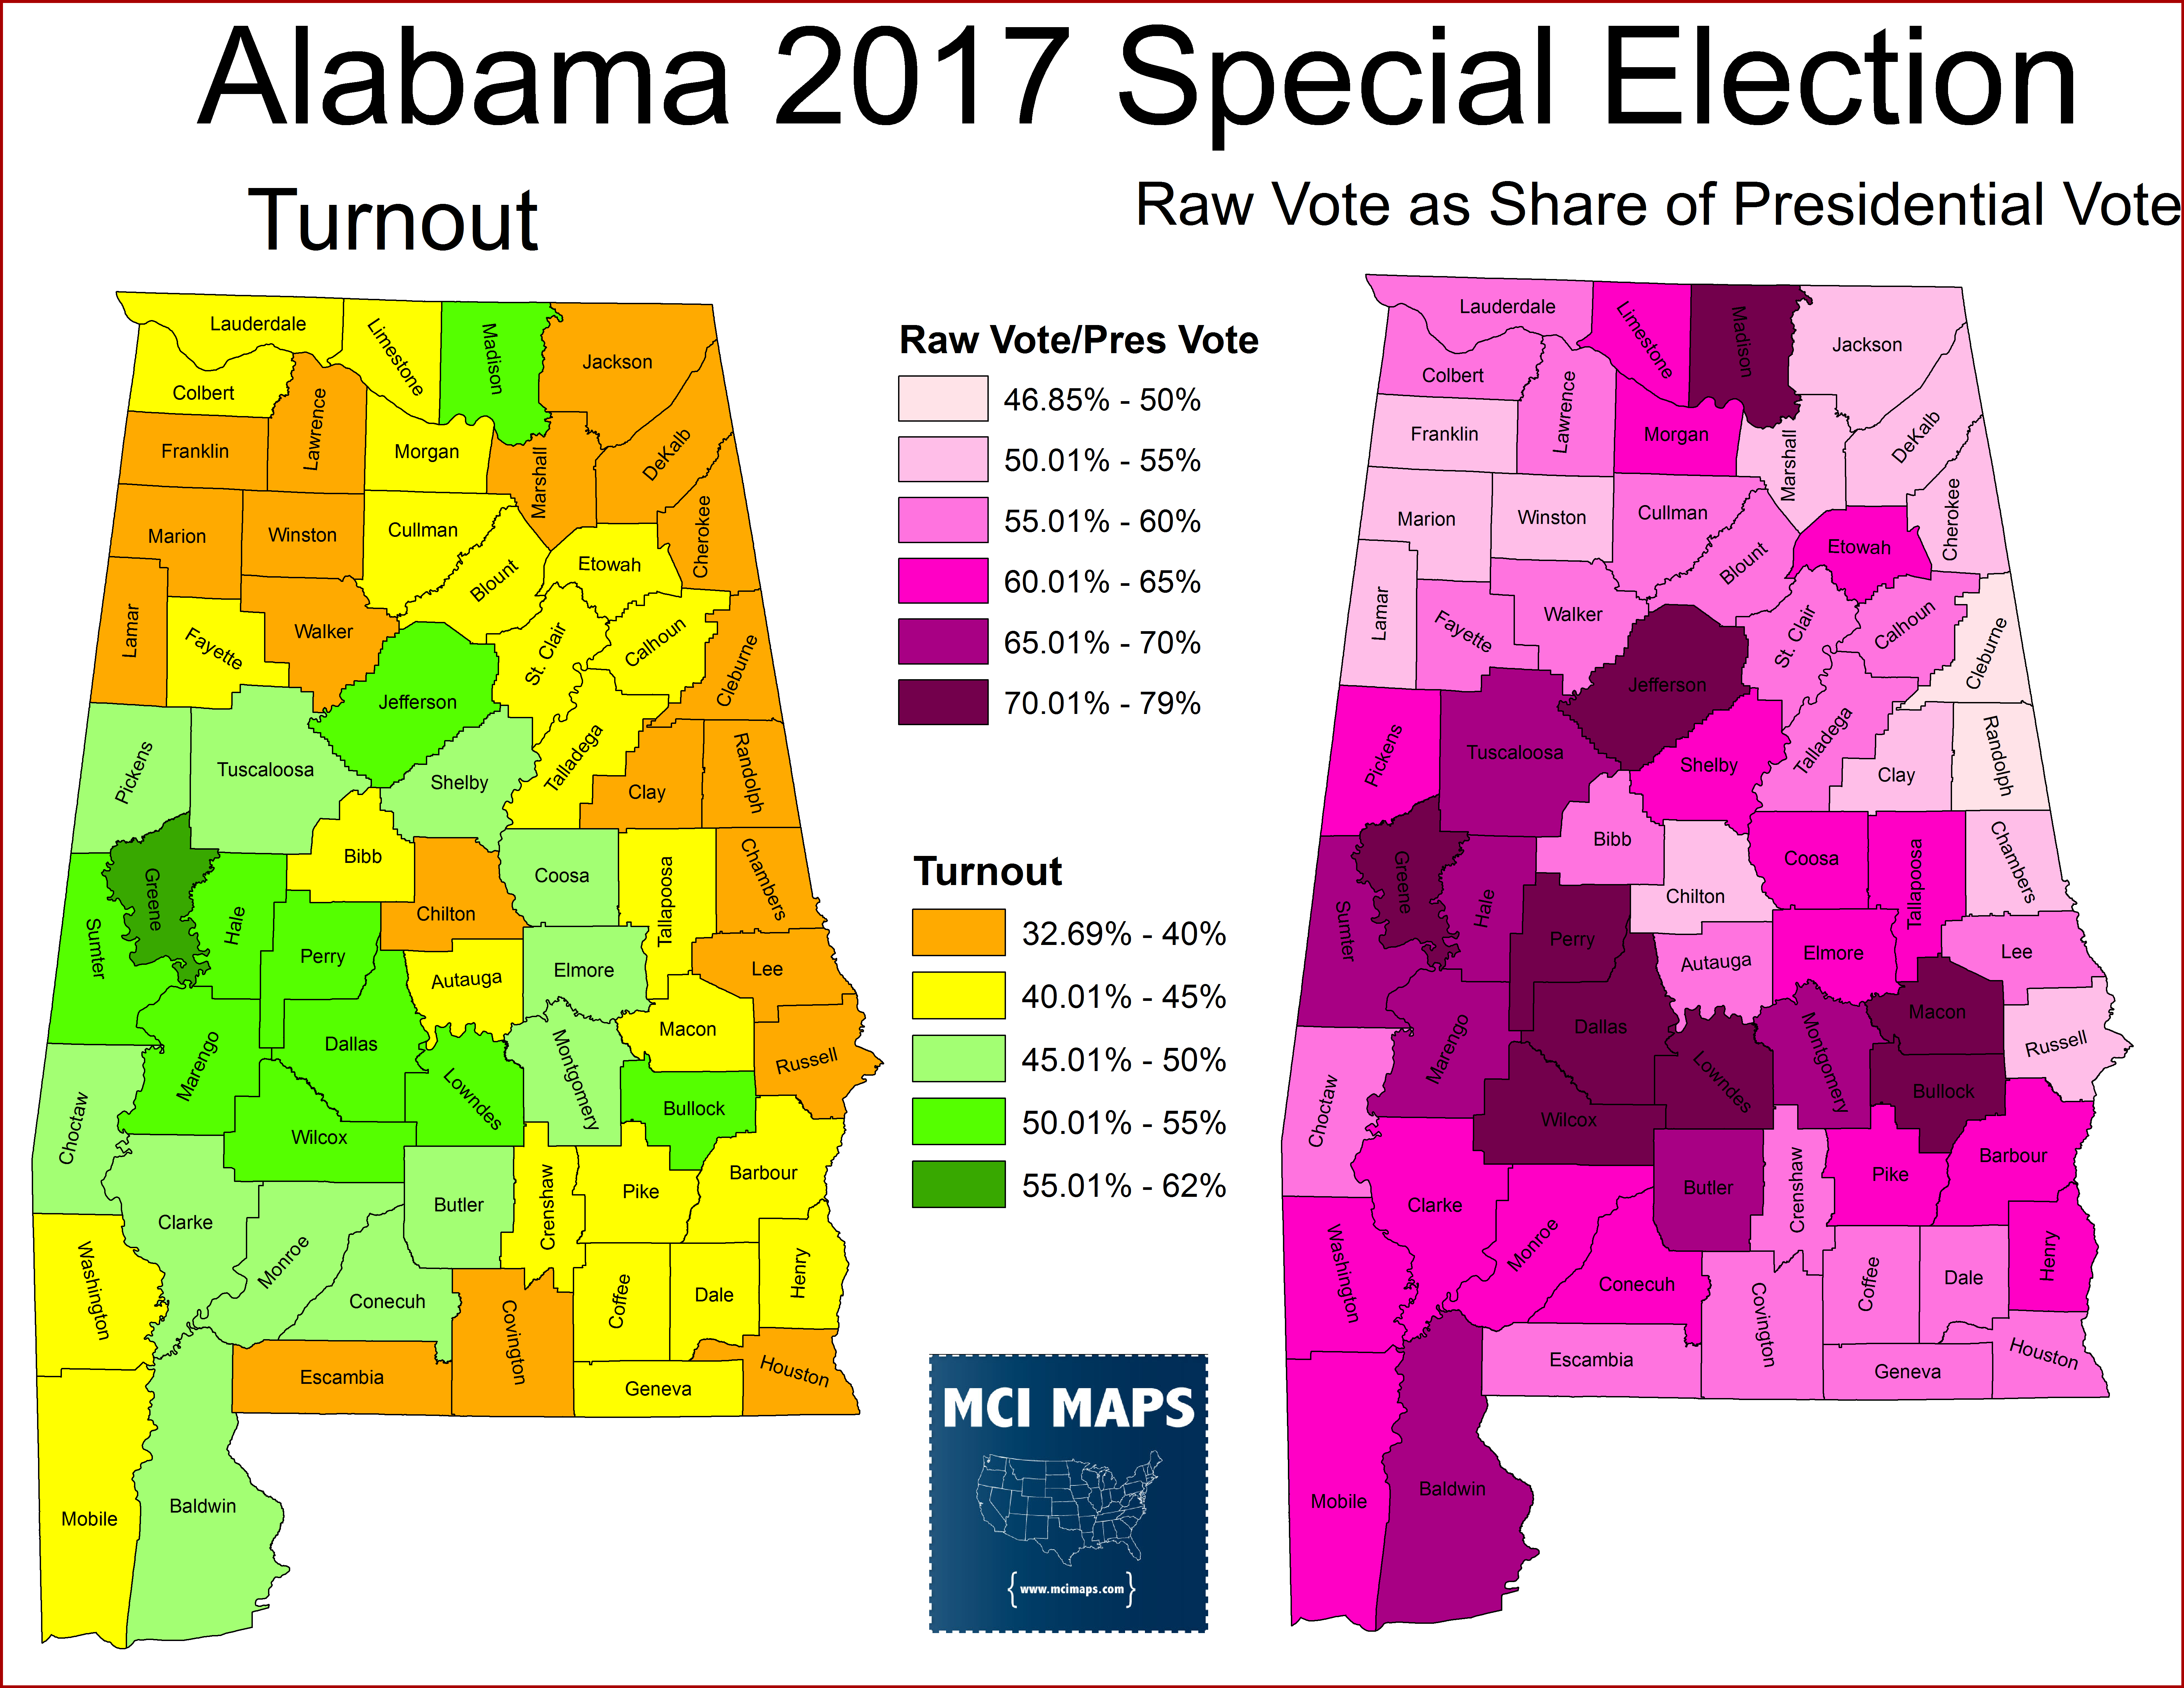
These maps say everything about the race. Turnout was strongest in the black belt. Many African-American counties topped 50% turnout. In addition, these counties saw their total votes equal over 60% to 70% of the vote cast in the Presidential election. Meanwhile, turnout, and that %, was lower in rural white counties that were seen as favorable to Moore. GOP voters did not turn out like Democrats did.
This turnout dynamic led to Moore losing far more raw votes compared to Trump than Jones did compared to Clinton. The maps below compare how both candidates did (in raw votes cast) compared to their Presidential counterparts.
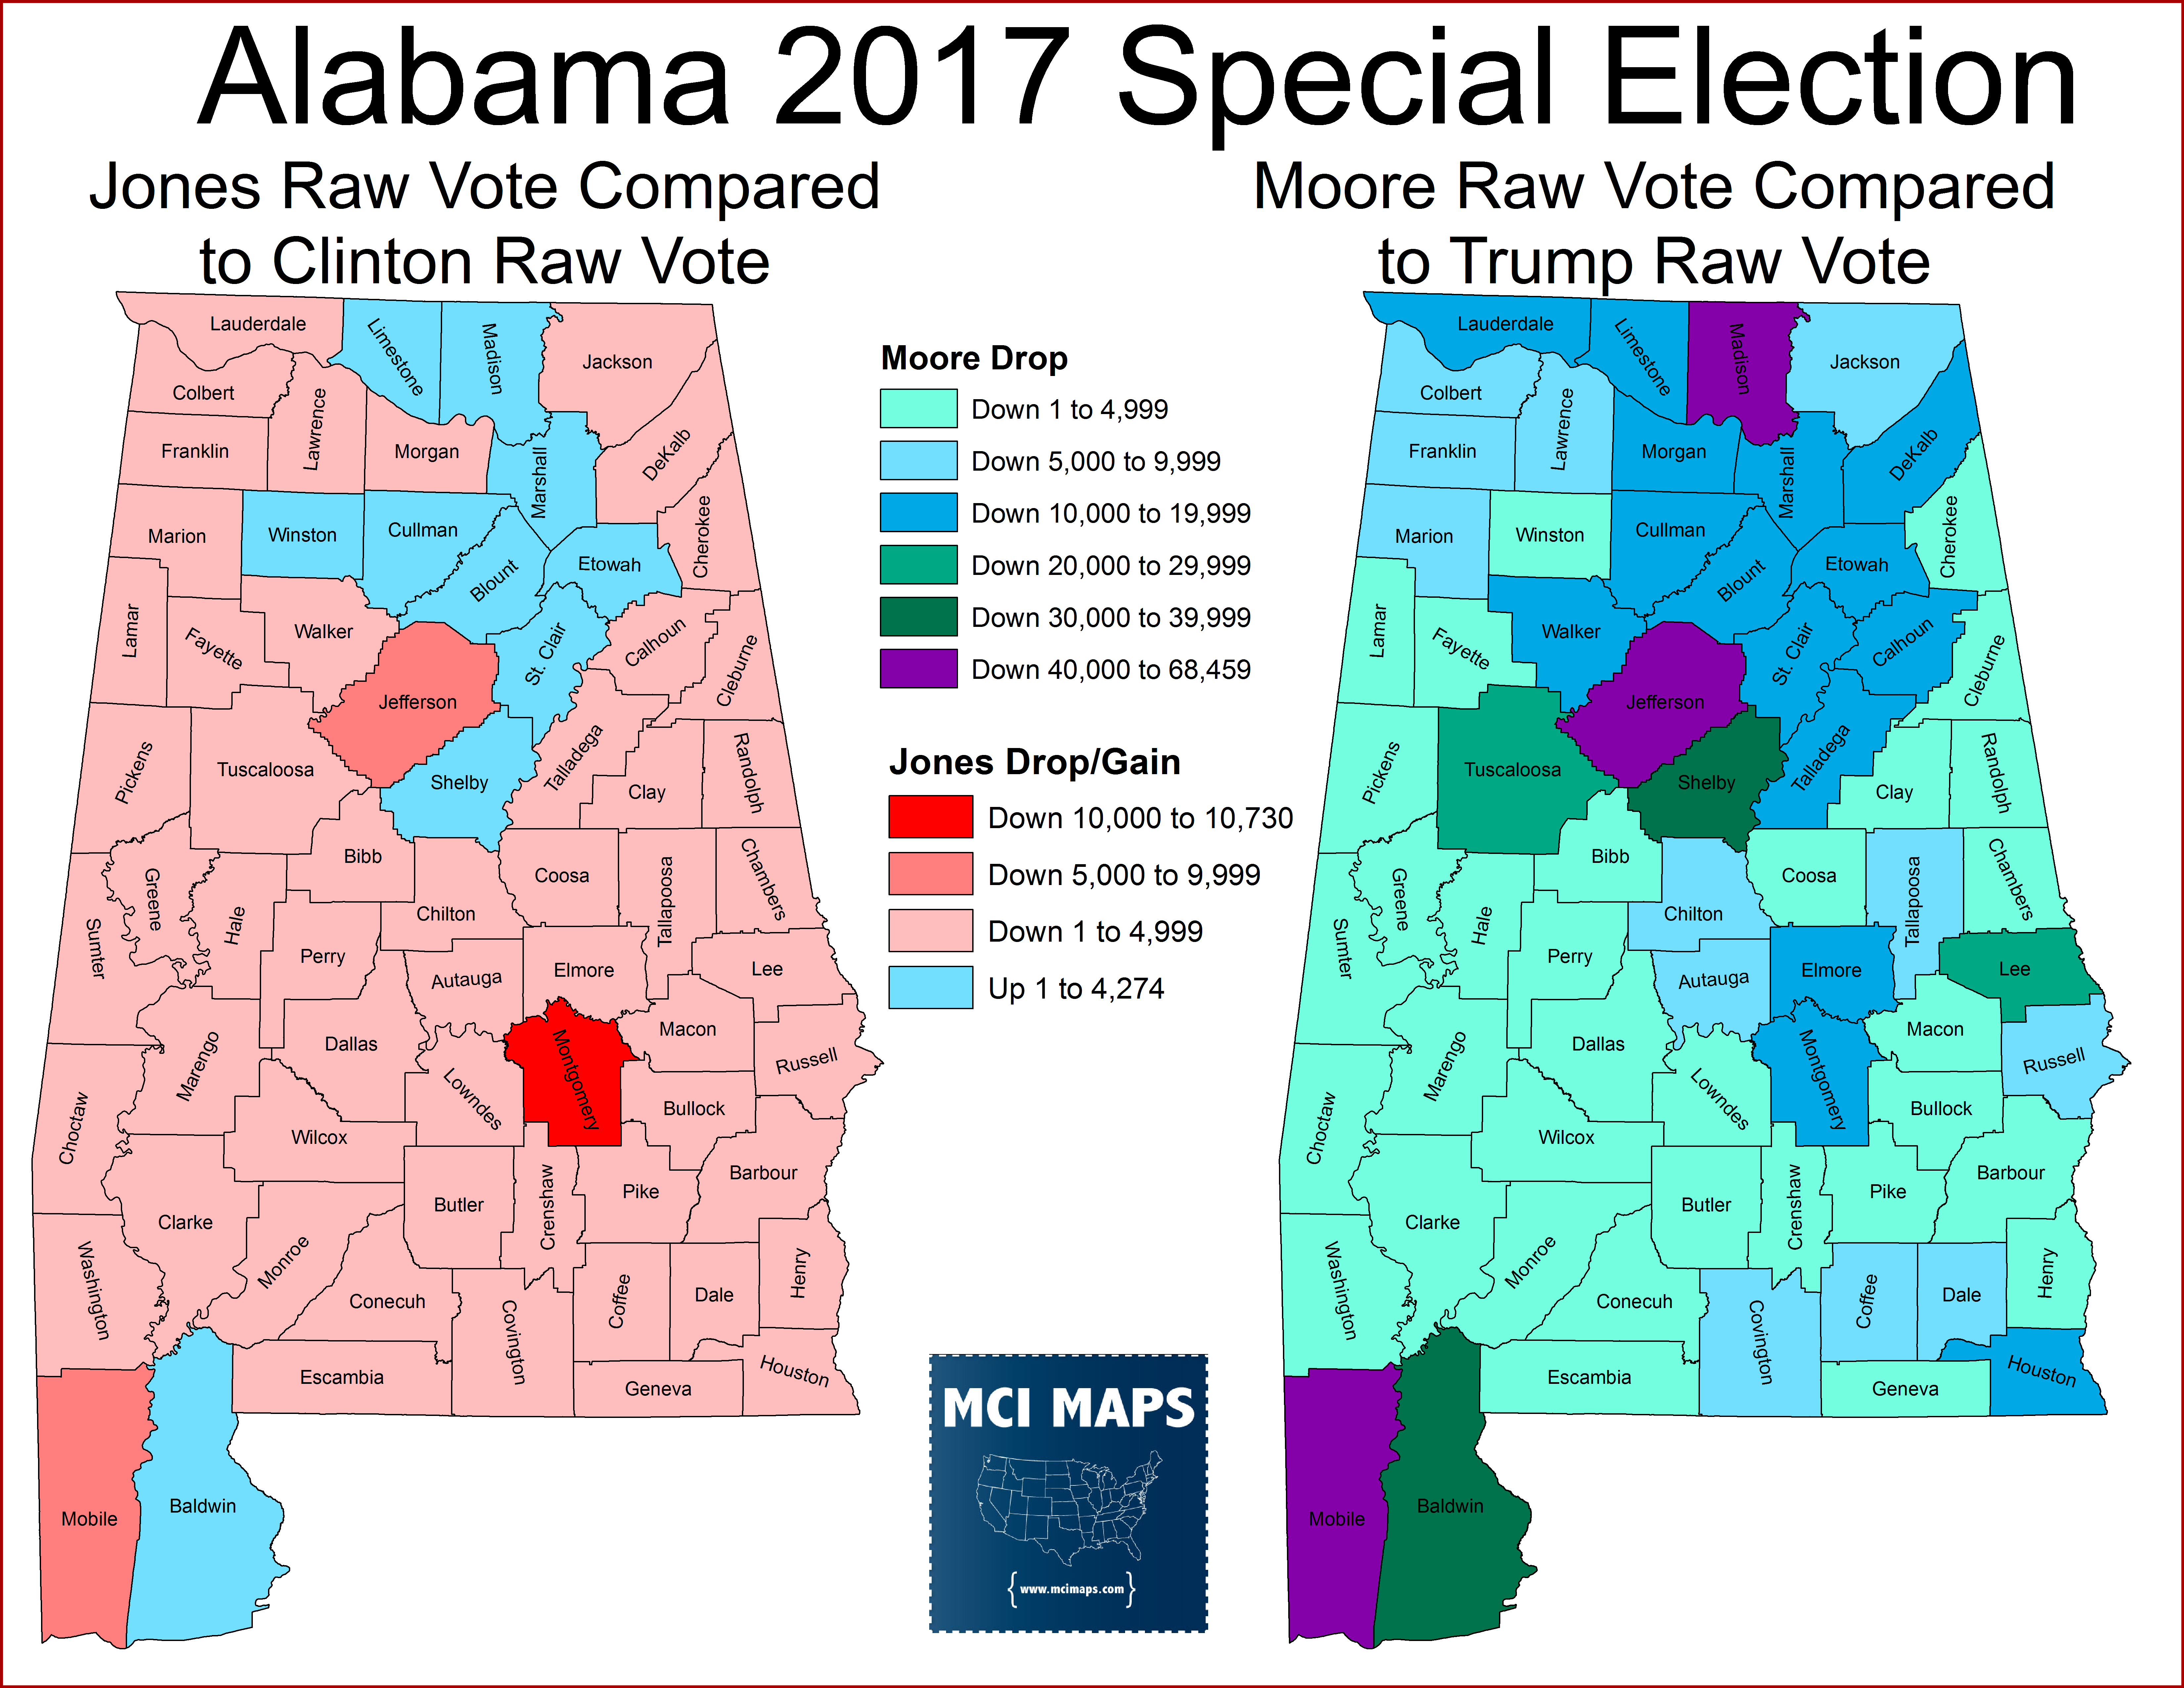
Jones did worse raw-vote-wise than Clinton in most counties, but actually improved in some. Meanwhile, Moore did worse everywhere and by much larger margins. Moore shed voted in Mobile, Baldwin, Jefferson, Shelby, and Madison counties. In many instances Jones’ improvement (as a %) compared to Clinton wasn’t because people crossed over, but because moderate GOP voters stayed home.
This table below shows the counties with the largest gap between Moore’s raw vote and Trump’s. While Jones did get more votes than Clinton in some of these counties, the biggest reason for the shift was GOP voters stayed home.
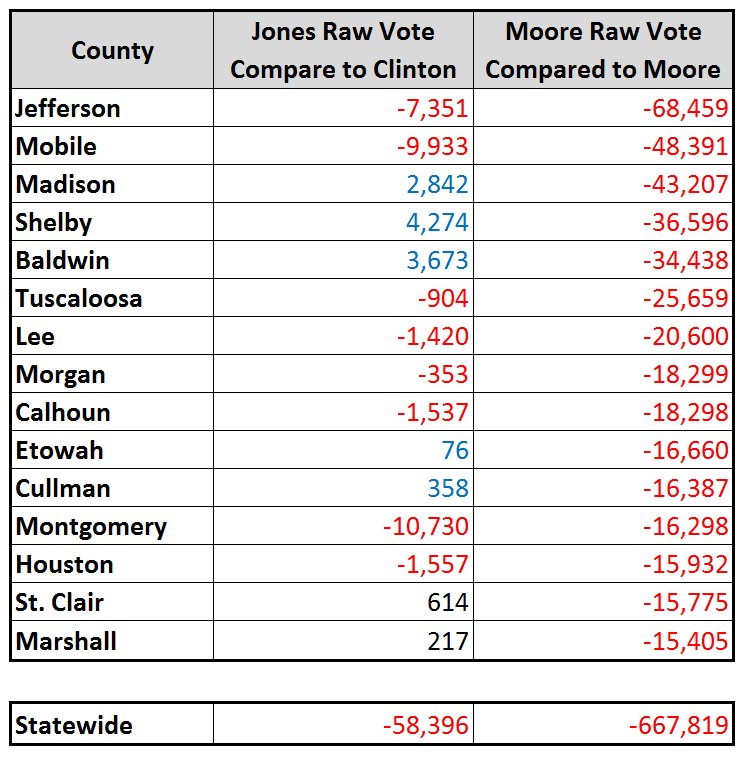
Statewide, Jones got 50,000 votes fewer than Clinton (not surprising, much lower turnout) while Moore got over 600,000 fewer votes!
I want to stress something too. Lazy punditry could make someone see both candidates getting fewer votes and thinking “ahah! both were disliked.” That is not true. By all accounts Jones was liked in the state. Turnout was never going to be Presidential level, so both candidates were always expected to not get as many raw votes. Its the gap between the two of them that is so staggering.
Now, we don’t have voterfile data yet. Surely some of Jones’ voters are Trump voters from last time who crossed the isle. Even in counties where Jones got fewer votes than Clinton, we likely have many Trump-Jones voters. We don’t be able to know more until delving into precinct and voterfile data.
What we do know for sure is this…. many more Republicans than Democrats stayed home.
Conclusion
The Alabama Senate race will definitely go down in the history books as one of the biggest upsets of modern politics. Moore’s controversies aside, this was a deeply red, racially polarized state. Jones won thanks to a better electorate: a testament to Democratic enthusiasm and GOP disgust in Moore. This win makes the Senate and House absolutely in play and should give Republicans a good deal to be nervous about (especially regarding the strong Democratic turnout).