Last week, the Florida House passed a bill creating 12 year term limits for Supreme Court Justices. Florida justices already must retire around or shortly after their 70th birthday and face a retention election every 6 years. The main argument for the term limits proposal was that justices have never lost their retention votes, making them less checked than the other chambers of FL government. The Florida legislature’s conflicts with the FL Supreme Court are well documented in FL politics. The courts have struck amendments from the Florida ballot for violating the rules allowing an amendment to go before the voters (such as vague wording or violating the single-issue rule). Efforts to “check” the courts, which still operates under a narrow liberal majority, have fallen flat with voters before. The latest move by the legislature, which is still sore over the court throwing out GOP-gerrymanders for the Congressional and State Senate lines, is term limits. No other state in the nation has term limits and its unclear if the State Senate will hear the manner.
The argument used, that the justices never lose retention and hence have no check, is… of course… wrong. True, no justice has lost retention. However, that is thanks to no justice going before the voters with a major scandal that would warrant removal. The point of an independent judicial system is to look beyond political ideology and make rulings on the law. A justice should never be removed for political disagreement, only for corruption/scandal or something making the justice unfit. In Florida’s history, a few justices have recently been subject to attacks by political organizations, but all survived their retention votes.
While digging through retention votes, I came across some interesting demographic trends over the last 10 years. There is a notable regional split on retention votes.
Regional Disparities
Florida’s judicial retention elections are normally sleepy affairs. Justices often skip on fundraising when no concentrated opposition to them exists. Two notable times in the last 10 years saw justices actively targeted for defeat.
- In 2010, Justices Labarga and Perry, both more liberal justices, were targeted by tea party groups for voting to throw a proposed anti-obamacare amendment off the 2010 ballot
- In 2012, Justices Quince, Pariente, and Lewis, all part of the liberal bloc, were all targeted by conservative groups for defeat
All retention efforts have failed, with all justices except for Labarga in 2010 getting over 60% of the vote.
I broke down all the retention votes by county since 2010 and put them in this chart below. The chart is sorted by the average retention vote overall. It also includes a column showing the gap between the justices in 2016).
All of these races are mapped out below.
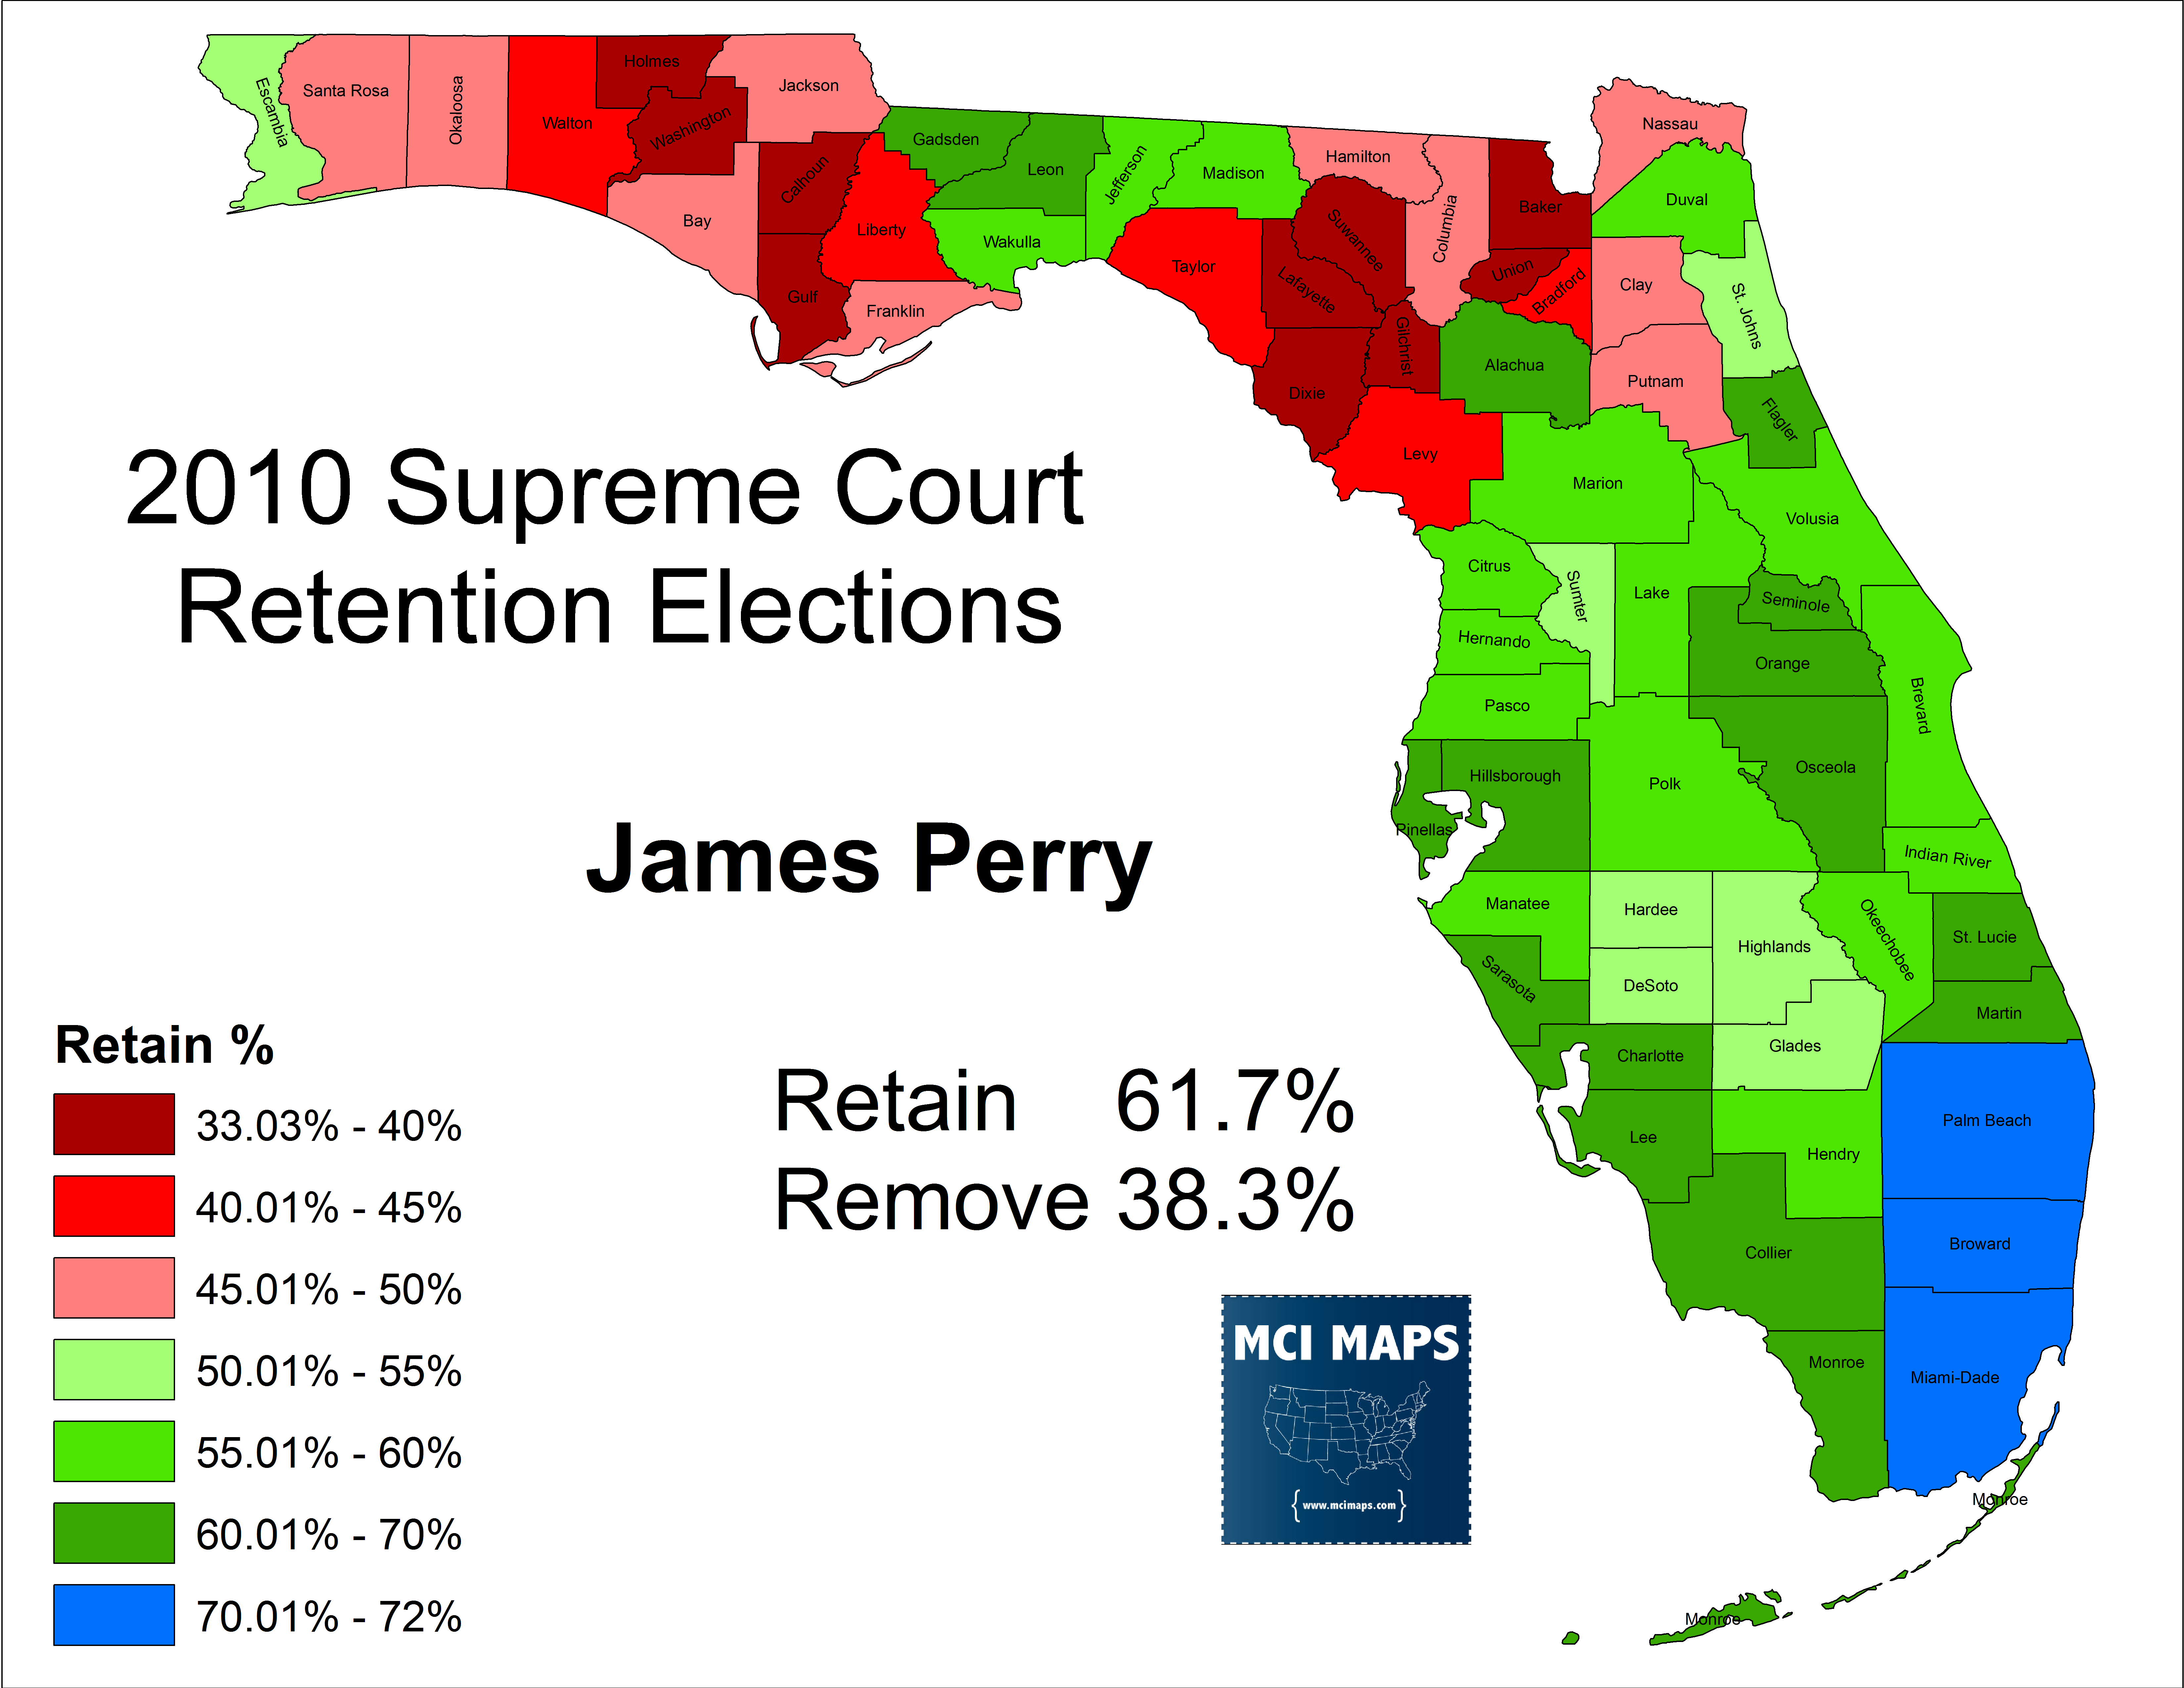
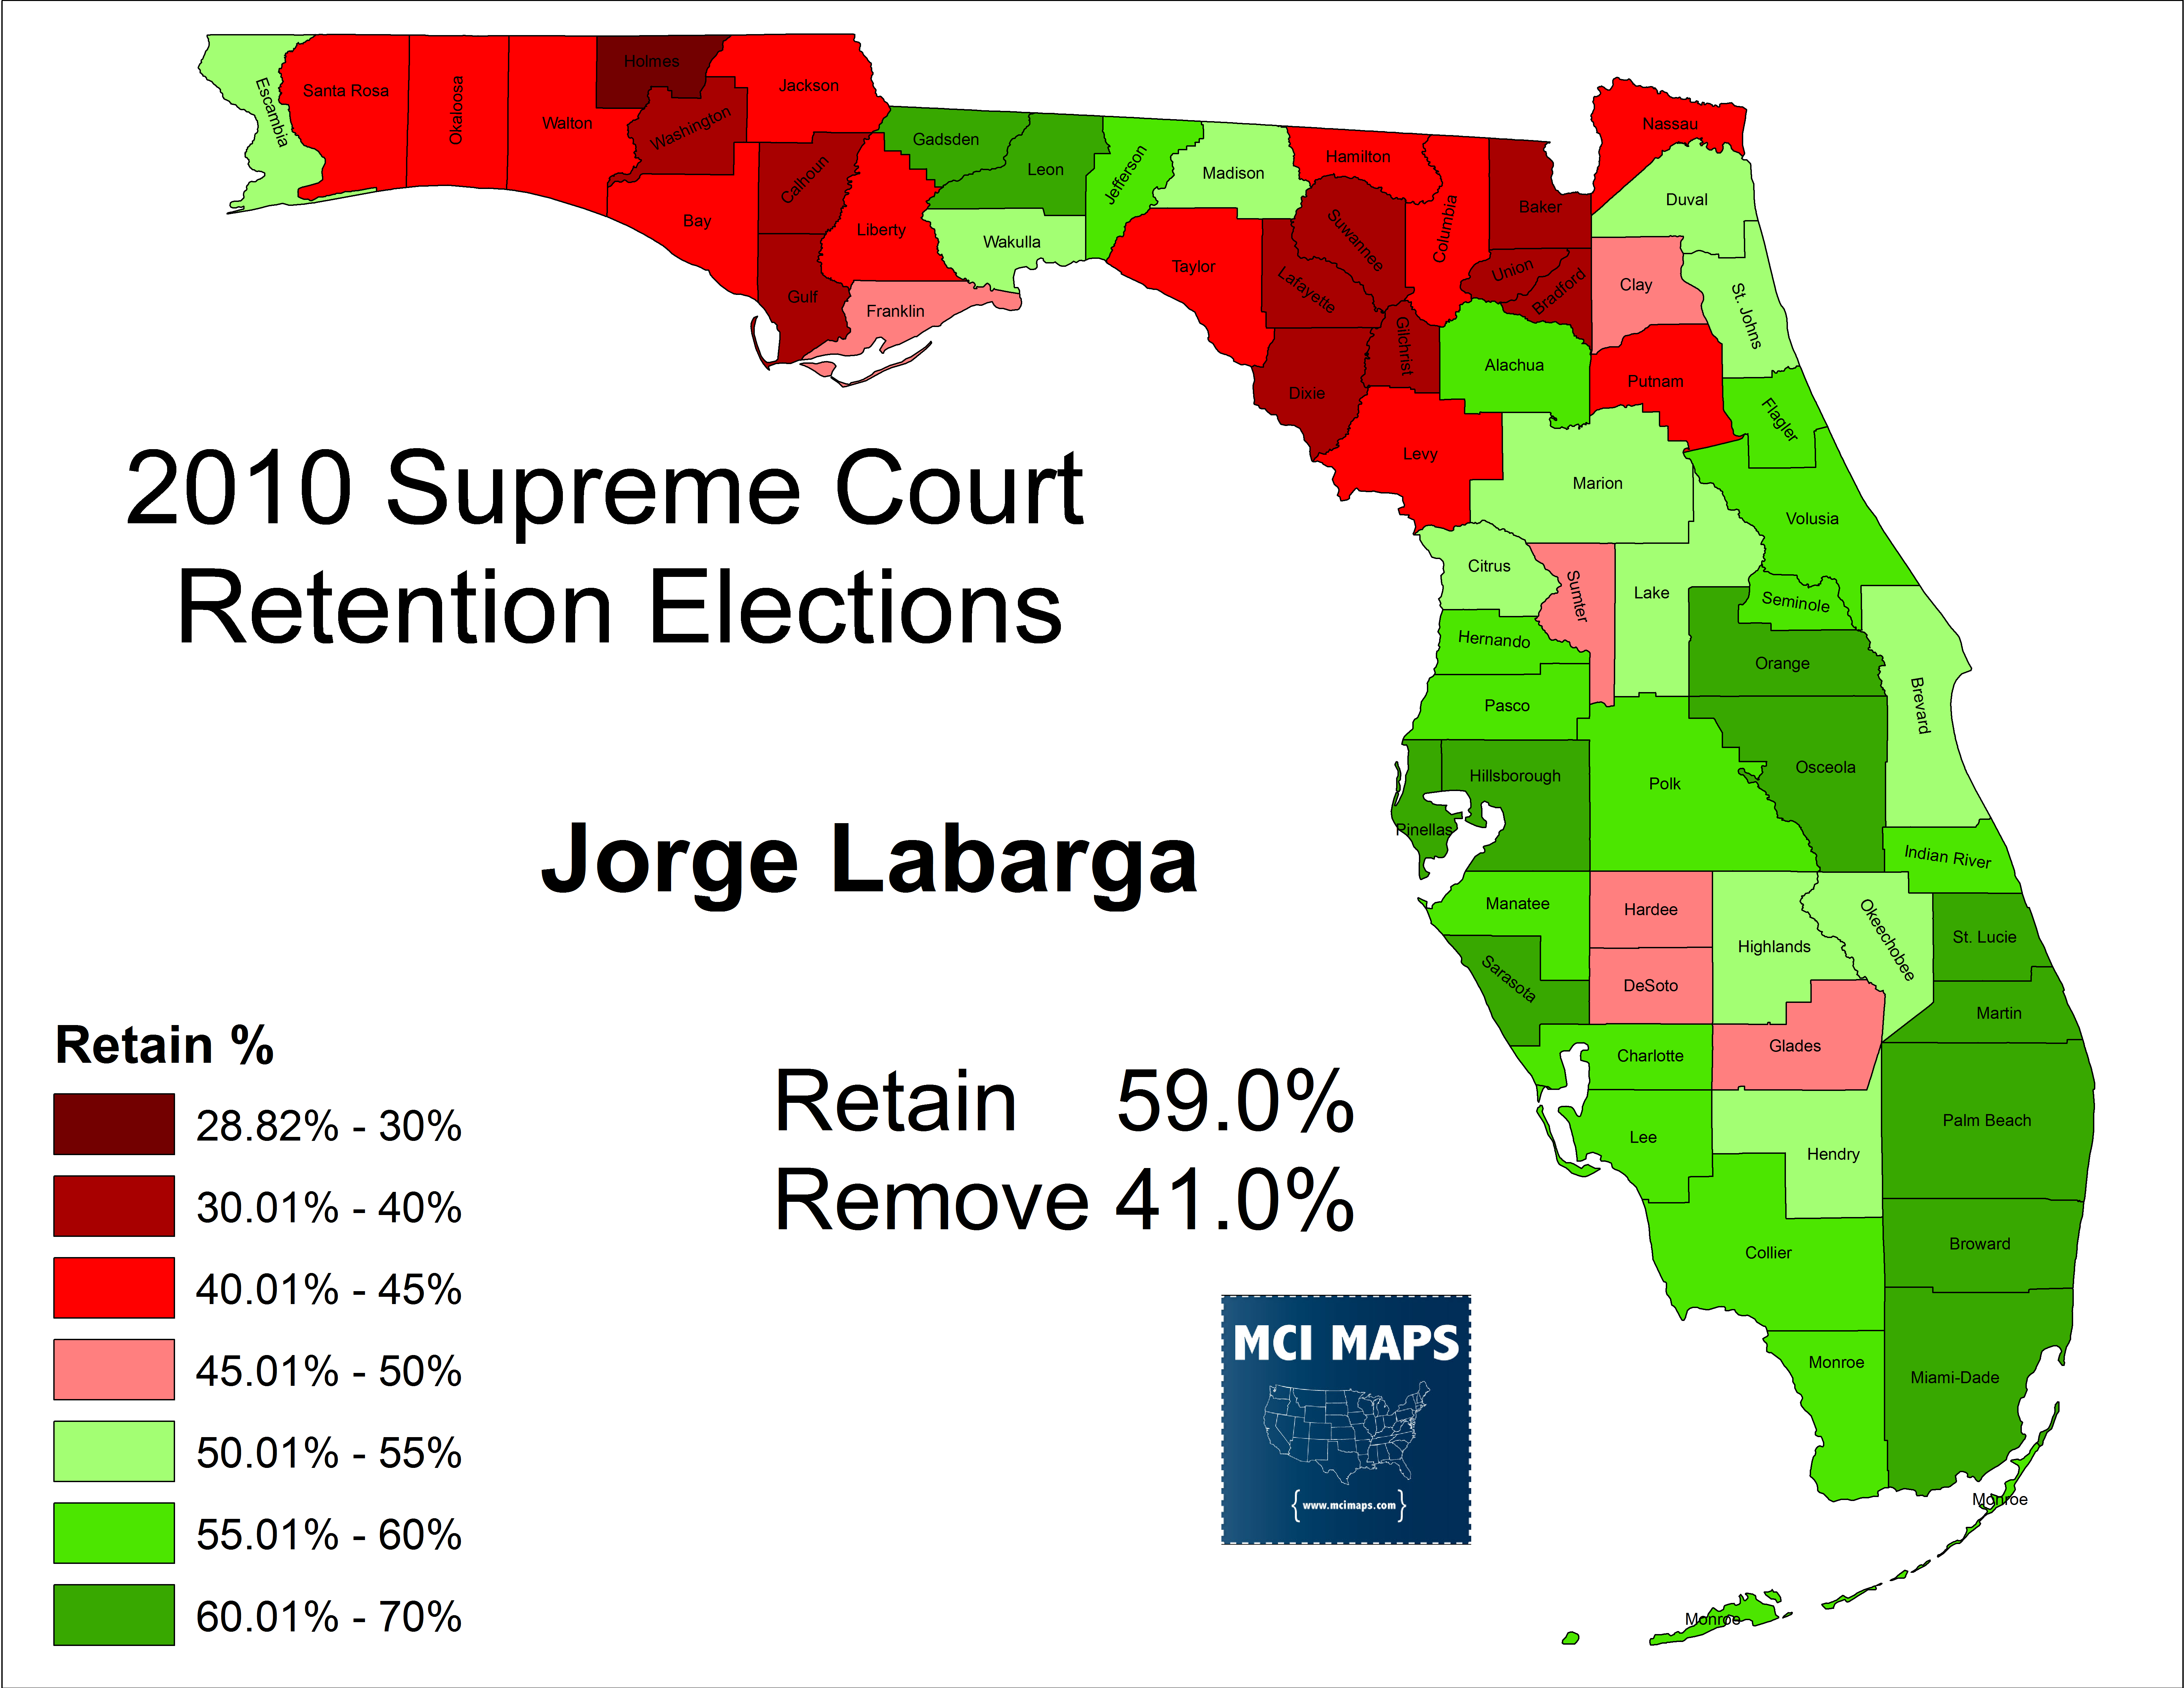
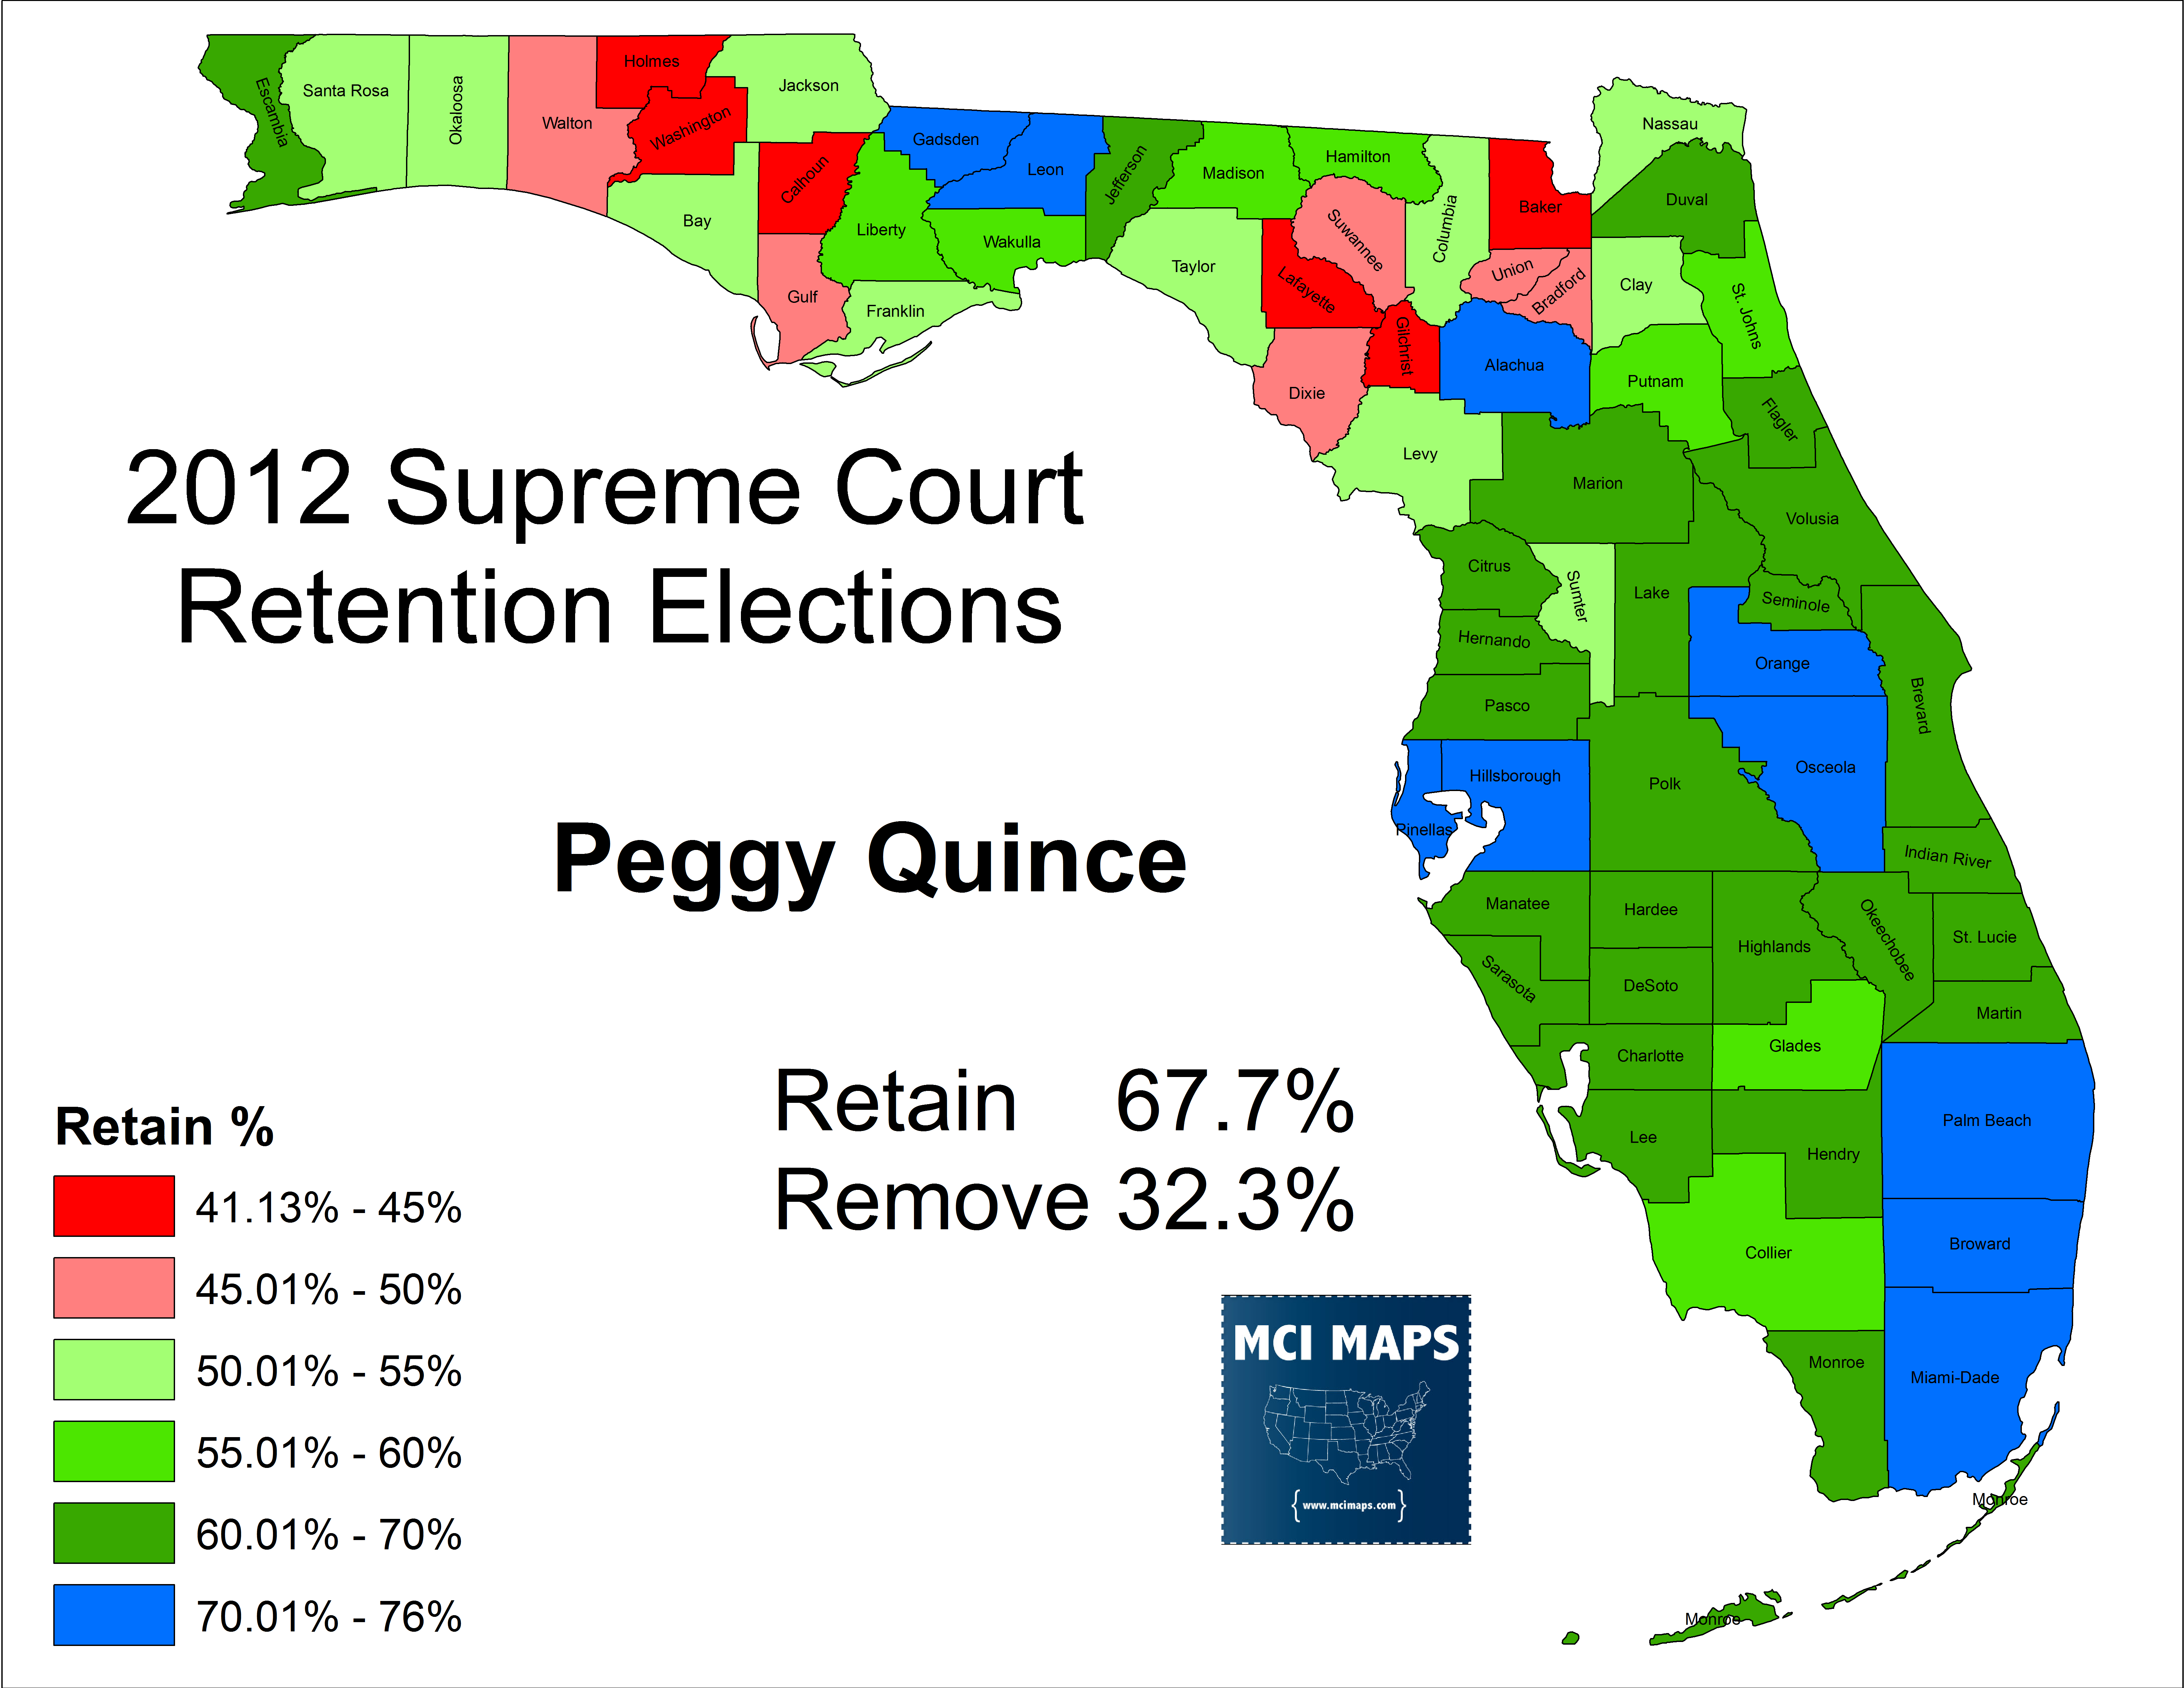
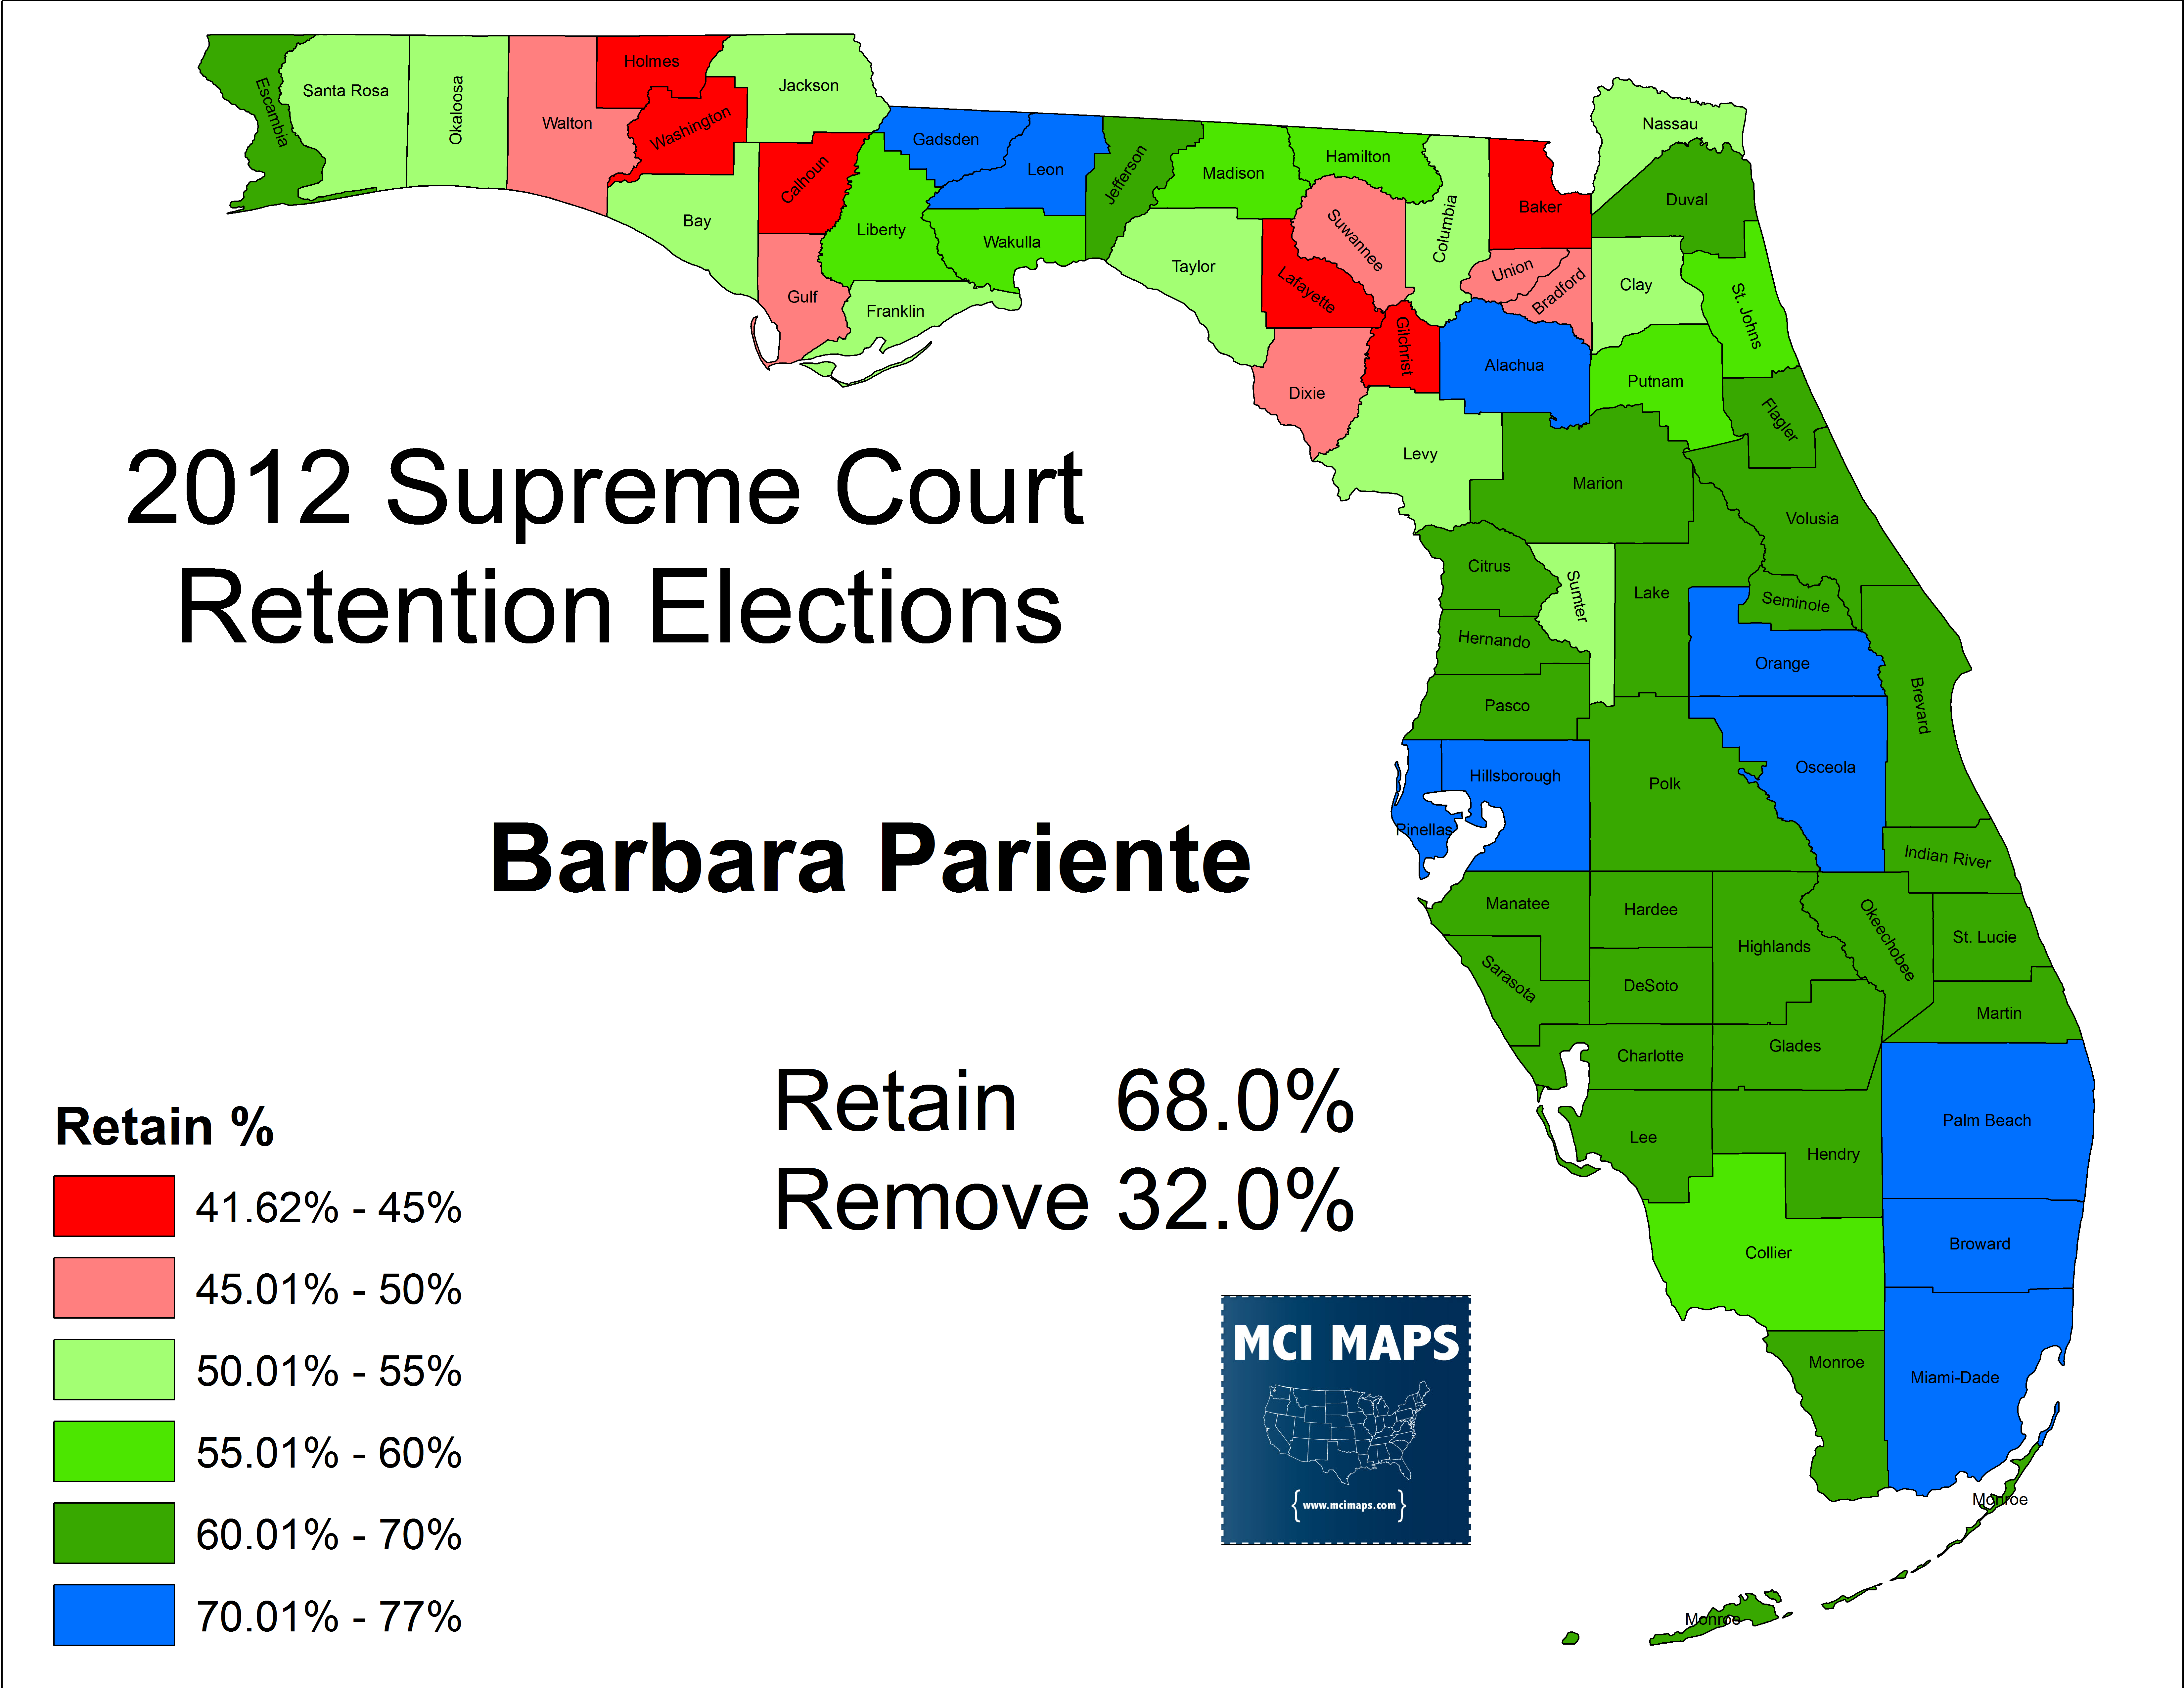
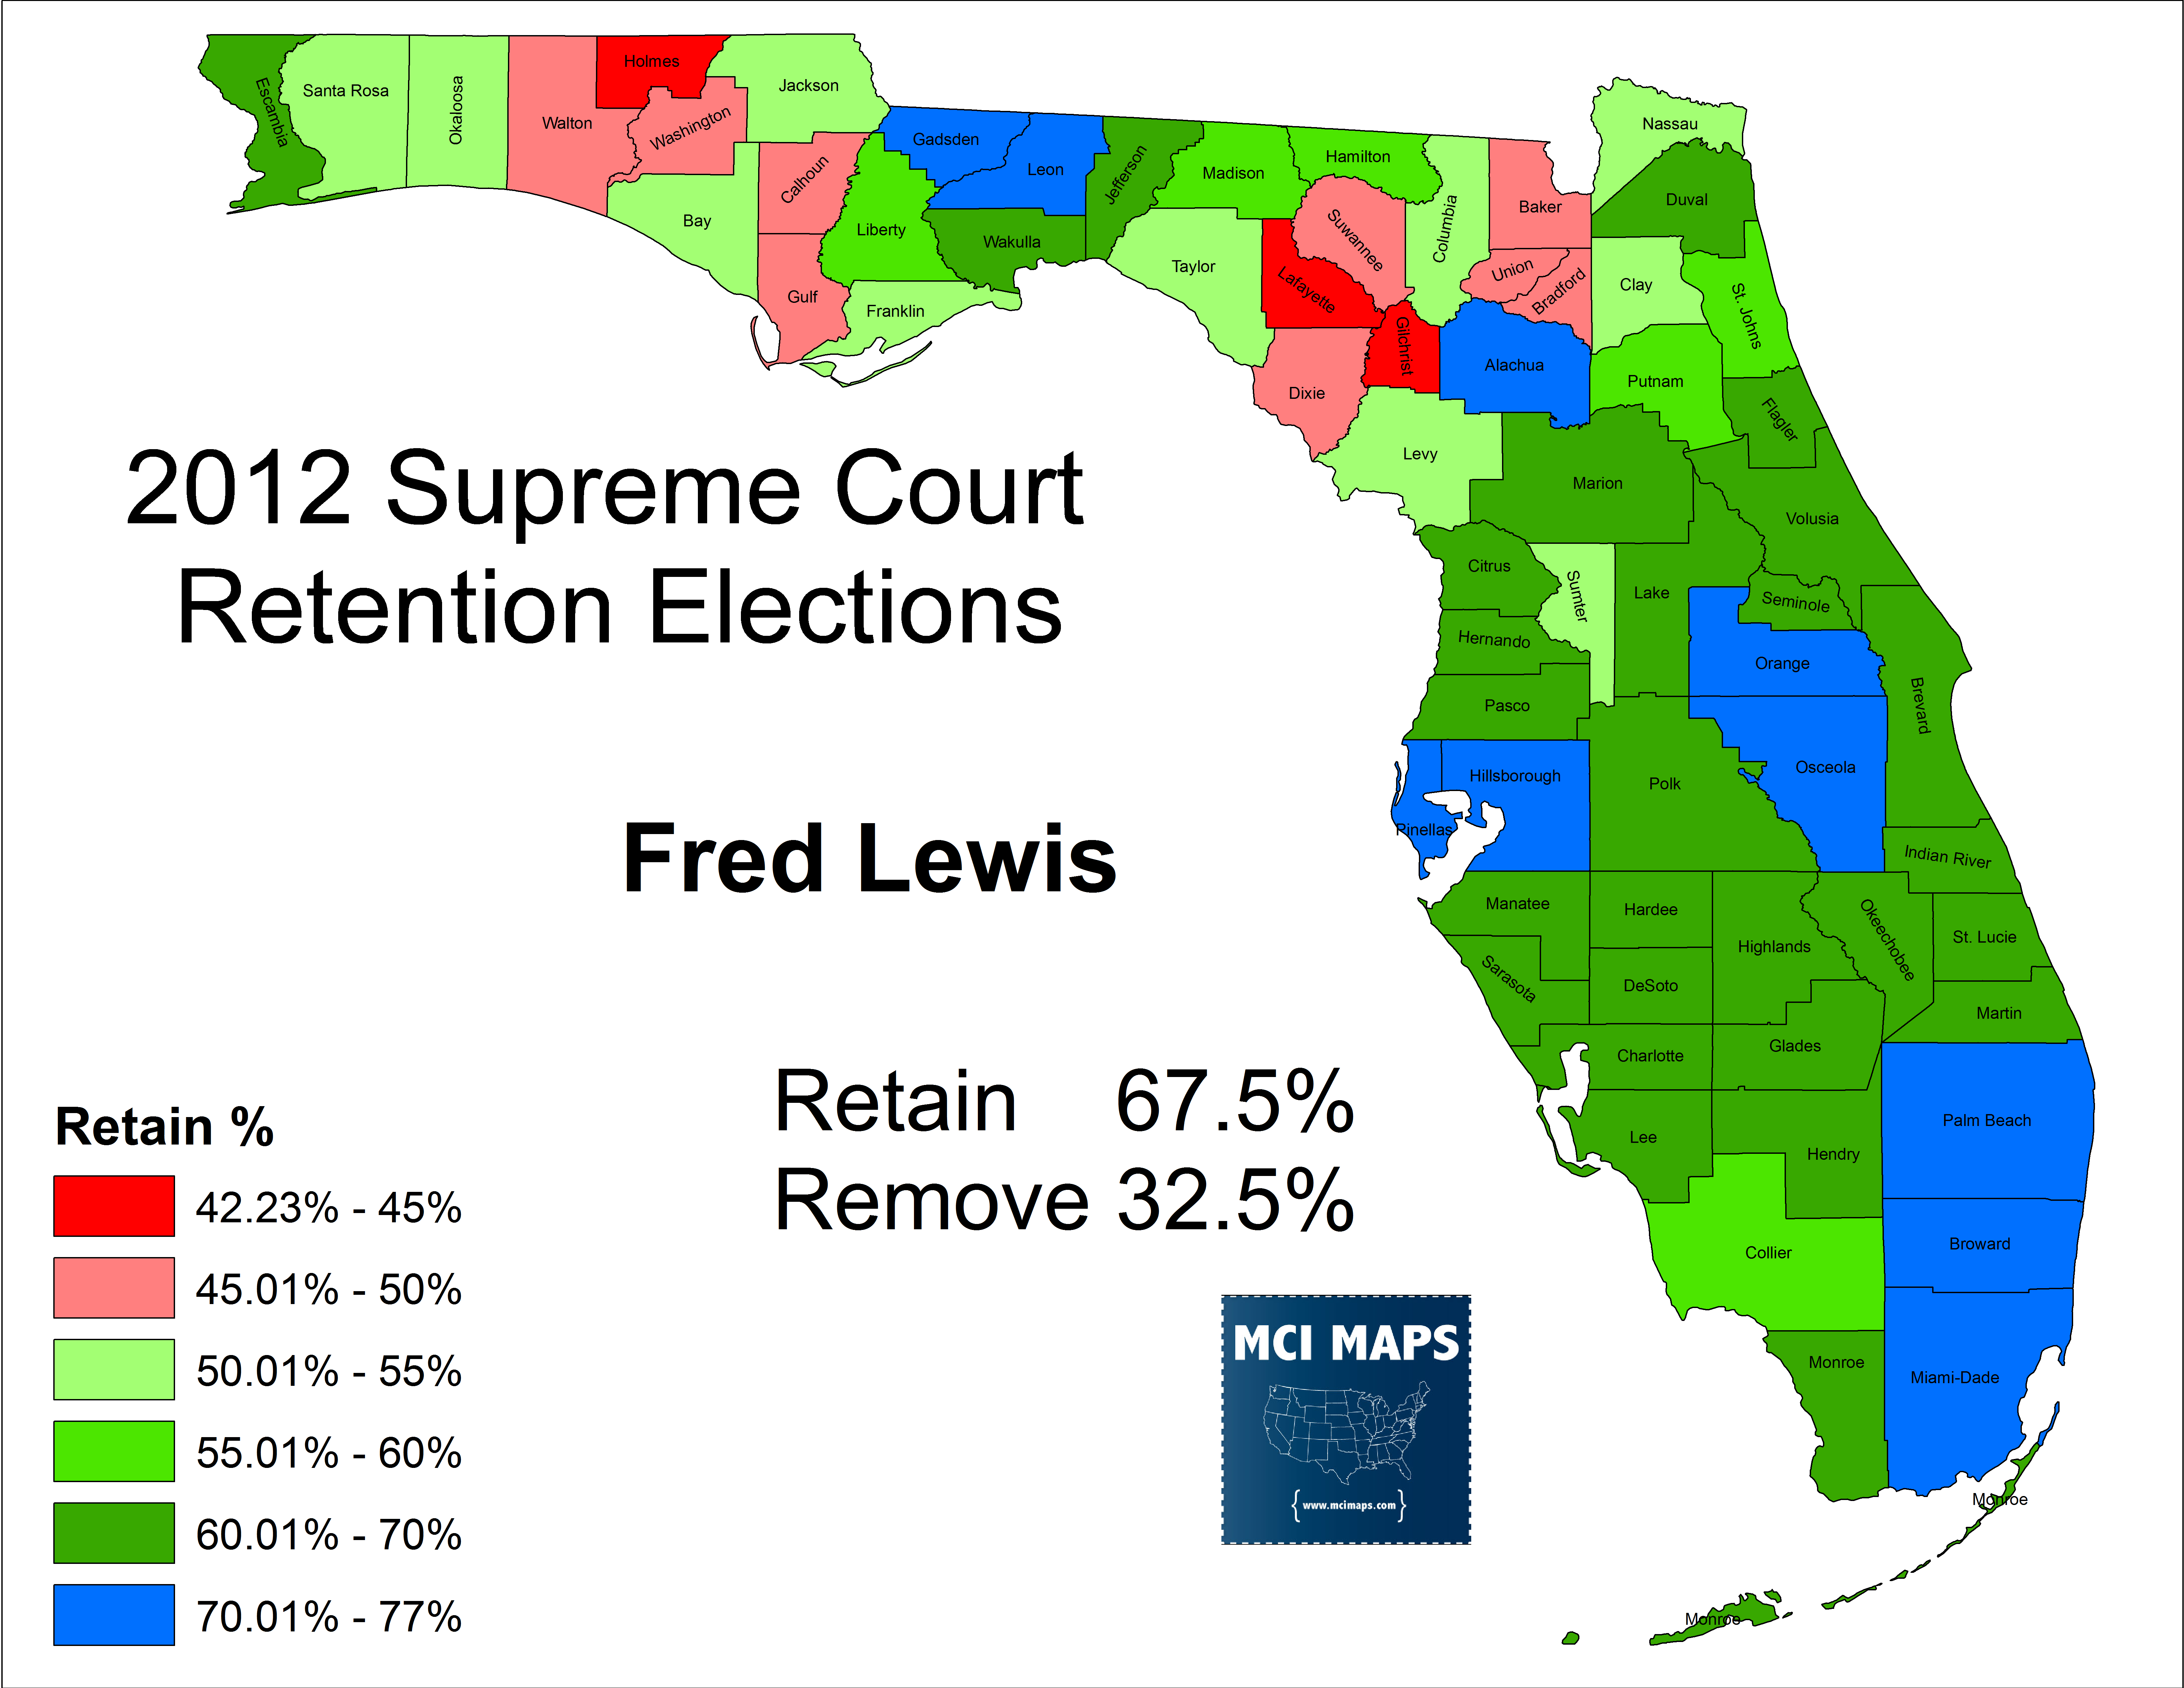
A very clear pattern is evident. The Southeast counties and their Democratic counterparts are very retention friendly regardless of the justice’s ideology. The suburban Republican counties (Sarasota/Manatee/Seminole/ext) also favor retention, hovering in the mid 60s, while rural, deeply conservative, counties vote narrow or against retention. Other counties have displayed stark disparities in retention depending on the year of justice. St. Johns, an upper-class suburban deep-red county, voted narrow for retention against the liberals in 2012 and more solidly yes in 2016 (but Labarga under-performed). The resistance to retention in rural Florida, especially the north, can be seen as a manifestation of the “throw em all out” attitude.
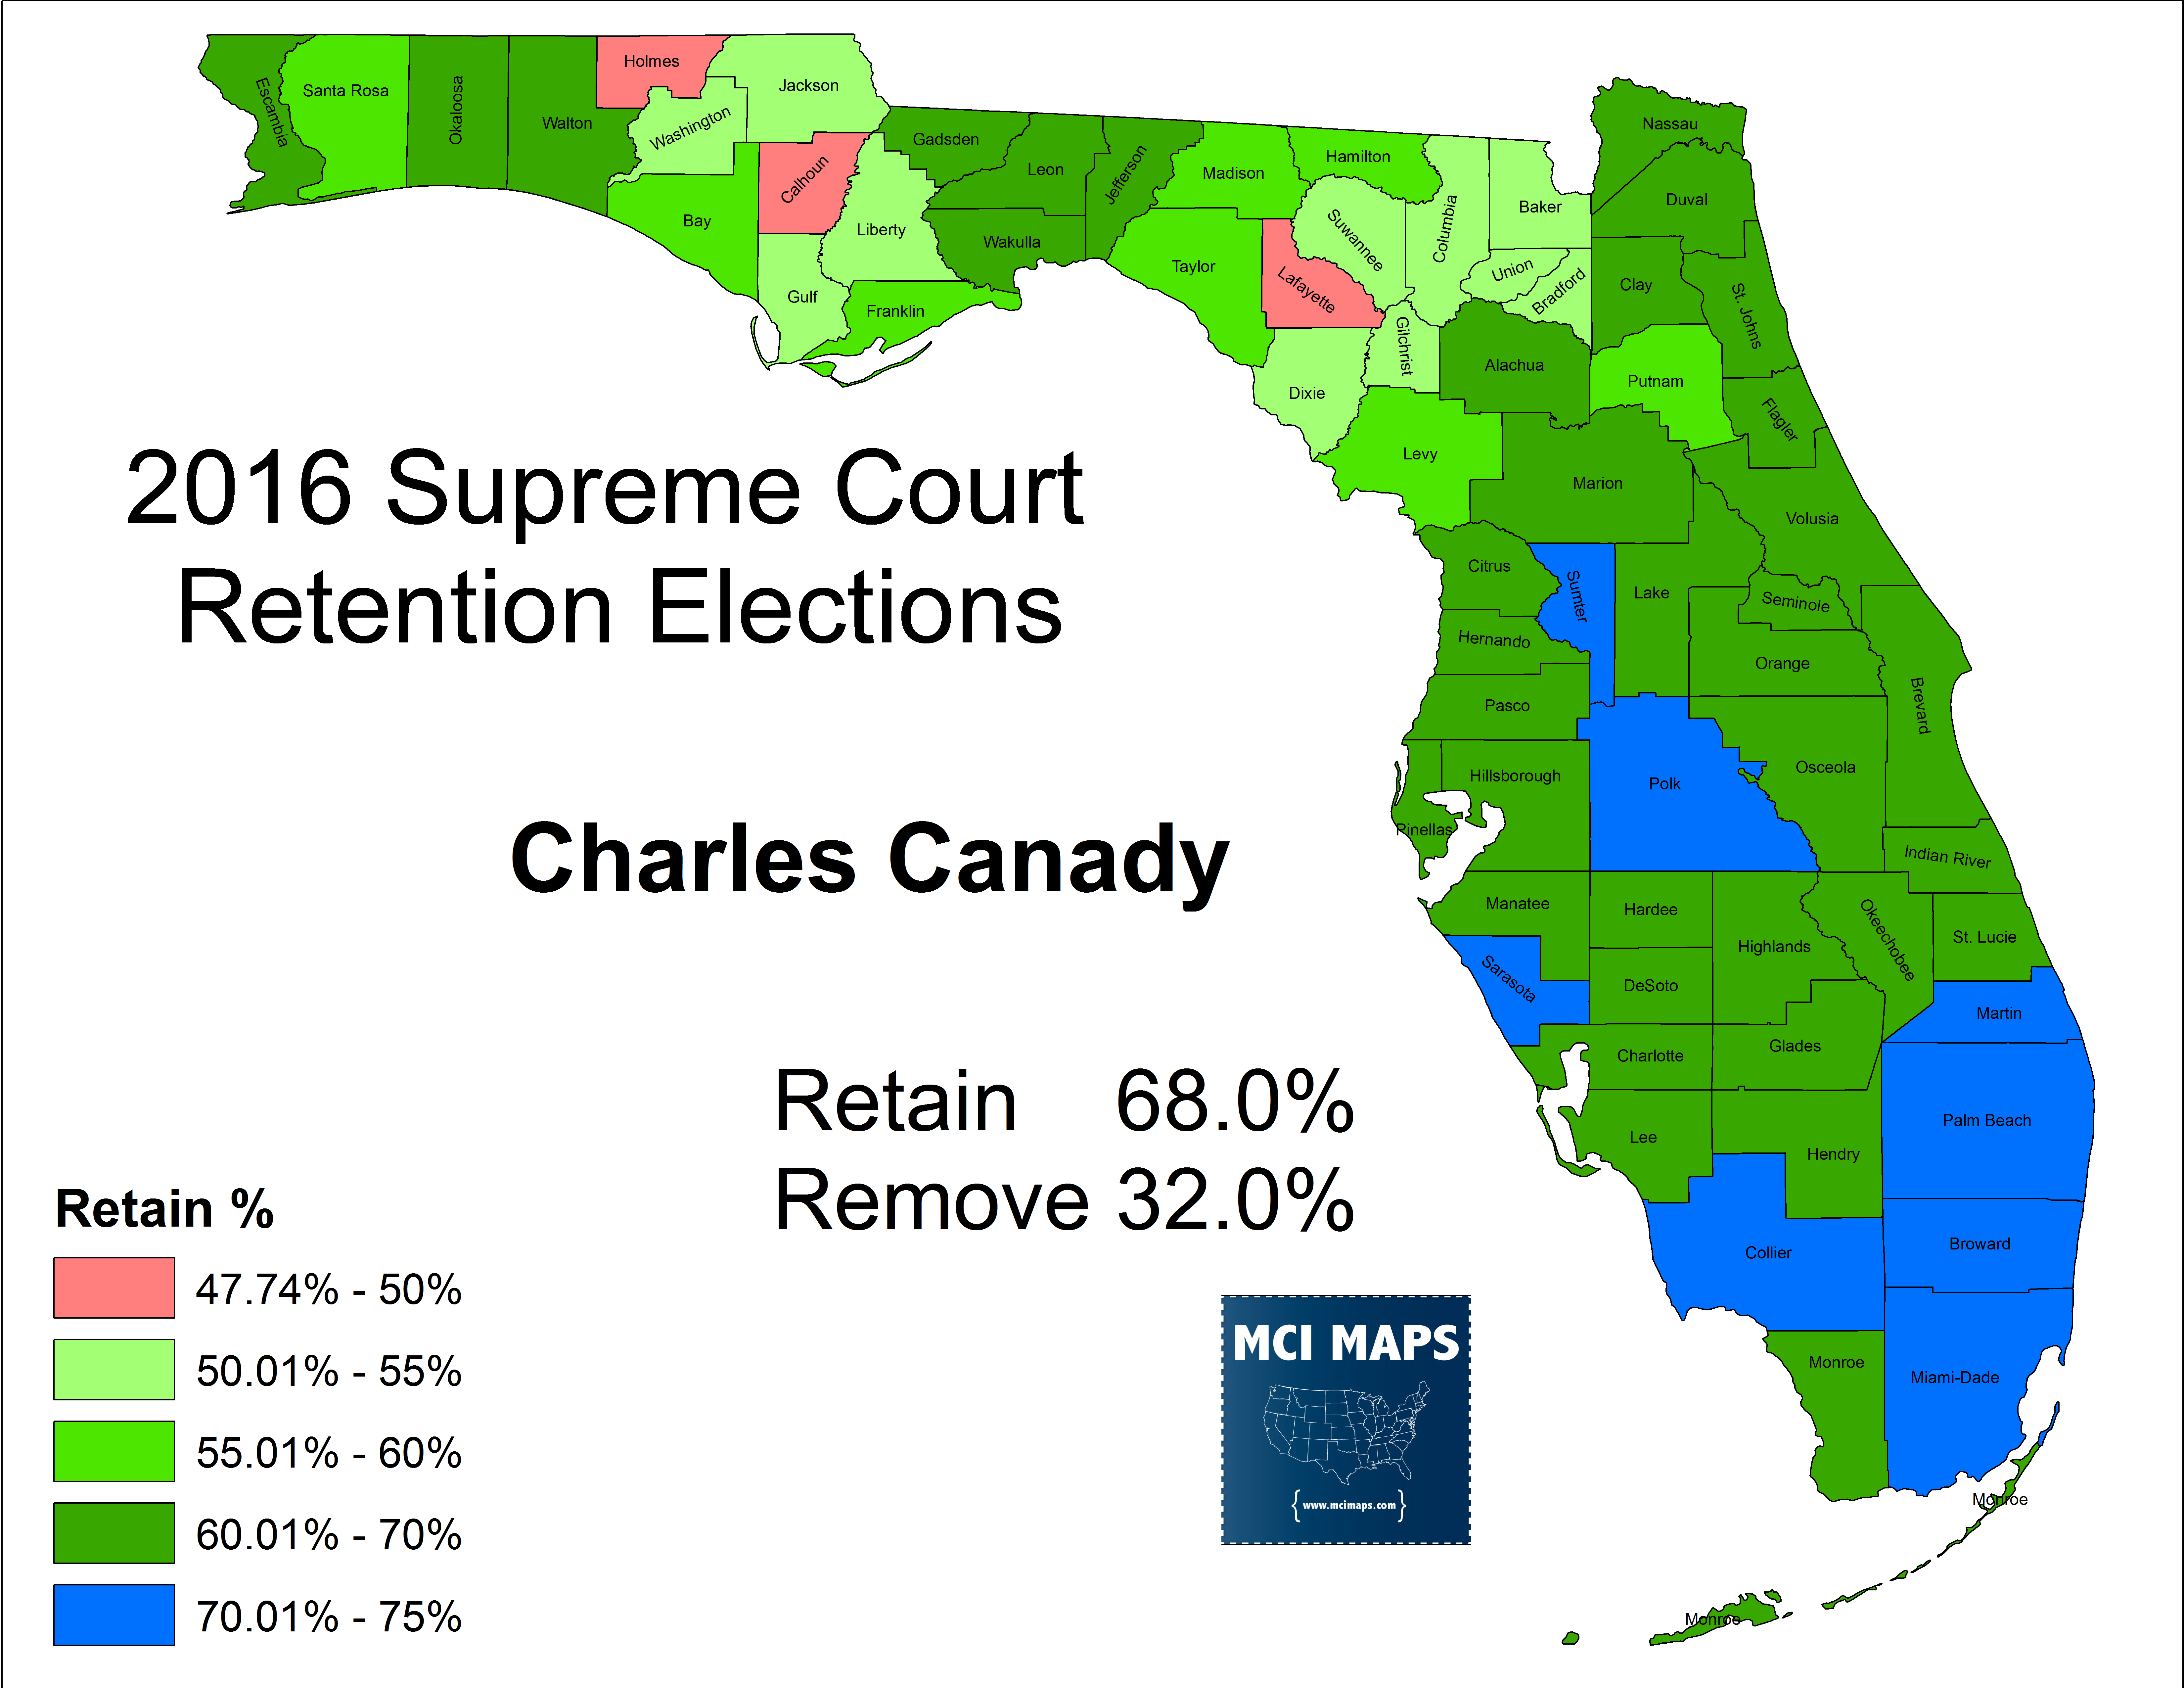
Voter’s often hear little about justices. Justices being actively targeted as been reserved for the liberal bloc while conservative justices have not faced major organized efforts to oust them (aside from political blog posts and scattered local slate cards). This creates a weird scenario where Justice Canady, a conservative on Trump’s pre-election shortlist for the Supreme Court, does better in the Southeast Democratic Counties than he does in the rural North FL counties.
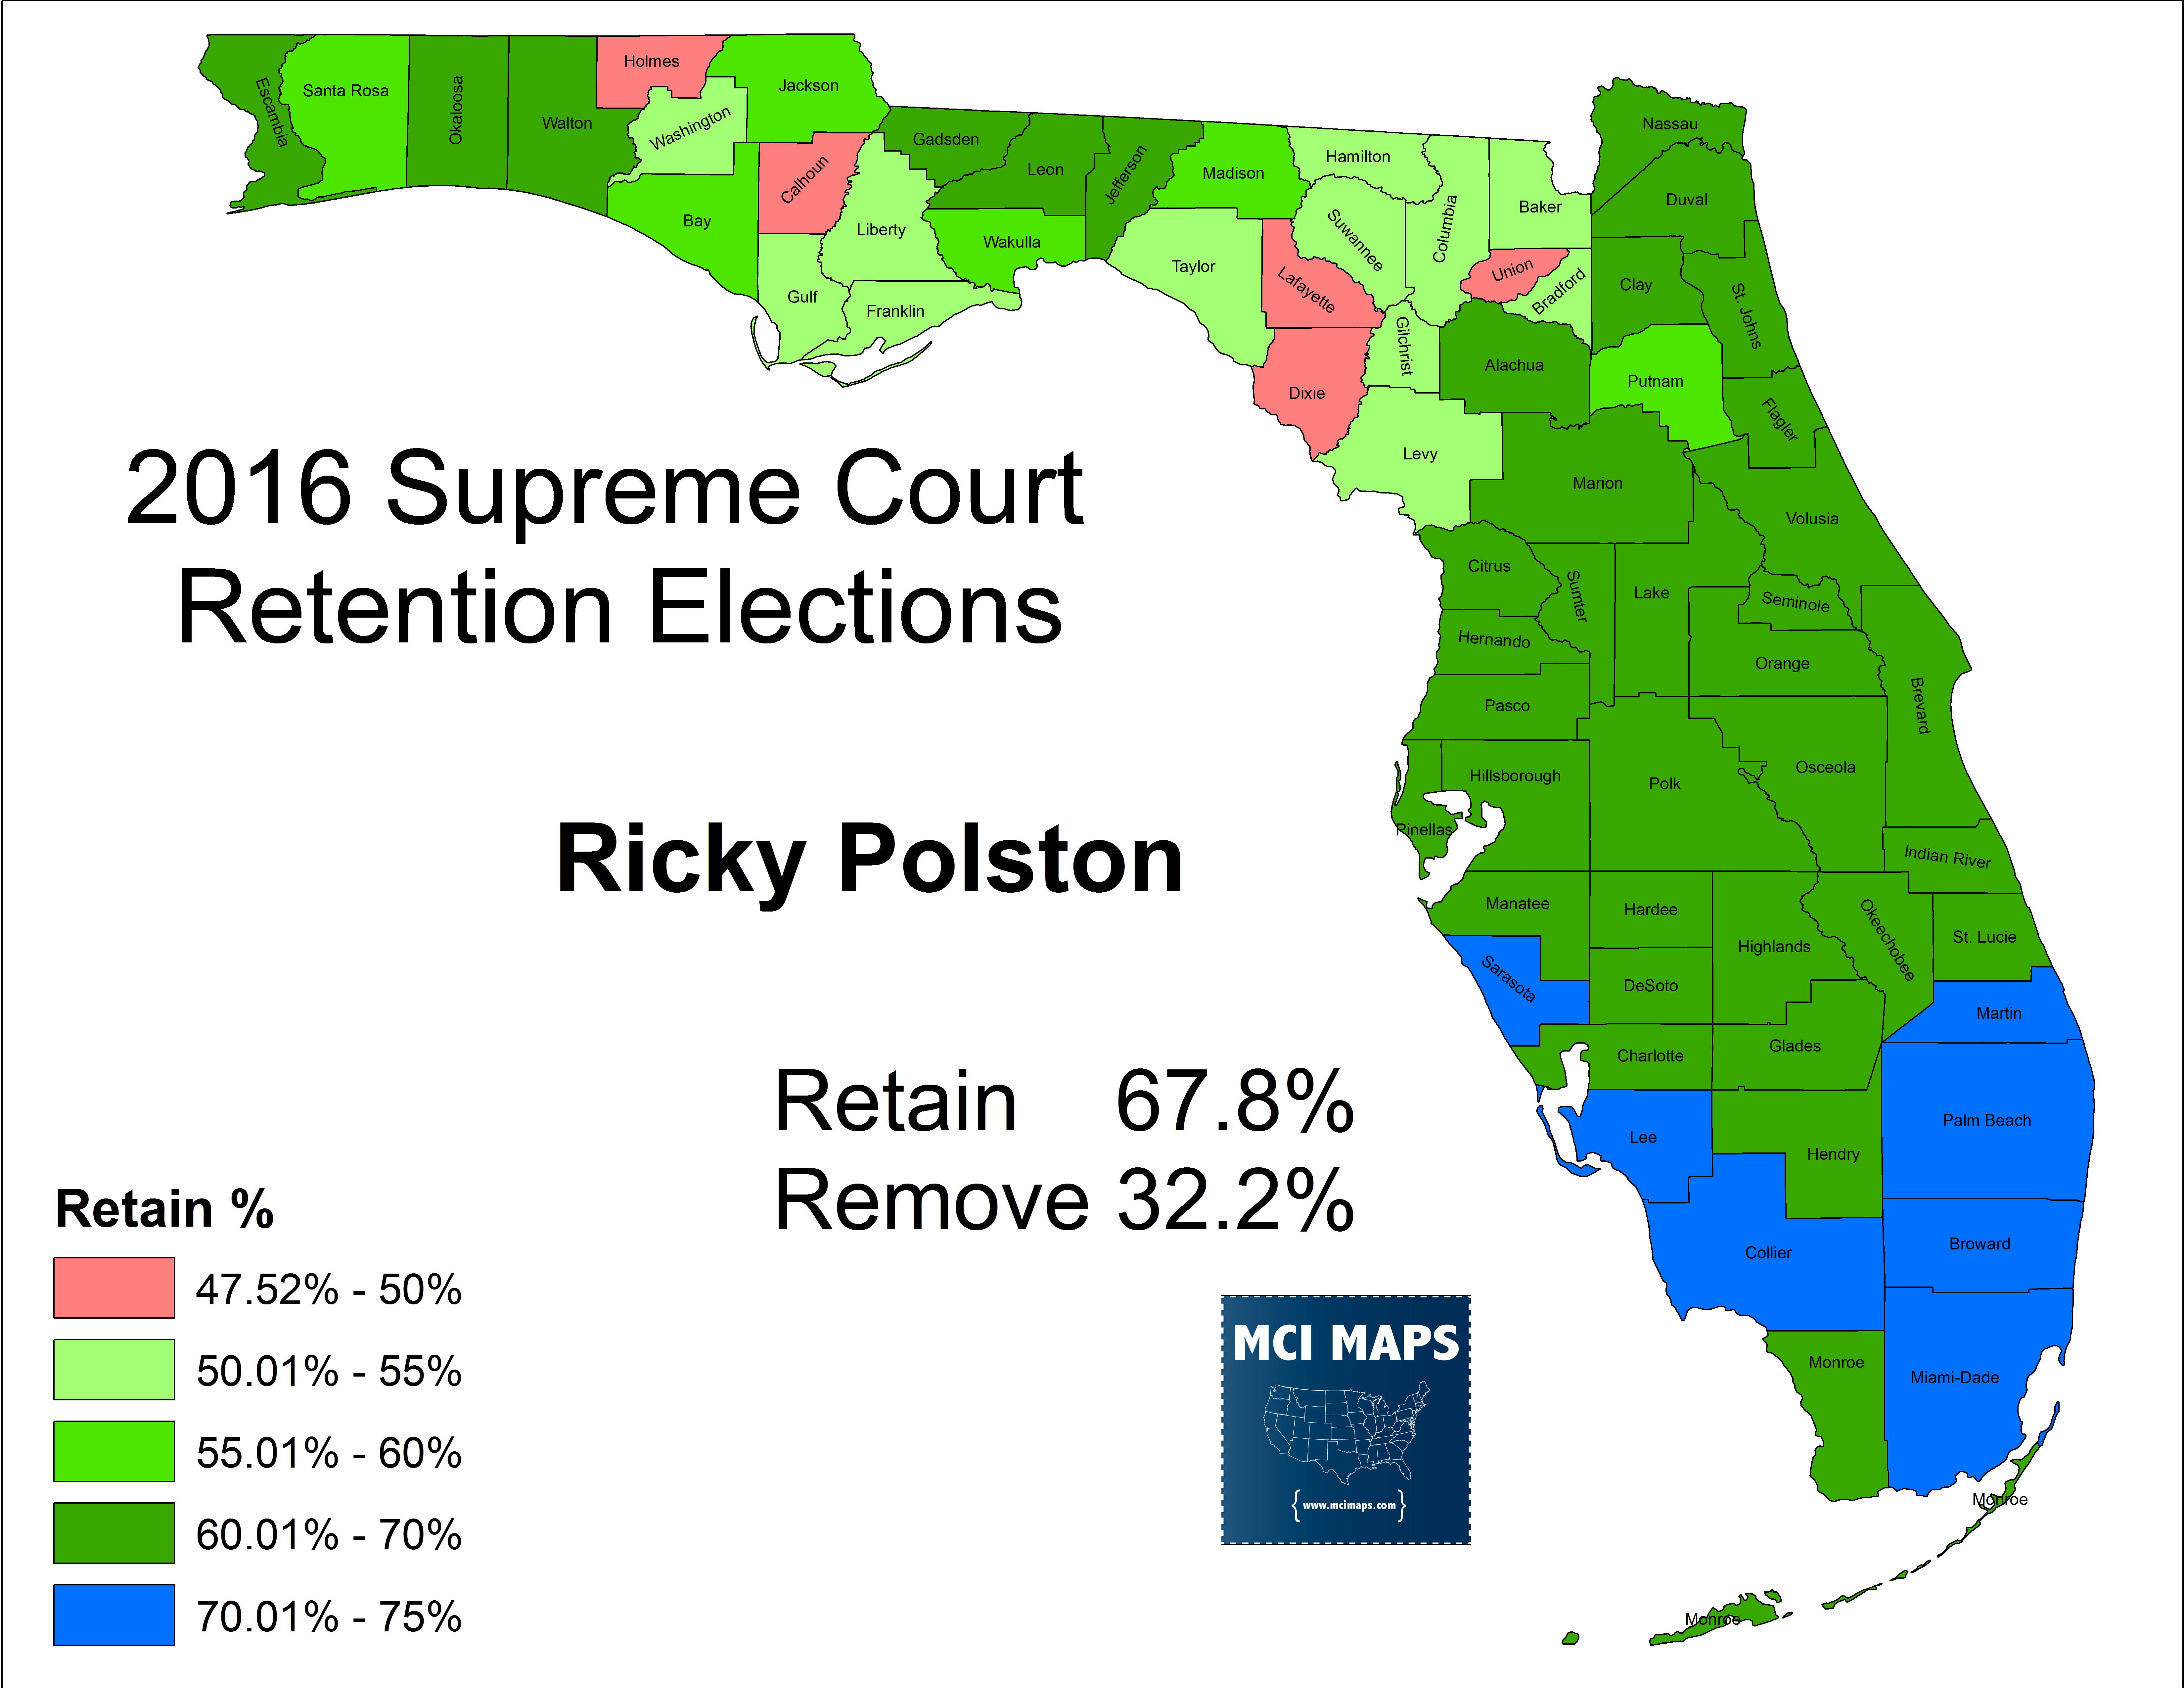
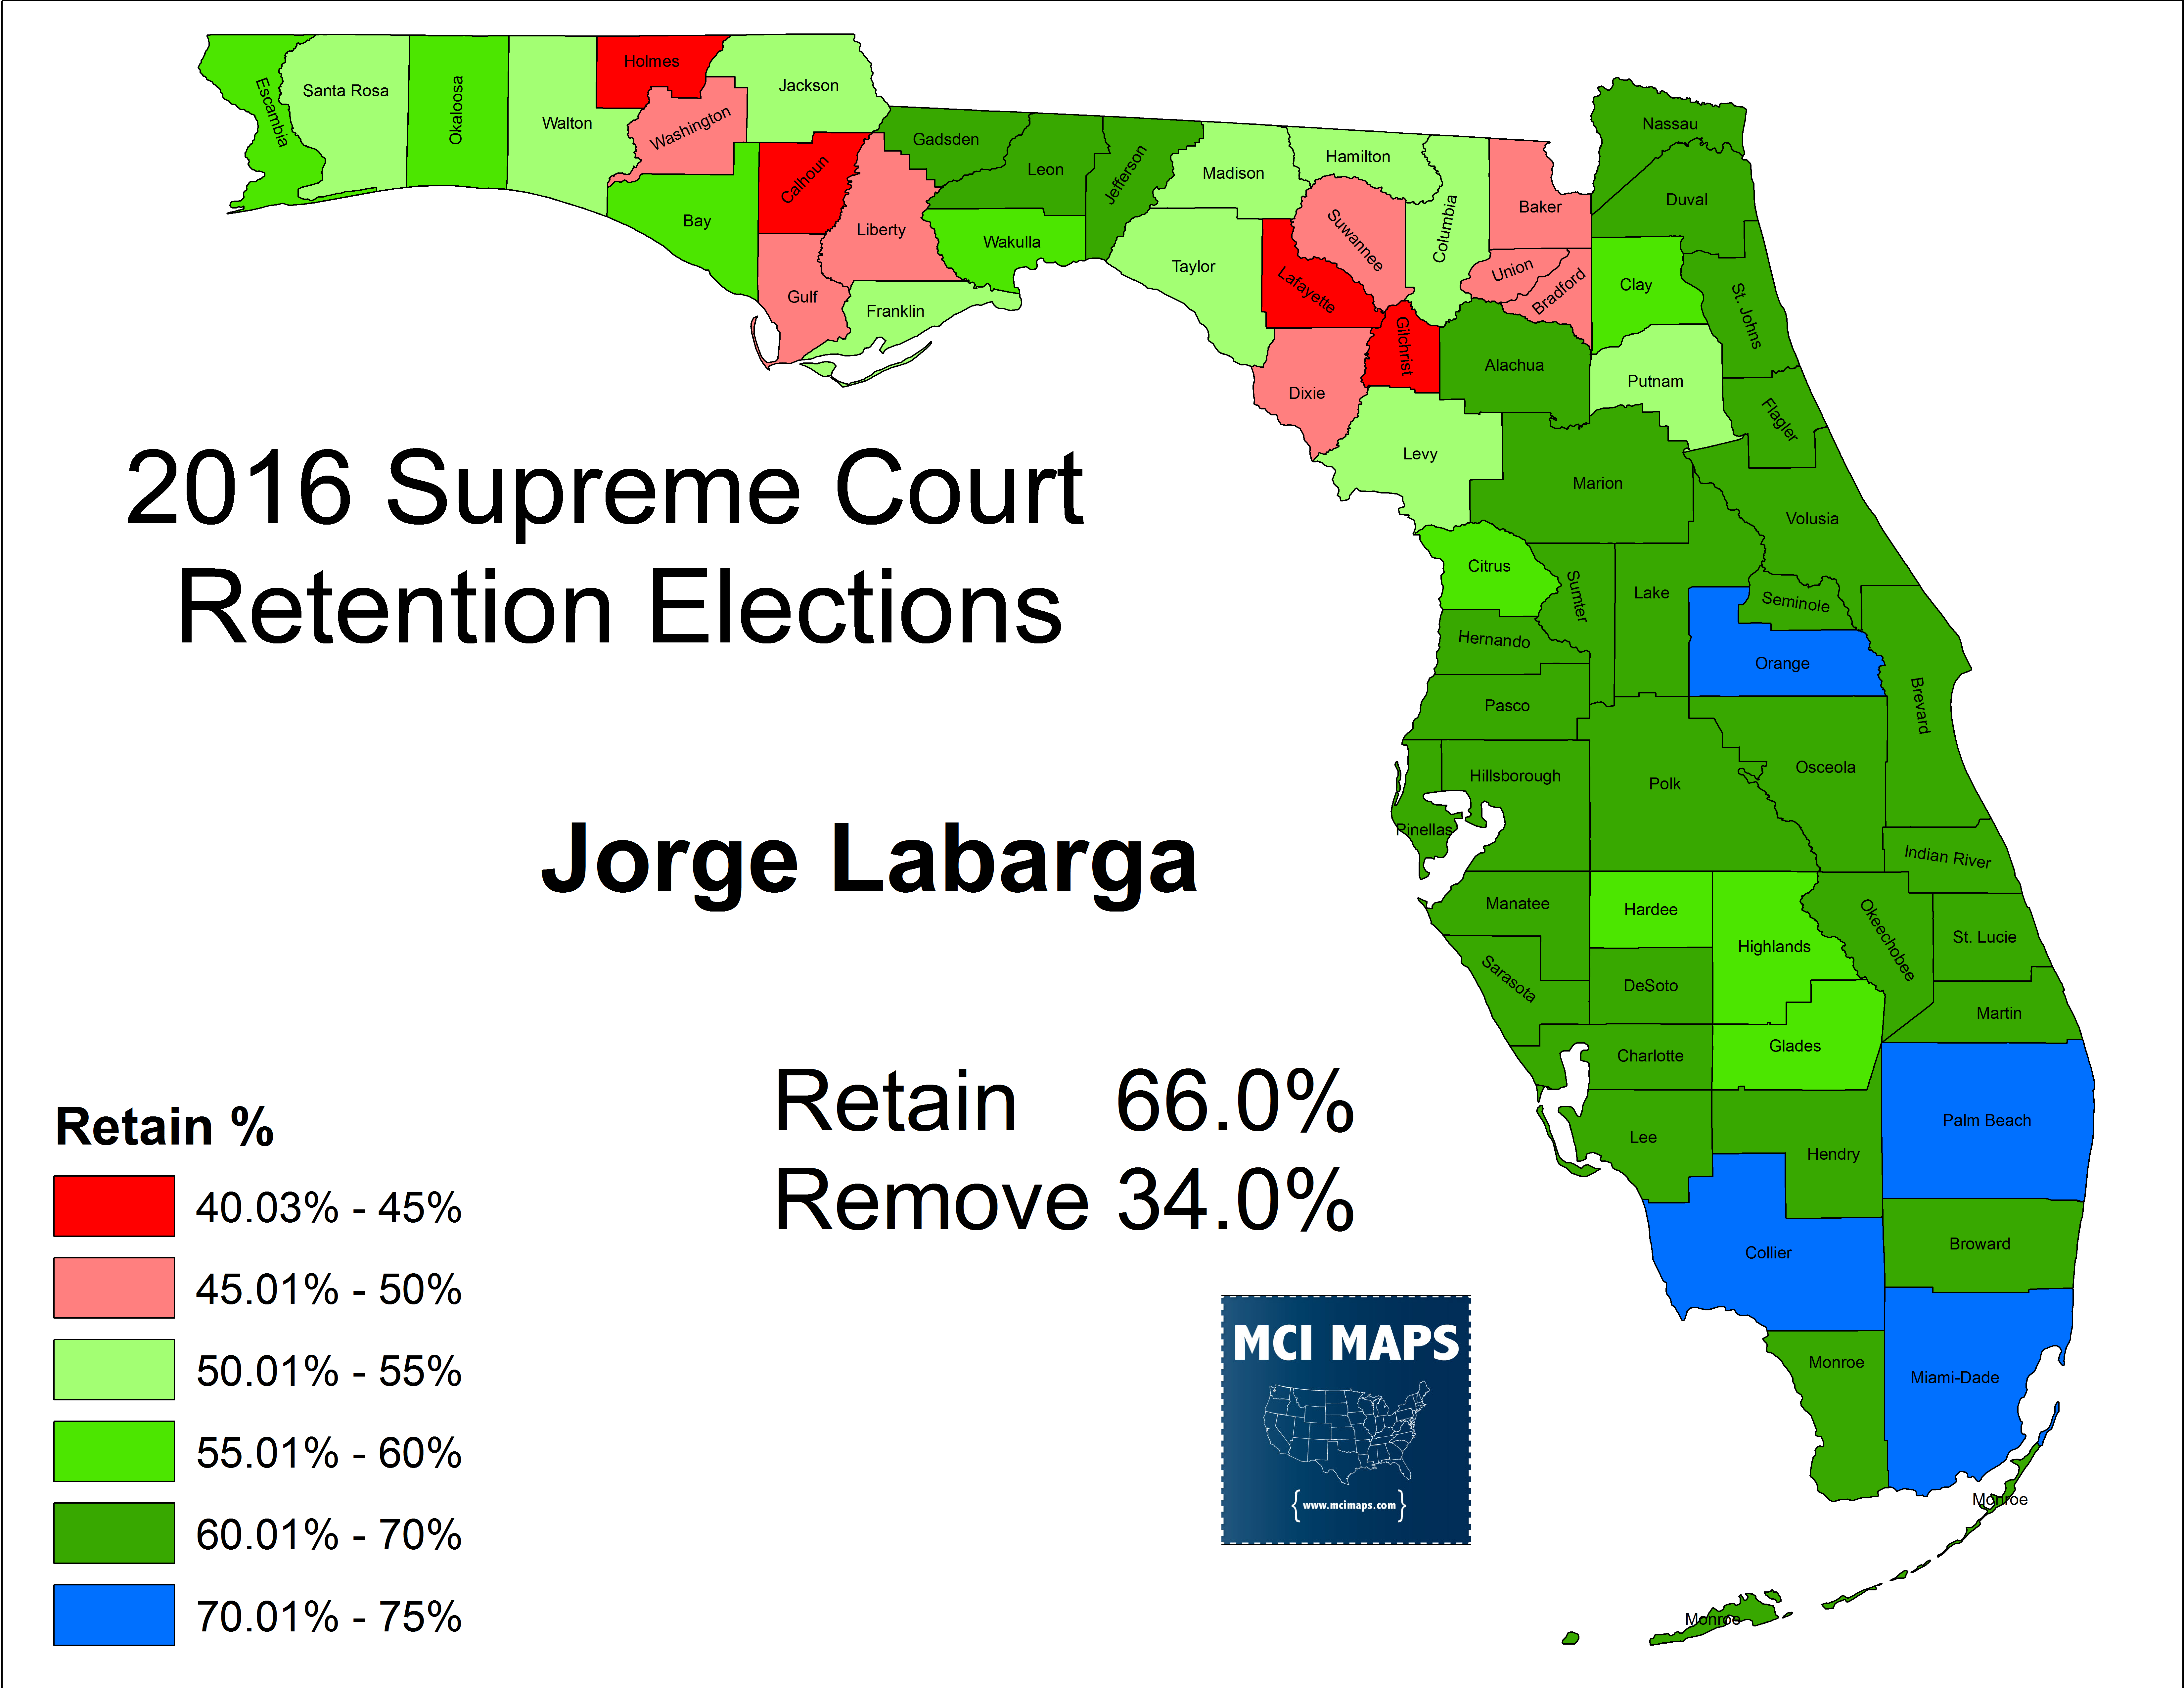
The 2016 group of Justices saw Polston and Canady, both conservatives, and liberal Justice Labarga easily retained. Labarga under-performed Canady and Polston by a few points overall, but by alot in other counties. Labarga’s precinct map is below.

Labarga lost across the North but did very well in the Southeast and big urban centers.
Canady’s retention, only 2 points higher than Labarga, saw alot less red in the North with similar strong showings in urban areas. The difference between Labarga and Canady was much more evident in the counties with weaker retention averages than the urban counties that often vote for retention overwhelmingly.
Labarga was more targeted in 2010 than this time. However, he was still subject to attack on right-wing slate cards and the effects of attacks from six years ago may have sat dormant in voter’s minds. Canady outperformed Labarga across most precincts of the state, but much higher in rural precincts. Labarga, meanwhile, did better than Canady in diverse precincts.
A large question that comes up is race. Was Labarga, who is Hispanic, hurt by racism? Labarga’s under-performance in conservative areas make racism and easy answer. However, Labarga’s troubles with conservative groups before cannot be discounted. Overall Labarga under-performed across most of the state, including areas with little racist sentiment. Labarga’s larger fall in rural precincts could be partially explained by racism as well as conservative attacks. Labarga’s strength over Candy in diverse areas could be partially attributed to his ethnicity (a general desire of non-whites to back other non-white candidates in retention) as well as scattered local liberal/democratic slate cards that advocated defeat for Canady (which are often passed out in super-diverse and hence super-democratic areas). 2016 saw scattered campaigns and efforts to oust any justice were more localized, depending on the groups in the area. Getting a stronger picture of the more localized efforts to oust either justice (which could explain some of the gap) would require a much more time-consuming endeavor.
The Appeals Court Retention
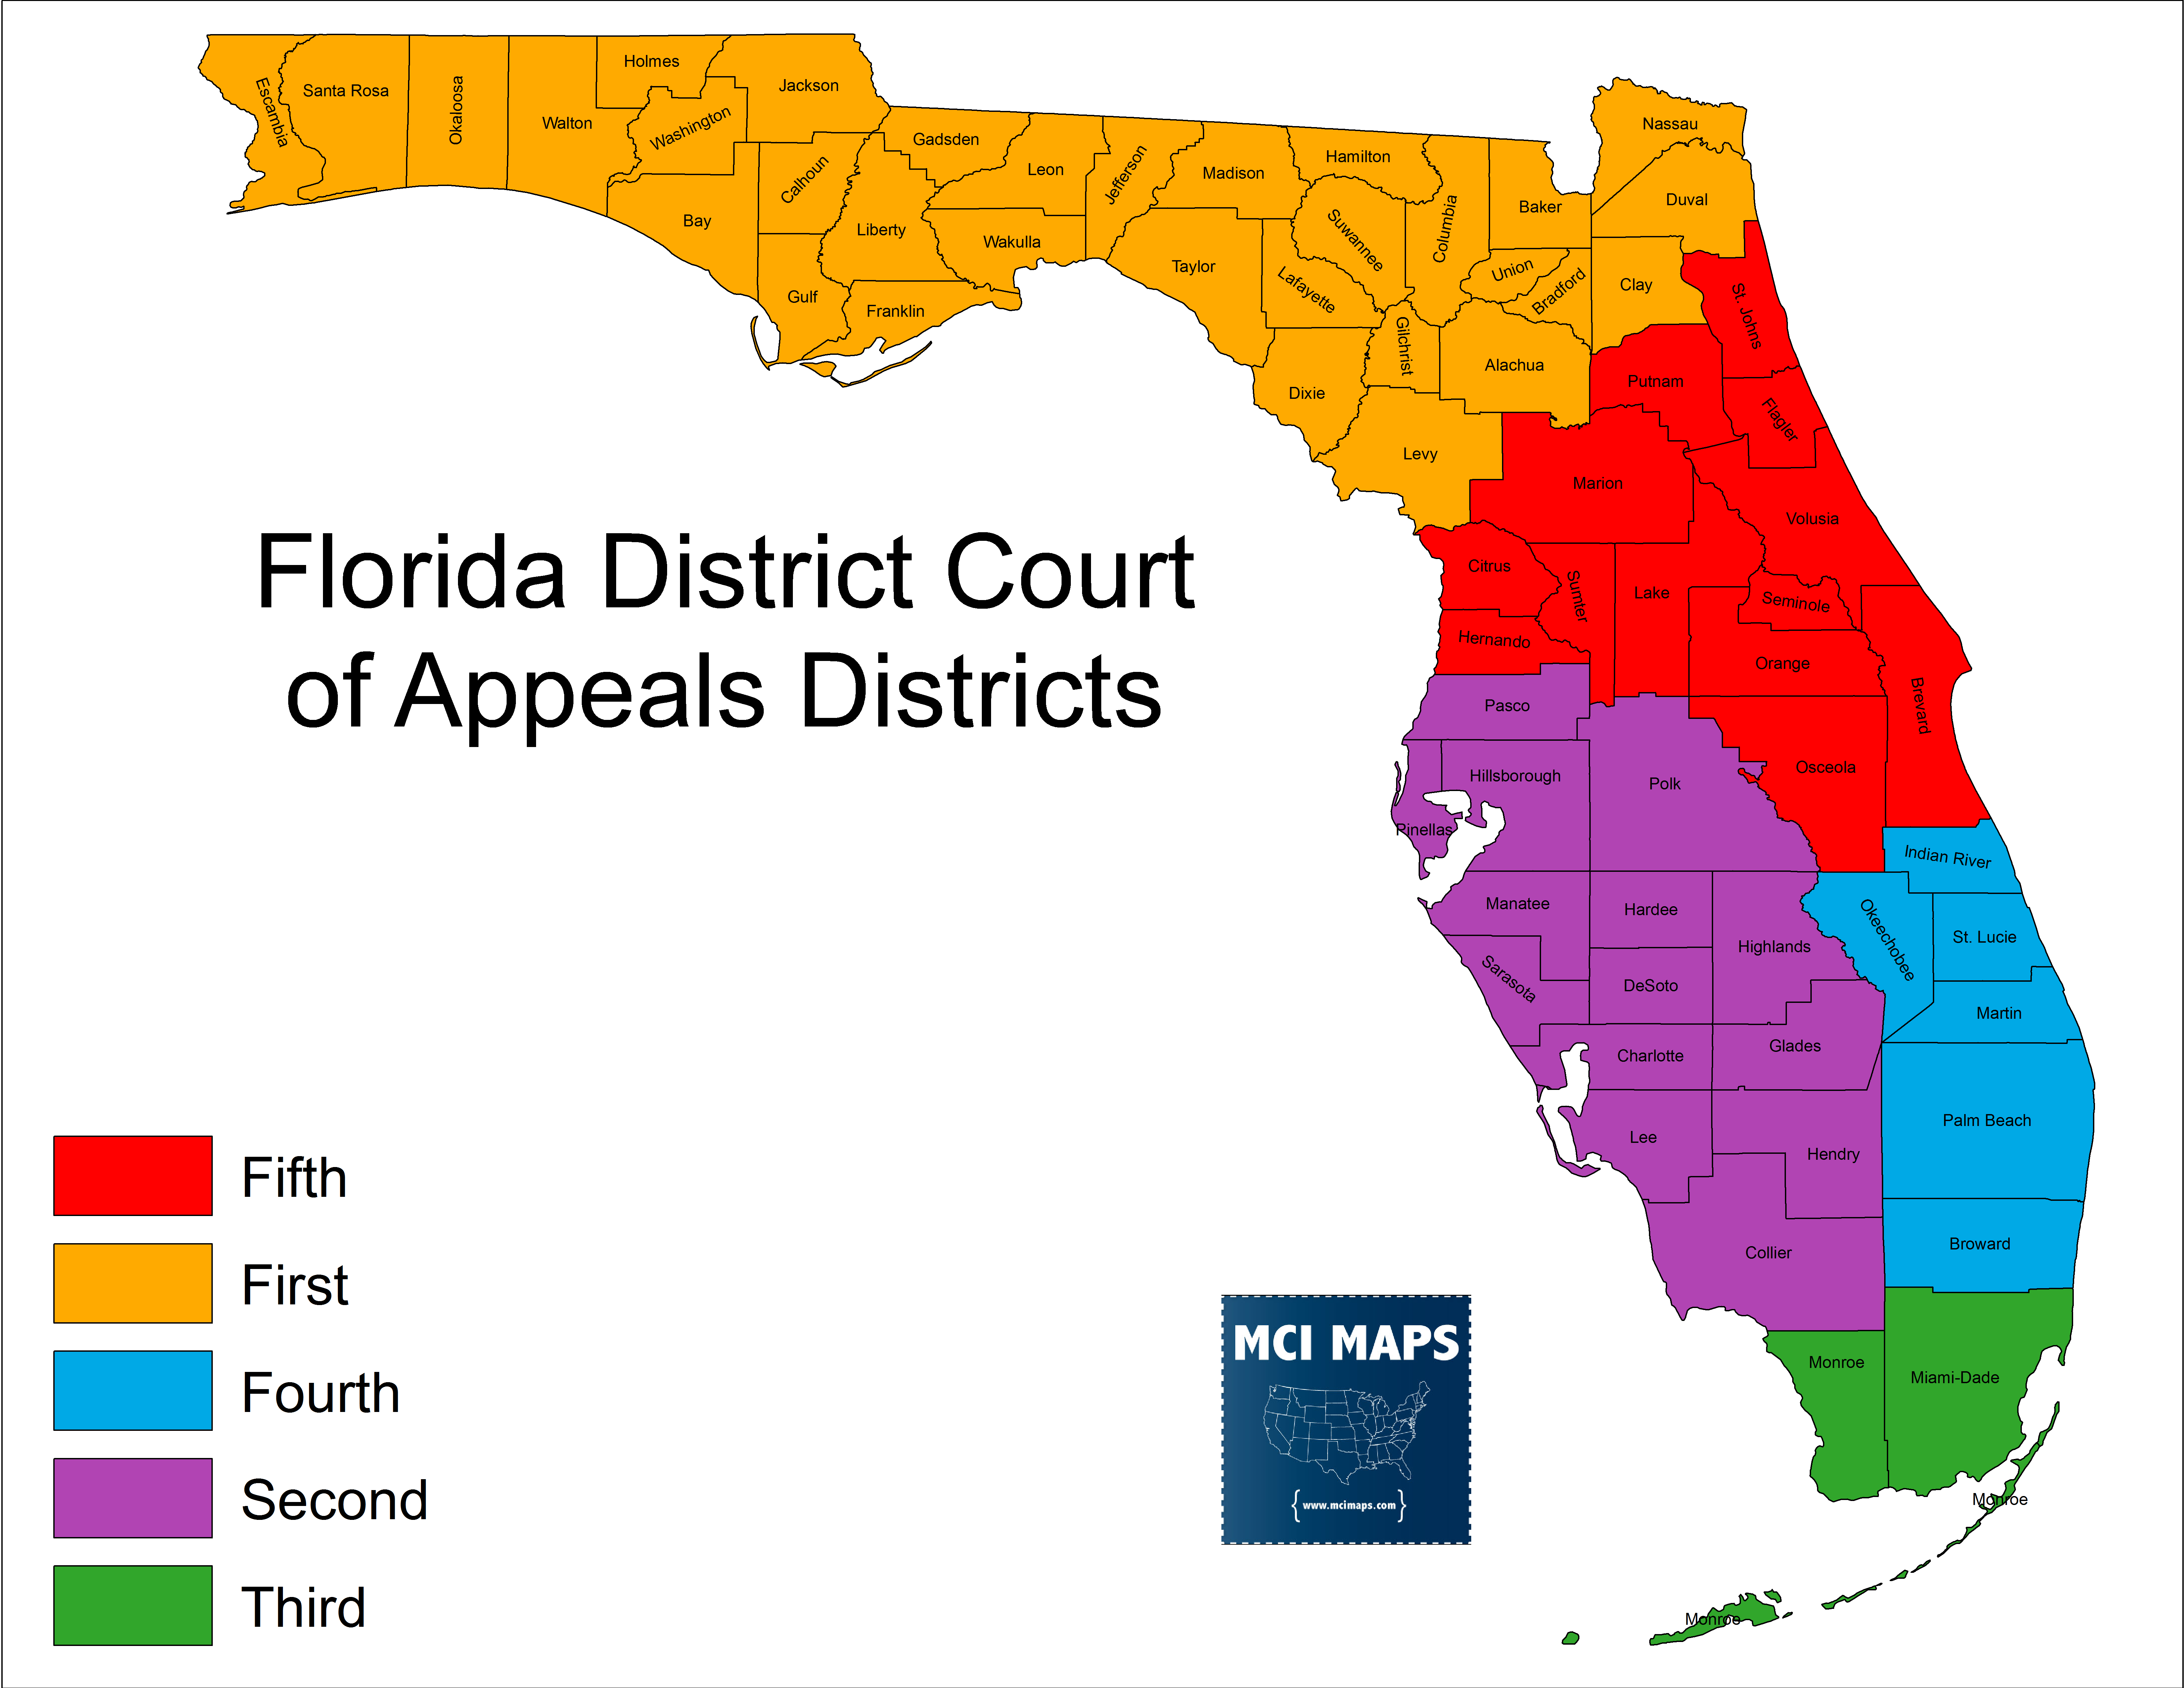
Supreme Court Justices are not the only individuals subject to merit retention. Appeals court justices must go before the voters as well. Florida is divided into five appeals court jurisdictions.
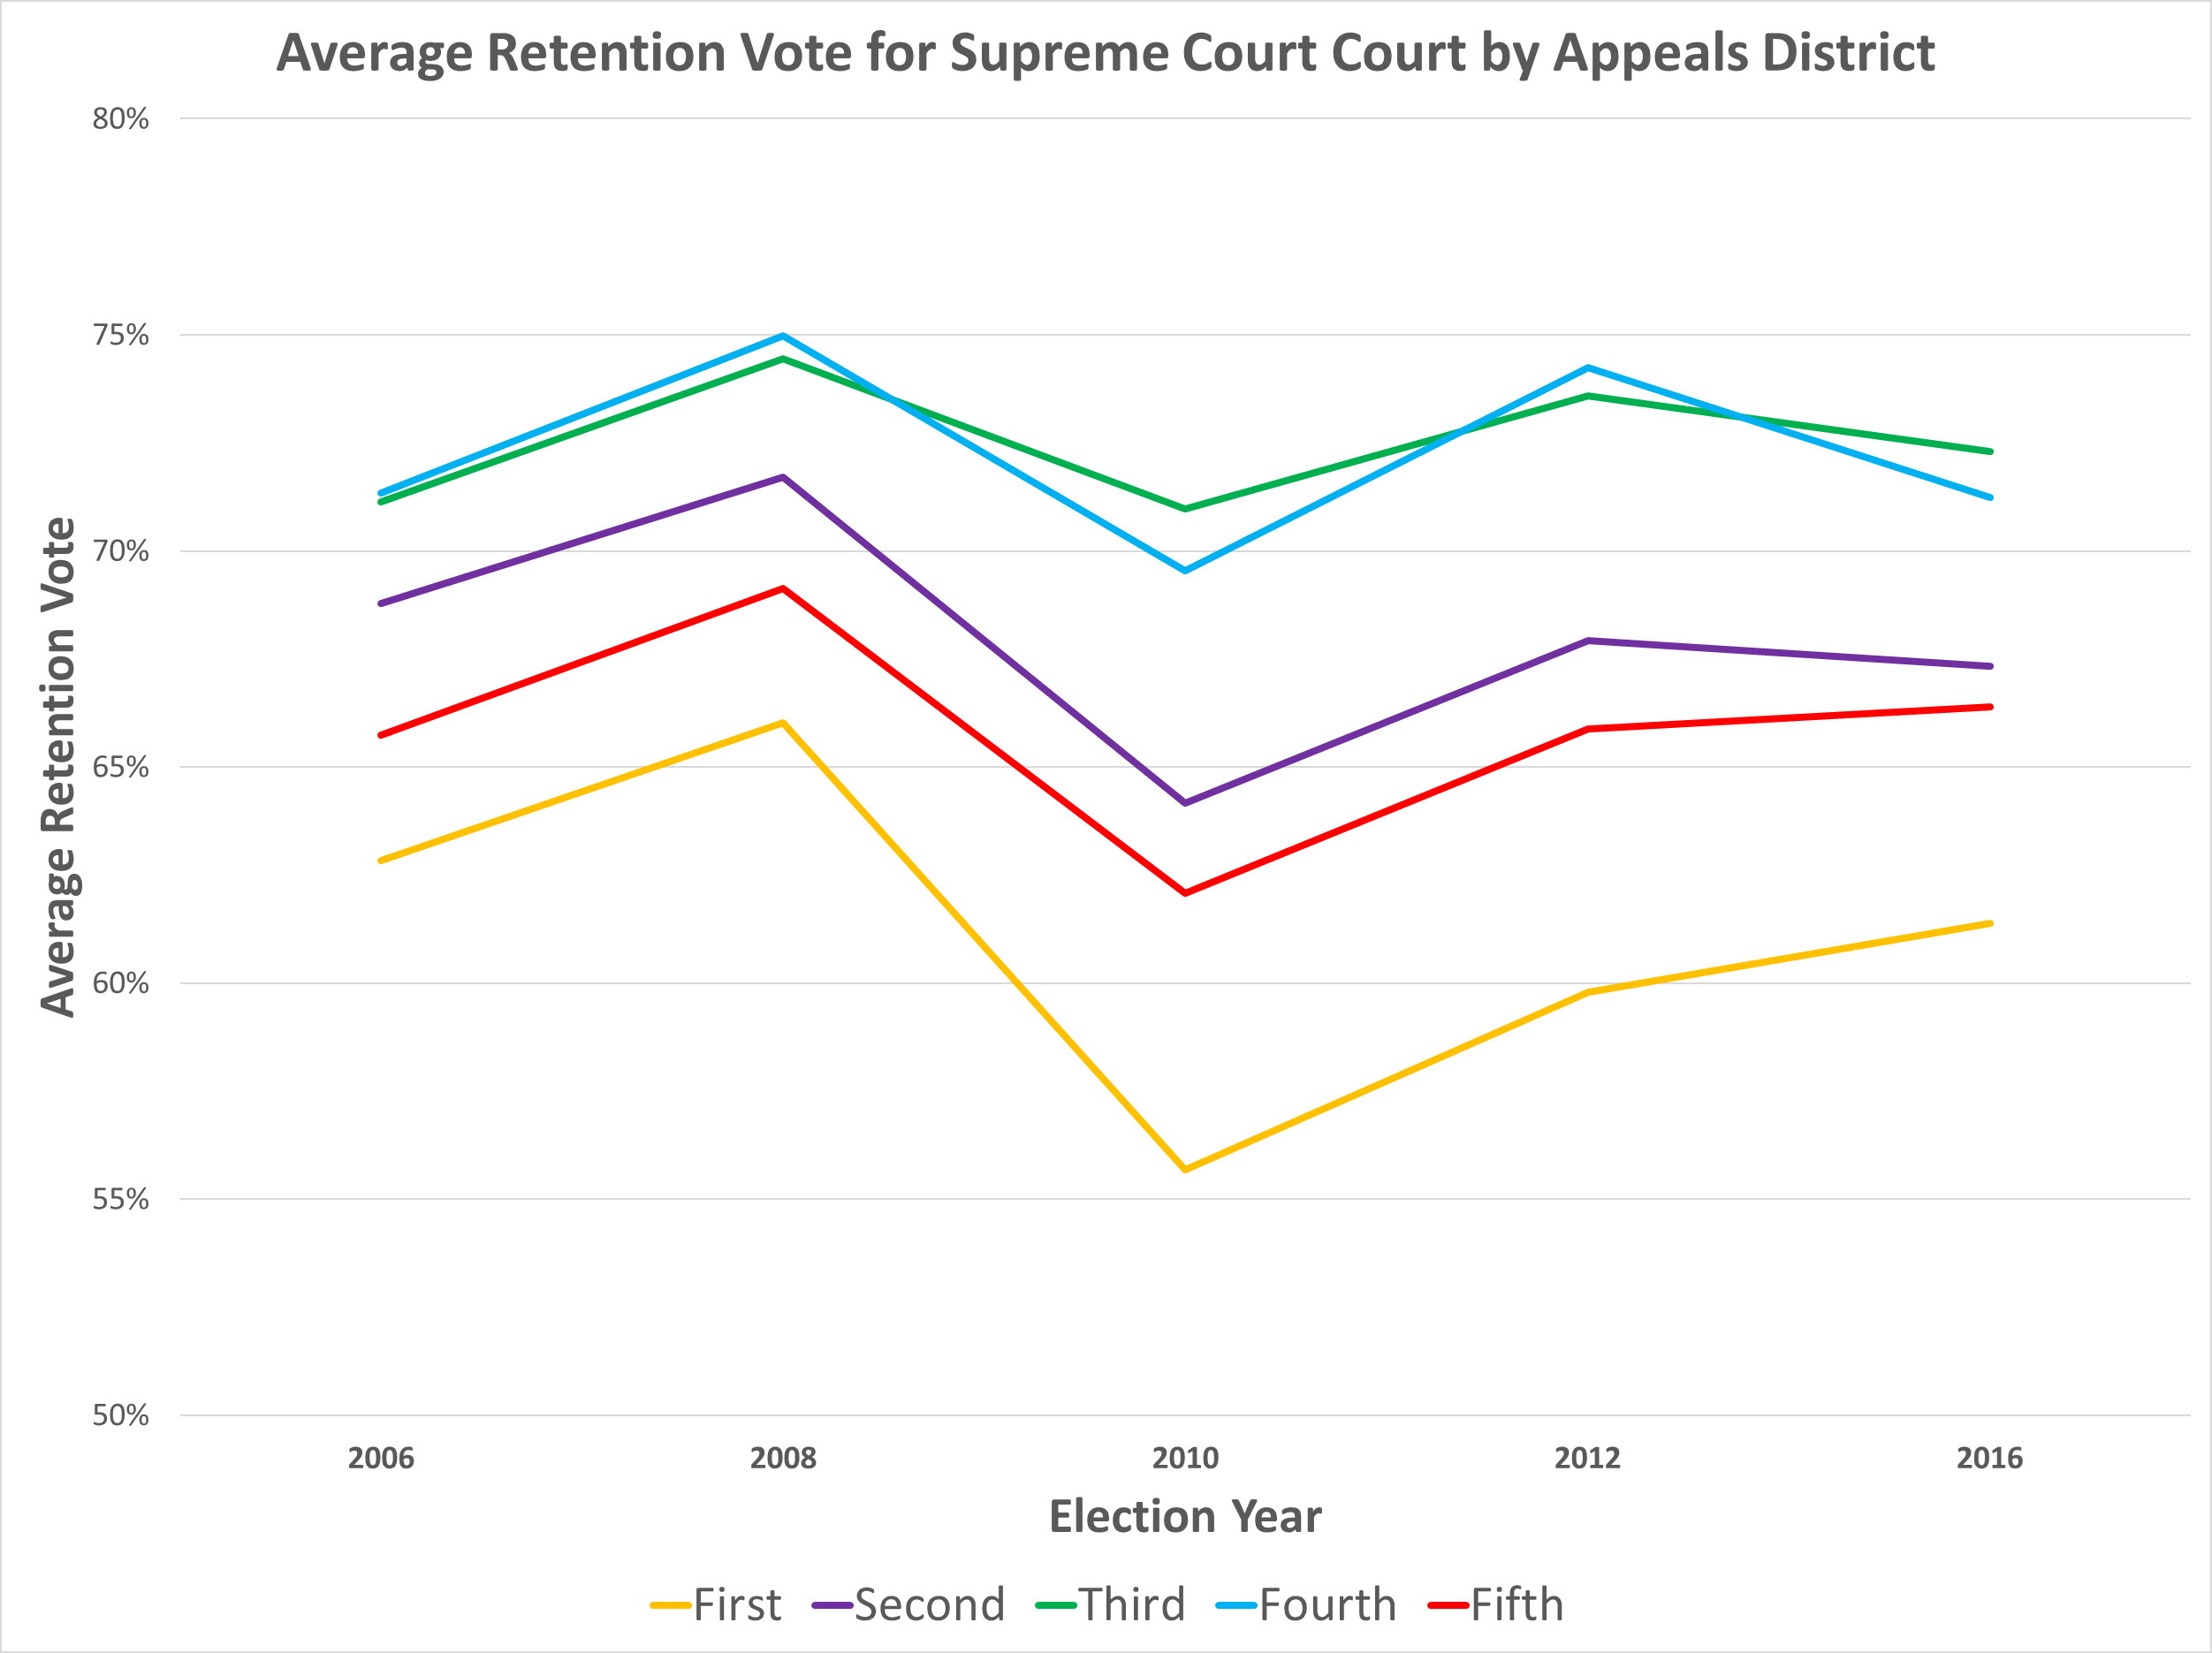
Looking at the Supreme Court retention elections dating back to 2006, the First circuit always has the lowest retention vote, followed by the fifth district.
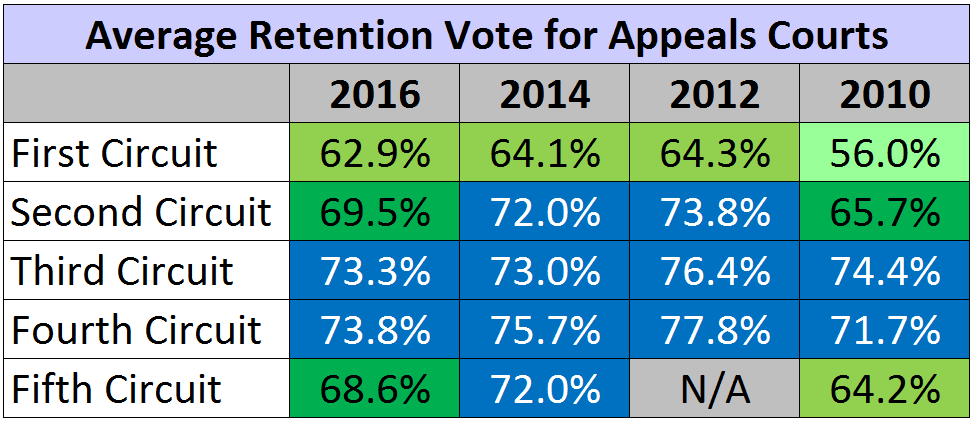
The First districts lower retention vote carries over to the appeals court. Averaging the appeals court justice retention vote since 2010, the First is easily the weakest at retention with the third and fourth boasting over 70% for justices to remain.
Conclusions
The gap in appeals court retention further highlights the regional gap in retaining justices. Overall, region is dictating retention much more than ideological differences. While the rural conservatives reject retention, the suburban conservatives vote to retain. Liberal justices have seen themselves more on defense from organizations than the conservative justices have. However, while rural conservatives have reacted to these efforts to oust liberals, they also give weak support for solidly conservative justices. Other Republican counties, especially in the suburbs along the southwest coast, did not respond well to the 2012 efforts to oust the three liberal justices on the ballot. Meanwhile, major Democratic counties favor retention with little regard for a justices ideology. Overall the rural counties are the most prone to be pushed toward rejecting a justice, however, these counties don’t need that much prodding.