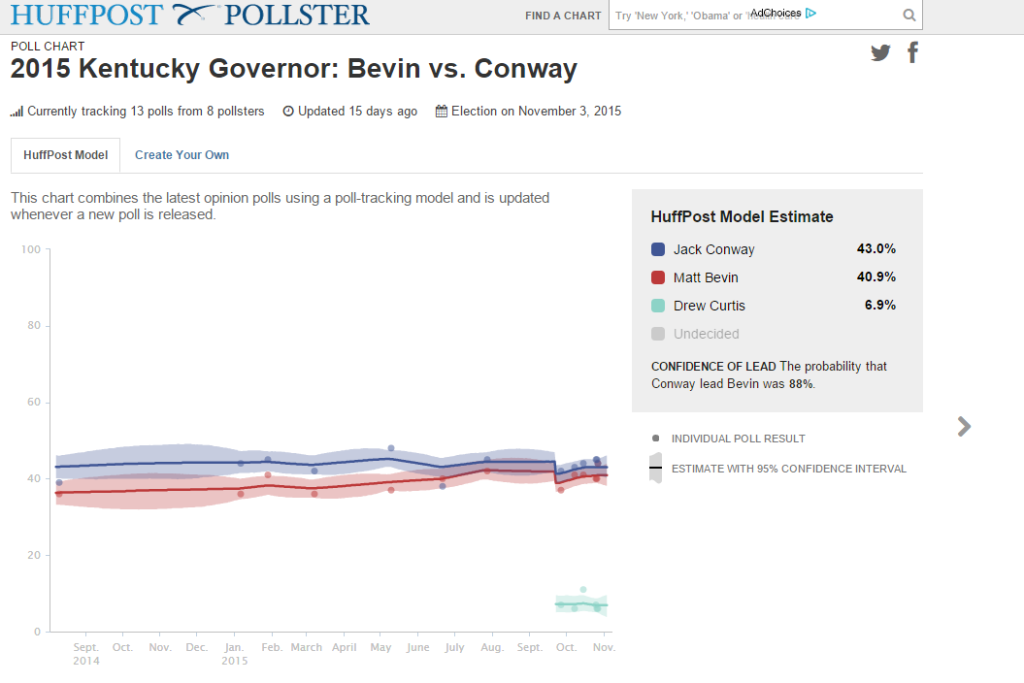
Not long after the ink was dry on articles declaring Matt Bevin the winner of the Kentucky Gubernatorial Election, a conspiracy theory arose that the election must have been rigged. Heading into the election, Democratic Attorney General Jack Conway had a small lead over Bevin, a Republican businessman whose campaign struggles and clashes with the RGA had been well-documented. The Huffington Post polling average placed Bevin at 40% and Conway at 43%. When the election was over, Bevin won with 53% to Conway’s 44%.
The pollster average proved accurate on Conway’s share, but it over-estimated the third-party candidate’s share and under-estimated Bevin’s share. The polls showed undecided voters leaned more conservative than liberal. One major problem was so few polls were performed for the election. FiveThirtyEight did a good take-down on the polls. The breakdown points out that the polls showed consistency, but either misjudged the electorate or undecideds broke overwhelmingly toward Bevin and other GOP candidates. Both are likely true. Bevin’s troubles no doubt led to a “shy Bevin” vote, people unwilling to admit they were voting for him. The polling was a failure, but as the folks at FiveThirtyEight point out, a smaller one considering how few polls were performed.
The Conspiracy Theory
The inaccuracy of the polls fed the notion that something screwy was going on with Kentucky. A conspiracy originated on multiple liberal blogs that the election must have been rigged. The conspiracy theory was circulated on Alternet, DailyNewsBin, AddictingInfo, and other sites. though no mainstream media latched on. All reiterate the same piece of “evidence;” the fact that down-ballot Democratic candidates got more raw votes than Conway himself. The blogs claim that down-ballot candidates receiving more votes than the top of the ballot candidates is “significant anomaly” and that is almost never happens. The different authors claim that people show up and vote top of the ticket then leave before finishing their ballot, so it would be very unlikely any other Democrat running for down-ballot office would get more votes than Conway. There is no nice way to phrase this: that theory is complete nonsense being pushed by people who lack a basic understanding of elections.
Down-Ballot Realities and Stats
Let’s clear something up. Yes, people vote more at the top of the ticket than they do for down-ballot races. The specific “evidence” cited by these blogs is that Democratic Secretary of State Alison Grimes (who won re-election with 52%) and Democrat candidate for Attorney General Andy Beshear (who won by a narrow 2,000 vote margin) got tens-of-thousands more votes than Conway did despite Conway being at the top of the ballot. The blogs claim that 1) It is unlikely people voted for Bevin but then voted Democratic down-ballot and 2) Since people don’t vote down-ballot there is no way Democrats for cabinet offices could get more actual votes than Conway. Both of these claims are untrue. First off, of course voters ticket-split (voting different parties in different races). In states across the country we see ticket-splitting all the time. The most notable example of this on election night was Mississippi Democratic Attorney General Jim Hood winning re-election with 55% while the state overwhelmingly re-elected its Republican Governor. Voters are becoming more partisan and races are becoming more nationalized, but ticket splitting is hardly dead. The writers of these blogs never ticket split and therefore make a blanket assumption no one else does either.
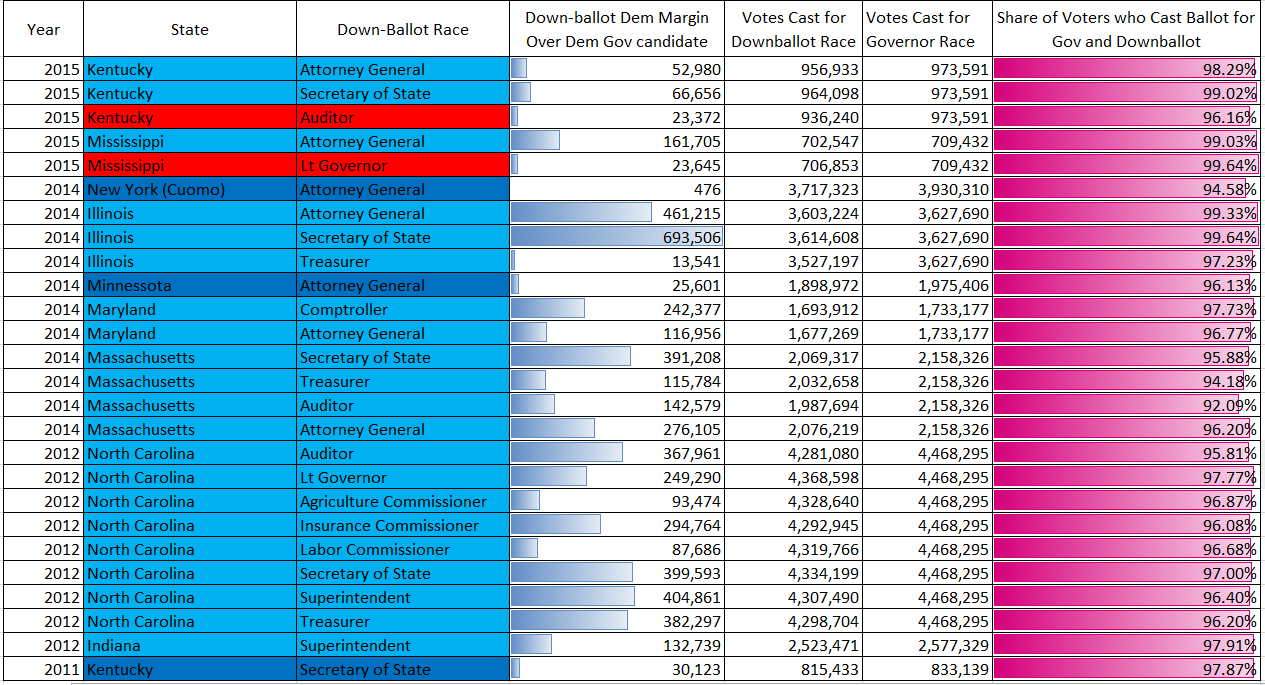
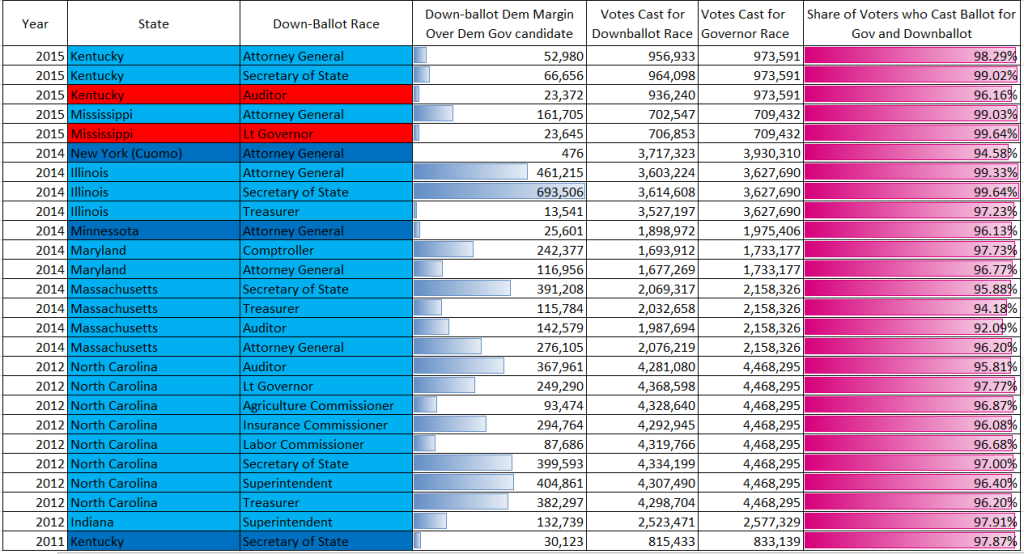
The other claim is that down-ballot Democratic candidates like Grimes and Beshear couldn’t have gotten more votes than Conway. Well I took 45 minutes to see just how many instances there were where a down-ballot Democrat got more votes than the Democratic candidate for Governor. This is not a complete list. I set a 45 minutes time limit to see what I could dig up. In just that time I found 9 states and even more races where the Democratic down-ballot candidates got more raw votes than the Democratic candidate for Governor. The chart below is color coded: light blue means the down-ballot Democratic candidate won while the Democratic gubernatorial candidate lost, red means both the down-ballot candidate and gubernatorial candidate lost, and dark blue means both Democrats won. I also included the percent of voters who cast a ballot for Governor who also voted for that down-ballot race.
As the chart shows, there is no shortage of down-ballot candidates beating their gubernatorial counterparts. Keep in mind this was compiled in a time limit and just on the Democratic side. In states like Illinois, Massachusetts, and North Carolina, nearly all down-ballot Democrats outperformed their the democratic gubernatorial candidate. In addition, the lowest percent of people voting for a down-ballot race and a Governor race was 92%, while the highest peaked at 99%. The drop-off is there, and in big states it can be significant. However, when a Democratic candidate for governor under-performs and loses while down-ballot Democrats win, its not surprising to see their raw vote margins higher. The Grimes and Beshear margins are actually modest compared to some other states. At the very bottom of the chart I also showed how Grimes outdid Steve Beshear (the now-outgoing Governor who was then running for re-election) even while Beshear won re-election with 55%. Steve Beshear is also the father of Andy Bashear, the new Attorney General for the state.
No serious political analyst claims down-ballot candidates cannot outpace top of the ticket candidates in raw voter. The mass of results I compiled in a short amount of time verifies that. But while I feel comfortable stopping there and showing the facts do not back a rigged election, I opted to go a few steps further in order to put any doubt to rest.
Are there any problems with Kentucky’s Data?
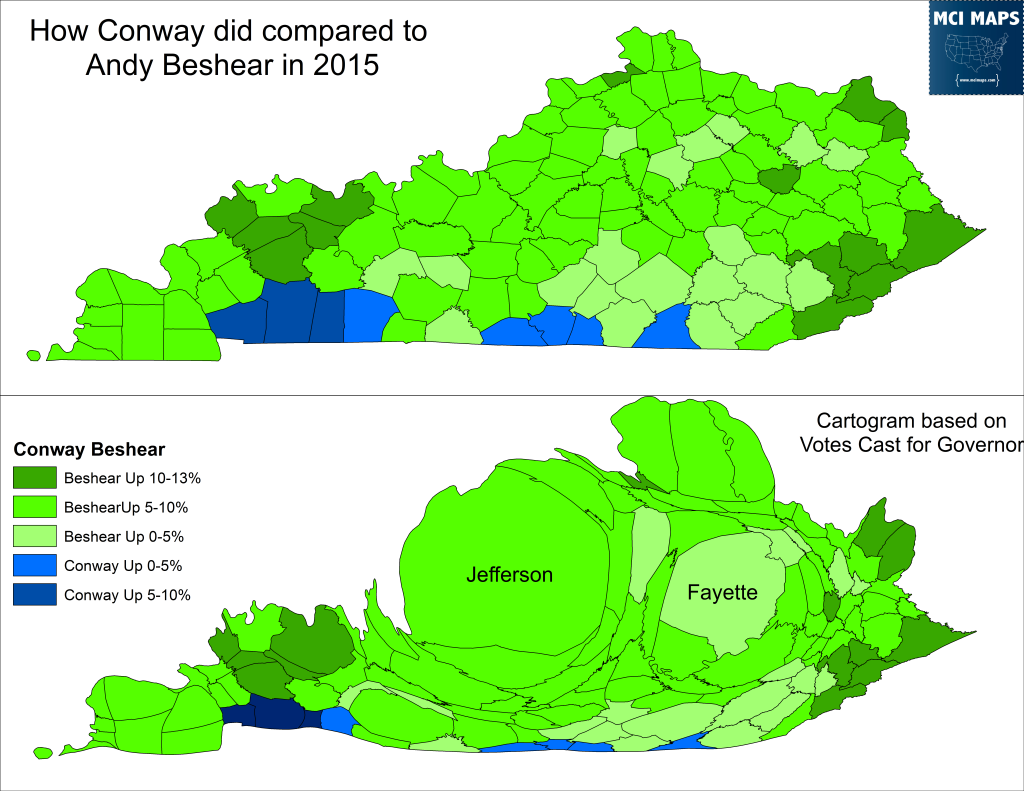
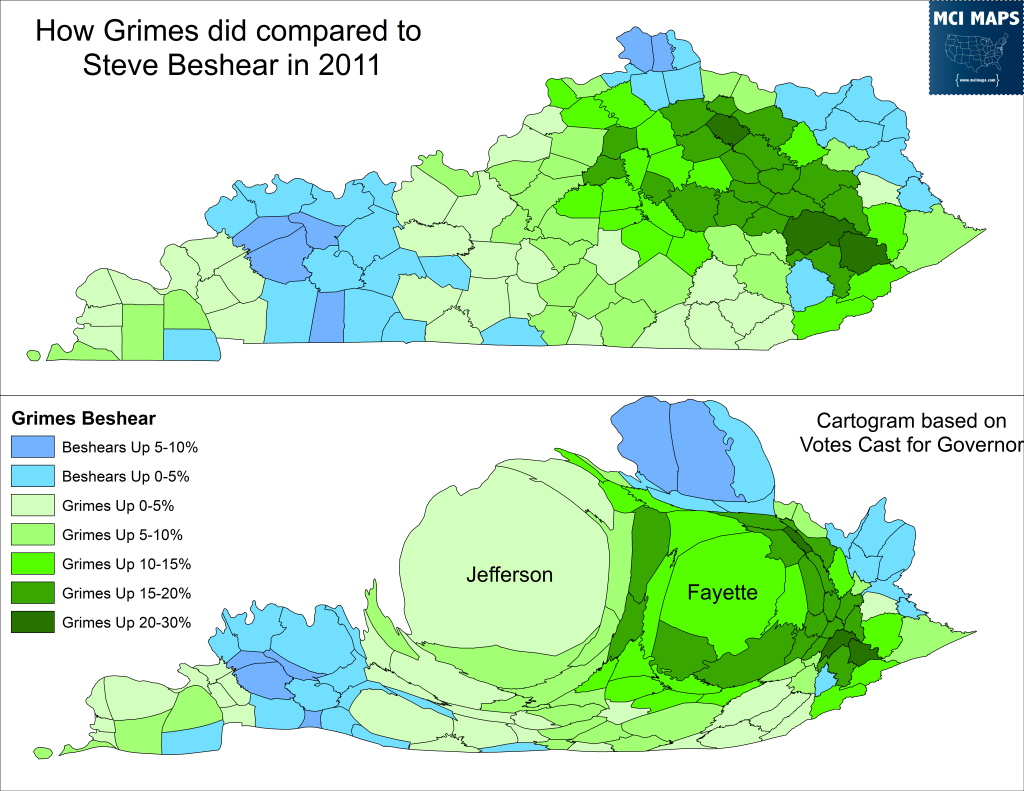
I grabbed the raw results from Kentucky, which, by the way, are the same as reported by all news media and the state elections division, to see if any anomaly existed to warrant concern. One issue that has been cited is how much worse Conway did in Jefferson County, the largest in the state. Conway only got 58% there, well below the 65% he got in his Attorney General re-election in 2011 and the 66% Steve Beshear got in 2011. This is one of the few Democratic-across-the-board counties, so I opted to see how that drop-off compared to other counties. The map below shows the difference between Conway’s 2015 share and Steve Beshear’s 2011 re-election share.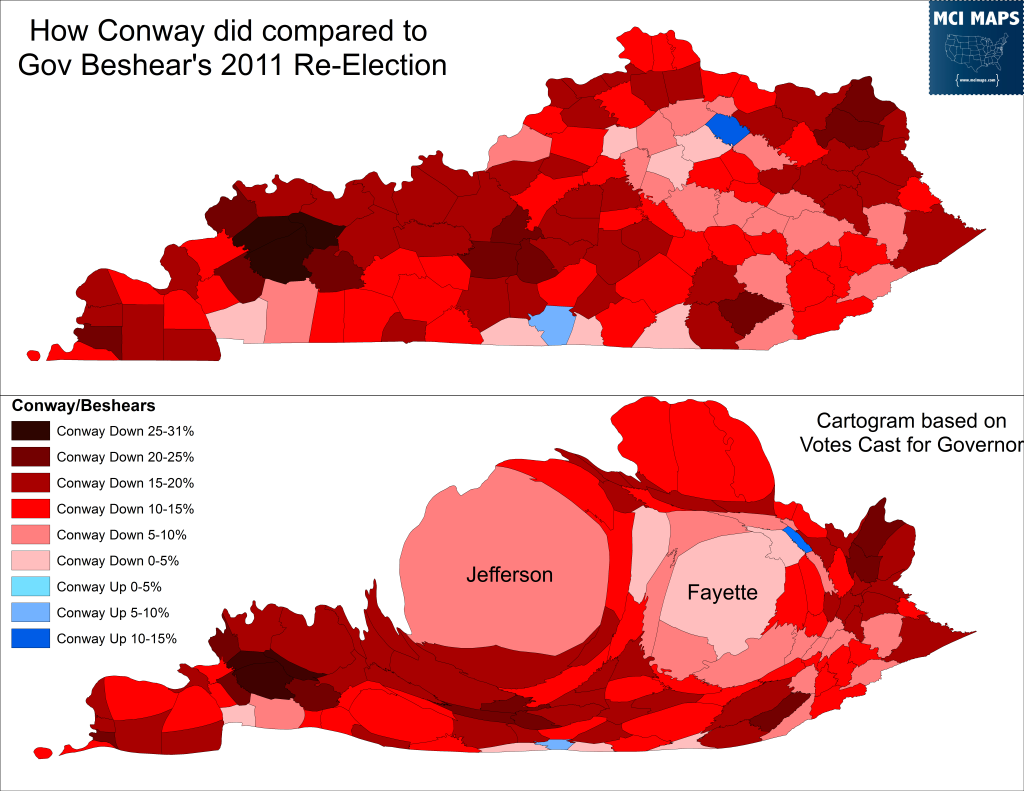
I included a cartogram to give perspective. For any rigging of the vote, it would be much easier to shift totals in a handful of major counties instead of every small one. However, the biggest drops are in smaller counties while the drops of the two largest, Jefferson and Fayette, are not as large. The 8 point drop in Jefferson is also surely attributable partly because Bevin was FROM THAT COUNTY, a fact that is over-looked when this is discussed.
The conspiracy theory claims that voters couldn’t have split tickets to such a large extent and must have had their votes for Conway reversed to Bevin. Again one would imagine this would be done in a key group of counties with complicit officials. Therefore, we would see patterns or anomalies; areas where Conway really fell-off compared to the other Democrats he was running with. Well comparing the Conway results with the Andy Beshear (AG candidate) results, there is no clear pattern.
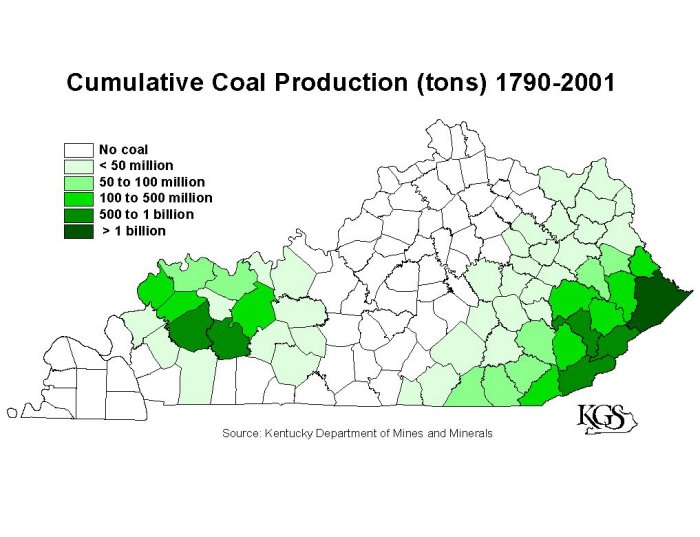
Conway actually outpaces Beshear in a few southern counties but overall did worse in most. There were some counties where Conway did especially worse, most of which are “coal counties” – heavily influenced by coal production.
The issue of coal was a constant in the campaign and Conway had to run away from a President who has been pushing renewable energy, a threat to coal. It’s not hard to believe some voters didn’t trust Conway to break with the President since they are from the same party.
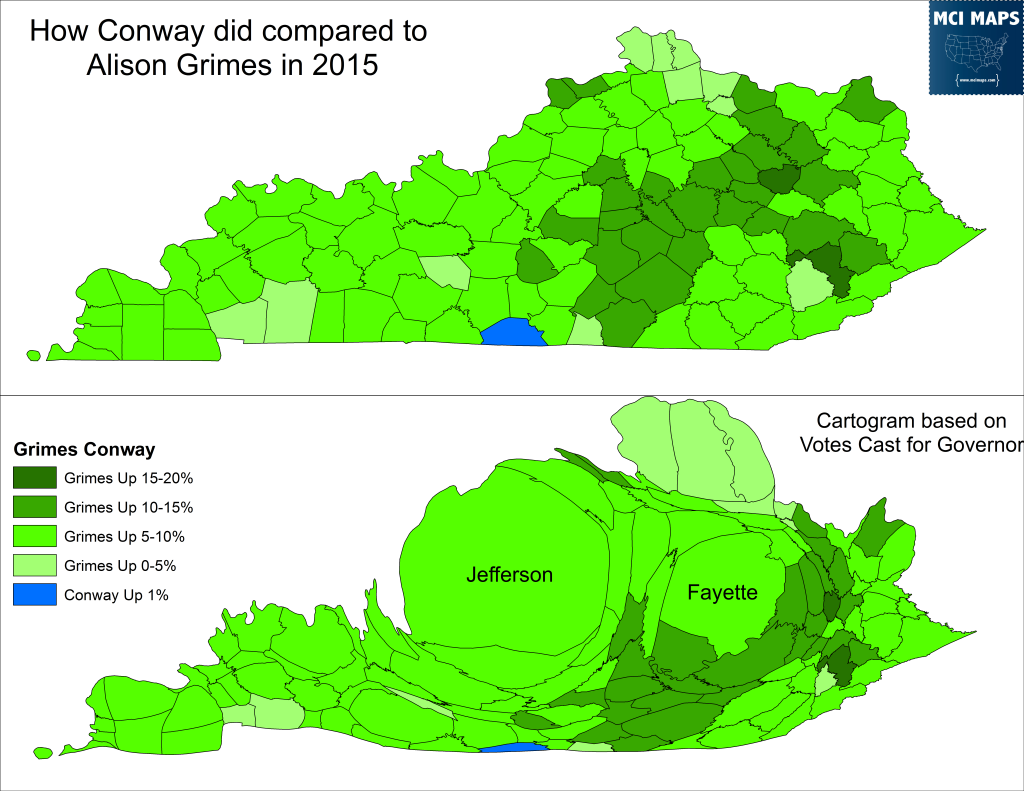
I also compared Grimes’ re-election to Conway and found a bit more of a pattern, a clear collection of counties that did better for Grimes than Conway.
However, before you get excited, this is because Grimes is from that region and has strong support there. That side of the state was also where she over-performed Steve Beshear in 2011.
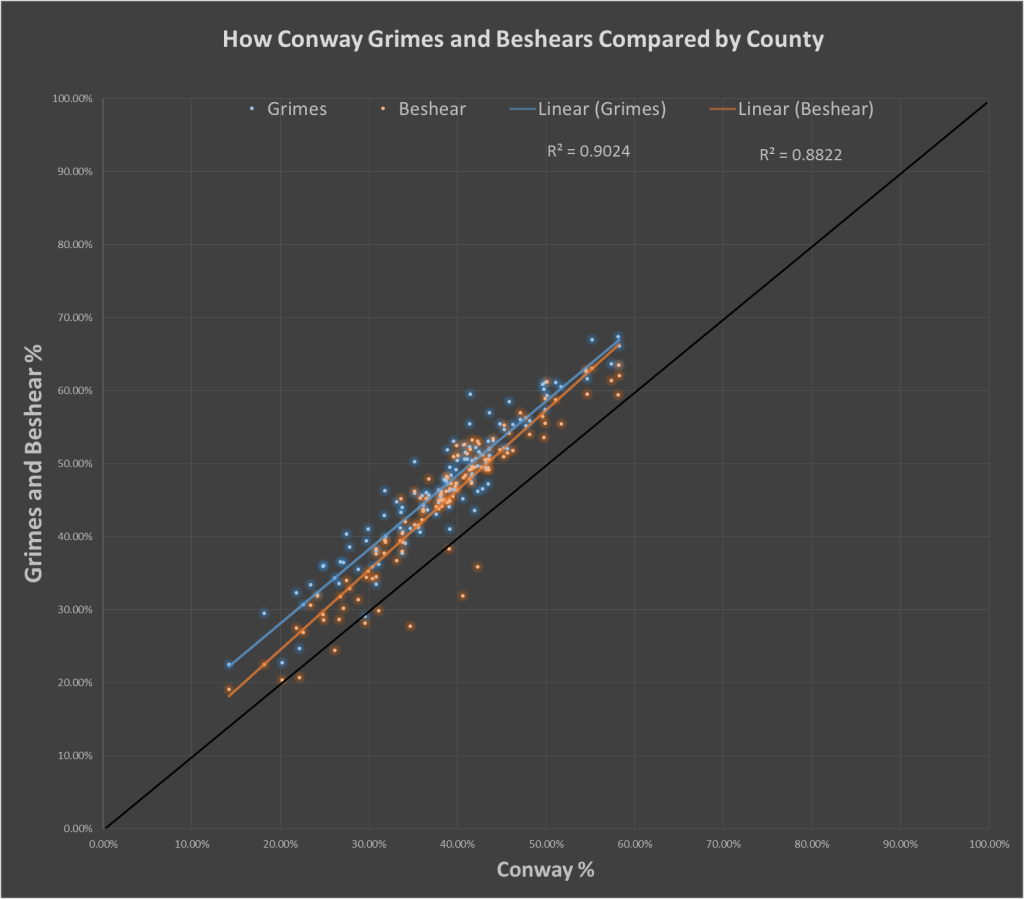
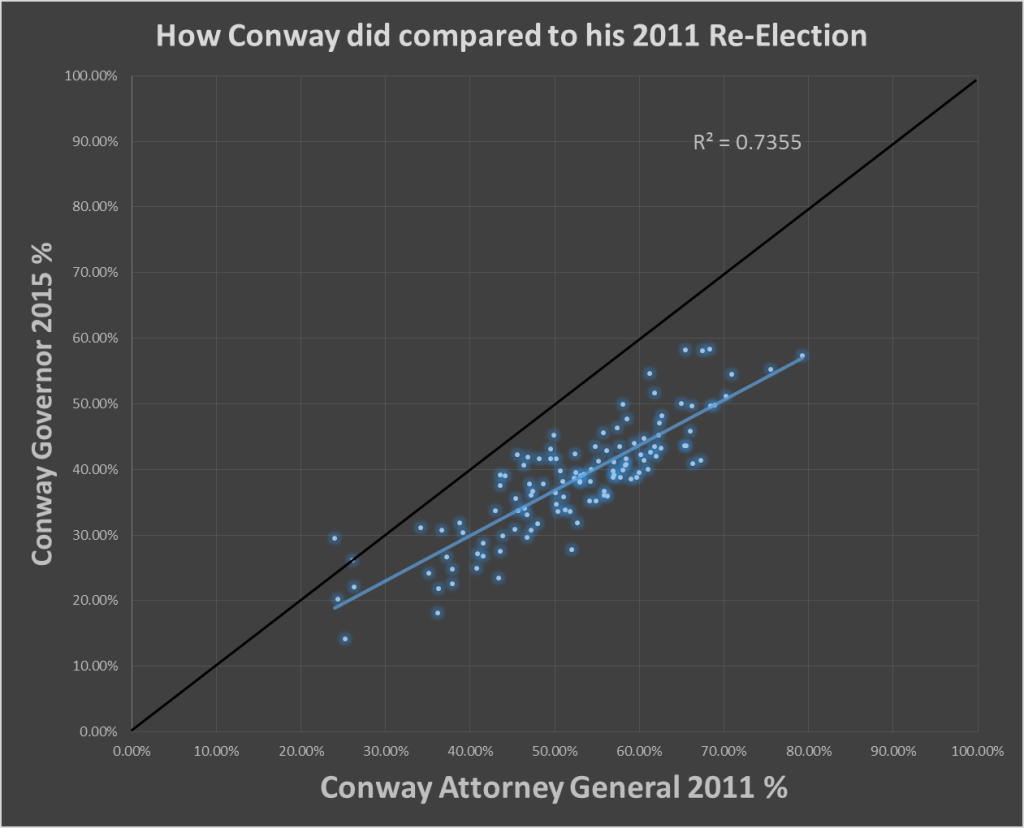
Conway’s margins closely correlate with those of Andy Beshear and Alison Grimes. The scatter-plot below shows the Beshear and Grimes percentages compared to Conway’s. The black line represents either candidate getting the same percent as Conway. What we see is both Grimes and Beshear doing better than Conway in nearly every county and their trend-lines closely match. As one candidate did better, so did the others. The problem for Conway was he steadily did worse than Beshear and Grimes.
This shows that in general many voters did vote straight ticket, but a steady stream of them opted for Grimes, an incumbent with a weaker opponent, and Beshear, the son of the outgoing Governor, while voting Bevin for Governor. This type of trend we have seen in many races before. Meanwhile, let’s not forget that the auditor, treasurer, and agriculture commissioner all went Republican just like in the governor’s race. Democrats winning in Kentucky in 2015 was the outlier, not Bevin winning.
I even compared Conway’s 2011 race with 2015 and found a fairly strong correlation. Conway’s problem was that the counties he won big in 2011 were much weaker for him in 2015.
In only 2 counties did Conway do better than his 2011 re-election.
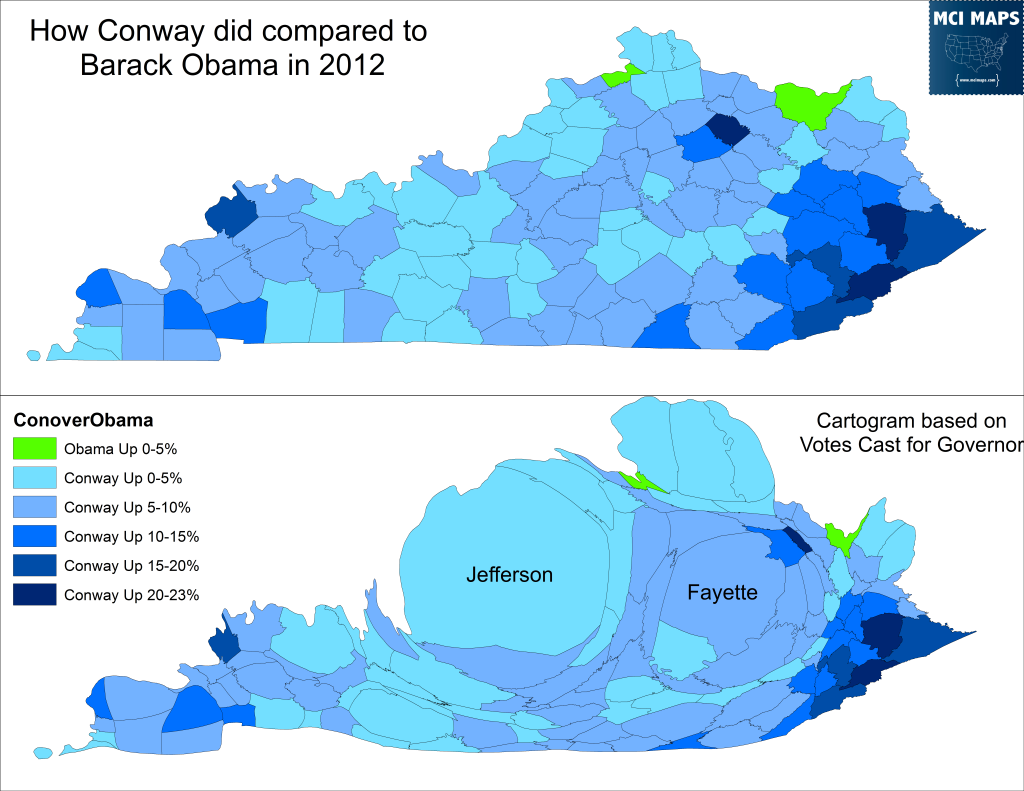
Conway still did much better than Barack Obama did in 2012. The problem for him was that he did not improve in enough counties. Conway’s biggest gains over Obama were actually in the coal counties of east Kentucky. However, he still lost them, a testament to how unpopular Obama was in the region.
Conway also did better than Obama in the major counties like Jefferson and Fayette. It is not like the results for Conway make no sense.
If no polling had been done for the race, these results would have seemed plausible. In fact, many were amazed the race was even in play for Democrats. Had Bevin not been the nominee, having won the primary narrowly after the front-runner had a major scandal, the race likely would have been written off some time ago. The few polls in the race, all failing to capture the “shy Bevin” vote and anticipate that undecideds would opt for the candidate of the party they leaned toward, gave us an impression that Conway had a real shot. However, Conway never pulled past 45% and a large number of undecideds remained heading into the election. Considering the continued red-shift of Kentucky, it is not hard to believe those undecided broke toward Bevin by a large margin.
Conclusions
The conspiracy theory crowd is basing their assessment off limited facts and outright lies. The logic being used is similar to a debunked theory that “proved” Obama stole the 2012 election. If you haven’t read that theory I recommend it for a good laugh. The methodology used there is similar to the one used here. Some true facts are stated but given out of context. Wild assumptions are made about voting behavior with little backup, and outright lies are also pushed as true. This theory and that one are no different. Both are dishonest and yet believed by people who read them. It is important these theories are rightly debunked and ridiculed. Fraud has happened in elections and it is a serious situation. The conspiracy theory actually sites a scandal in Clay County Kentucky where several officials were arrested for election rigging. Of course the conspiracy takes it too far and says “see this means all elections in Kentucky are rigged,” – skipping the fact that the rigging involved local races and Clay County is 0.3% of the total votes cast for Governor. In 2012 the Democratic Supervisor of Elections for Madison County, Florida was arrested for rigging a school board race. Does that mean we shouldn’t trust that Obama won Florida in 2008 or 2012? These fraud convictions are serious, but asserting that what happens in one small county means an entire state’s election is faked (without any additional evidence) is ludicrous. This of course also brings up another point, rigging elections is easier when small numbers of votes will decide outcomes. Bevin won by 85,000.
Nonsense like this latest theory distract from real cases of fraud and aim to de-legitimize democratically-elected leaders. I may not like Bevin, disagree with him on everything, and am ready to work for his 2019 opponent; but the fact is he was elected. Democrats must focus on finding out where things went wrong for Conway and how they can win the Governor’s mansion back. Both Grimes and Beshear will be strong candidates (gee if people were rigging Governor, why wouldn’t they ensure no Democrat won??) and that they can topple Bevin after one term. Democrats need to look to the next steps in Kentucky, not focus on internet gossip and nonsense.

