In 2013, I wrote an article on Democratic Party Strength at the local level. The article examined areas where Democrats were strong and weak on down-ballot races for county commission and constitutional officers. It has long been my view that local elections are critical to the future of any political party. Local elections allow parties to build benches for higher office. In addition, local elections can be used to help measure party strength in different jurisdictions. With the 2014 elections now over, I decided to take a look back at how Democrats fared at the local level. While Florida Democrats did not take back the Governorship and six State House Democrats lost re-election; elections at the local level were not a Democratic defeat. Despite losses further up the ballot, Democrats managed to take control of two county commissioner chambers and defend several targeted seats. This article will look at some of those contest races and how they fared compared to the top of the ballot.
Local Control Heading into 2014
While there are many races for city government that took place in 2014; some of the biggest cities host their elections in high profile spring elections. For 2014, I decided to focus on the county commission races, all of which, except in Duval, occur during state and federal elections. Constitutional officers (Tax collector, Superintendent, Sheriff, Property Appraiser, Clerk of Court, Supervisor of Elections) are elected in Presidential years while county commission seats are rotated between midterm and presidential cycles (like Senate seats). Therefore, this article largely focuses on the County Commission races and a few special elections for Constitutional Officers.
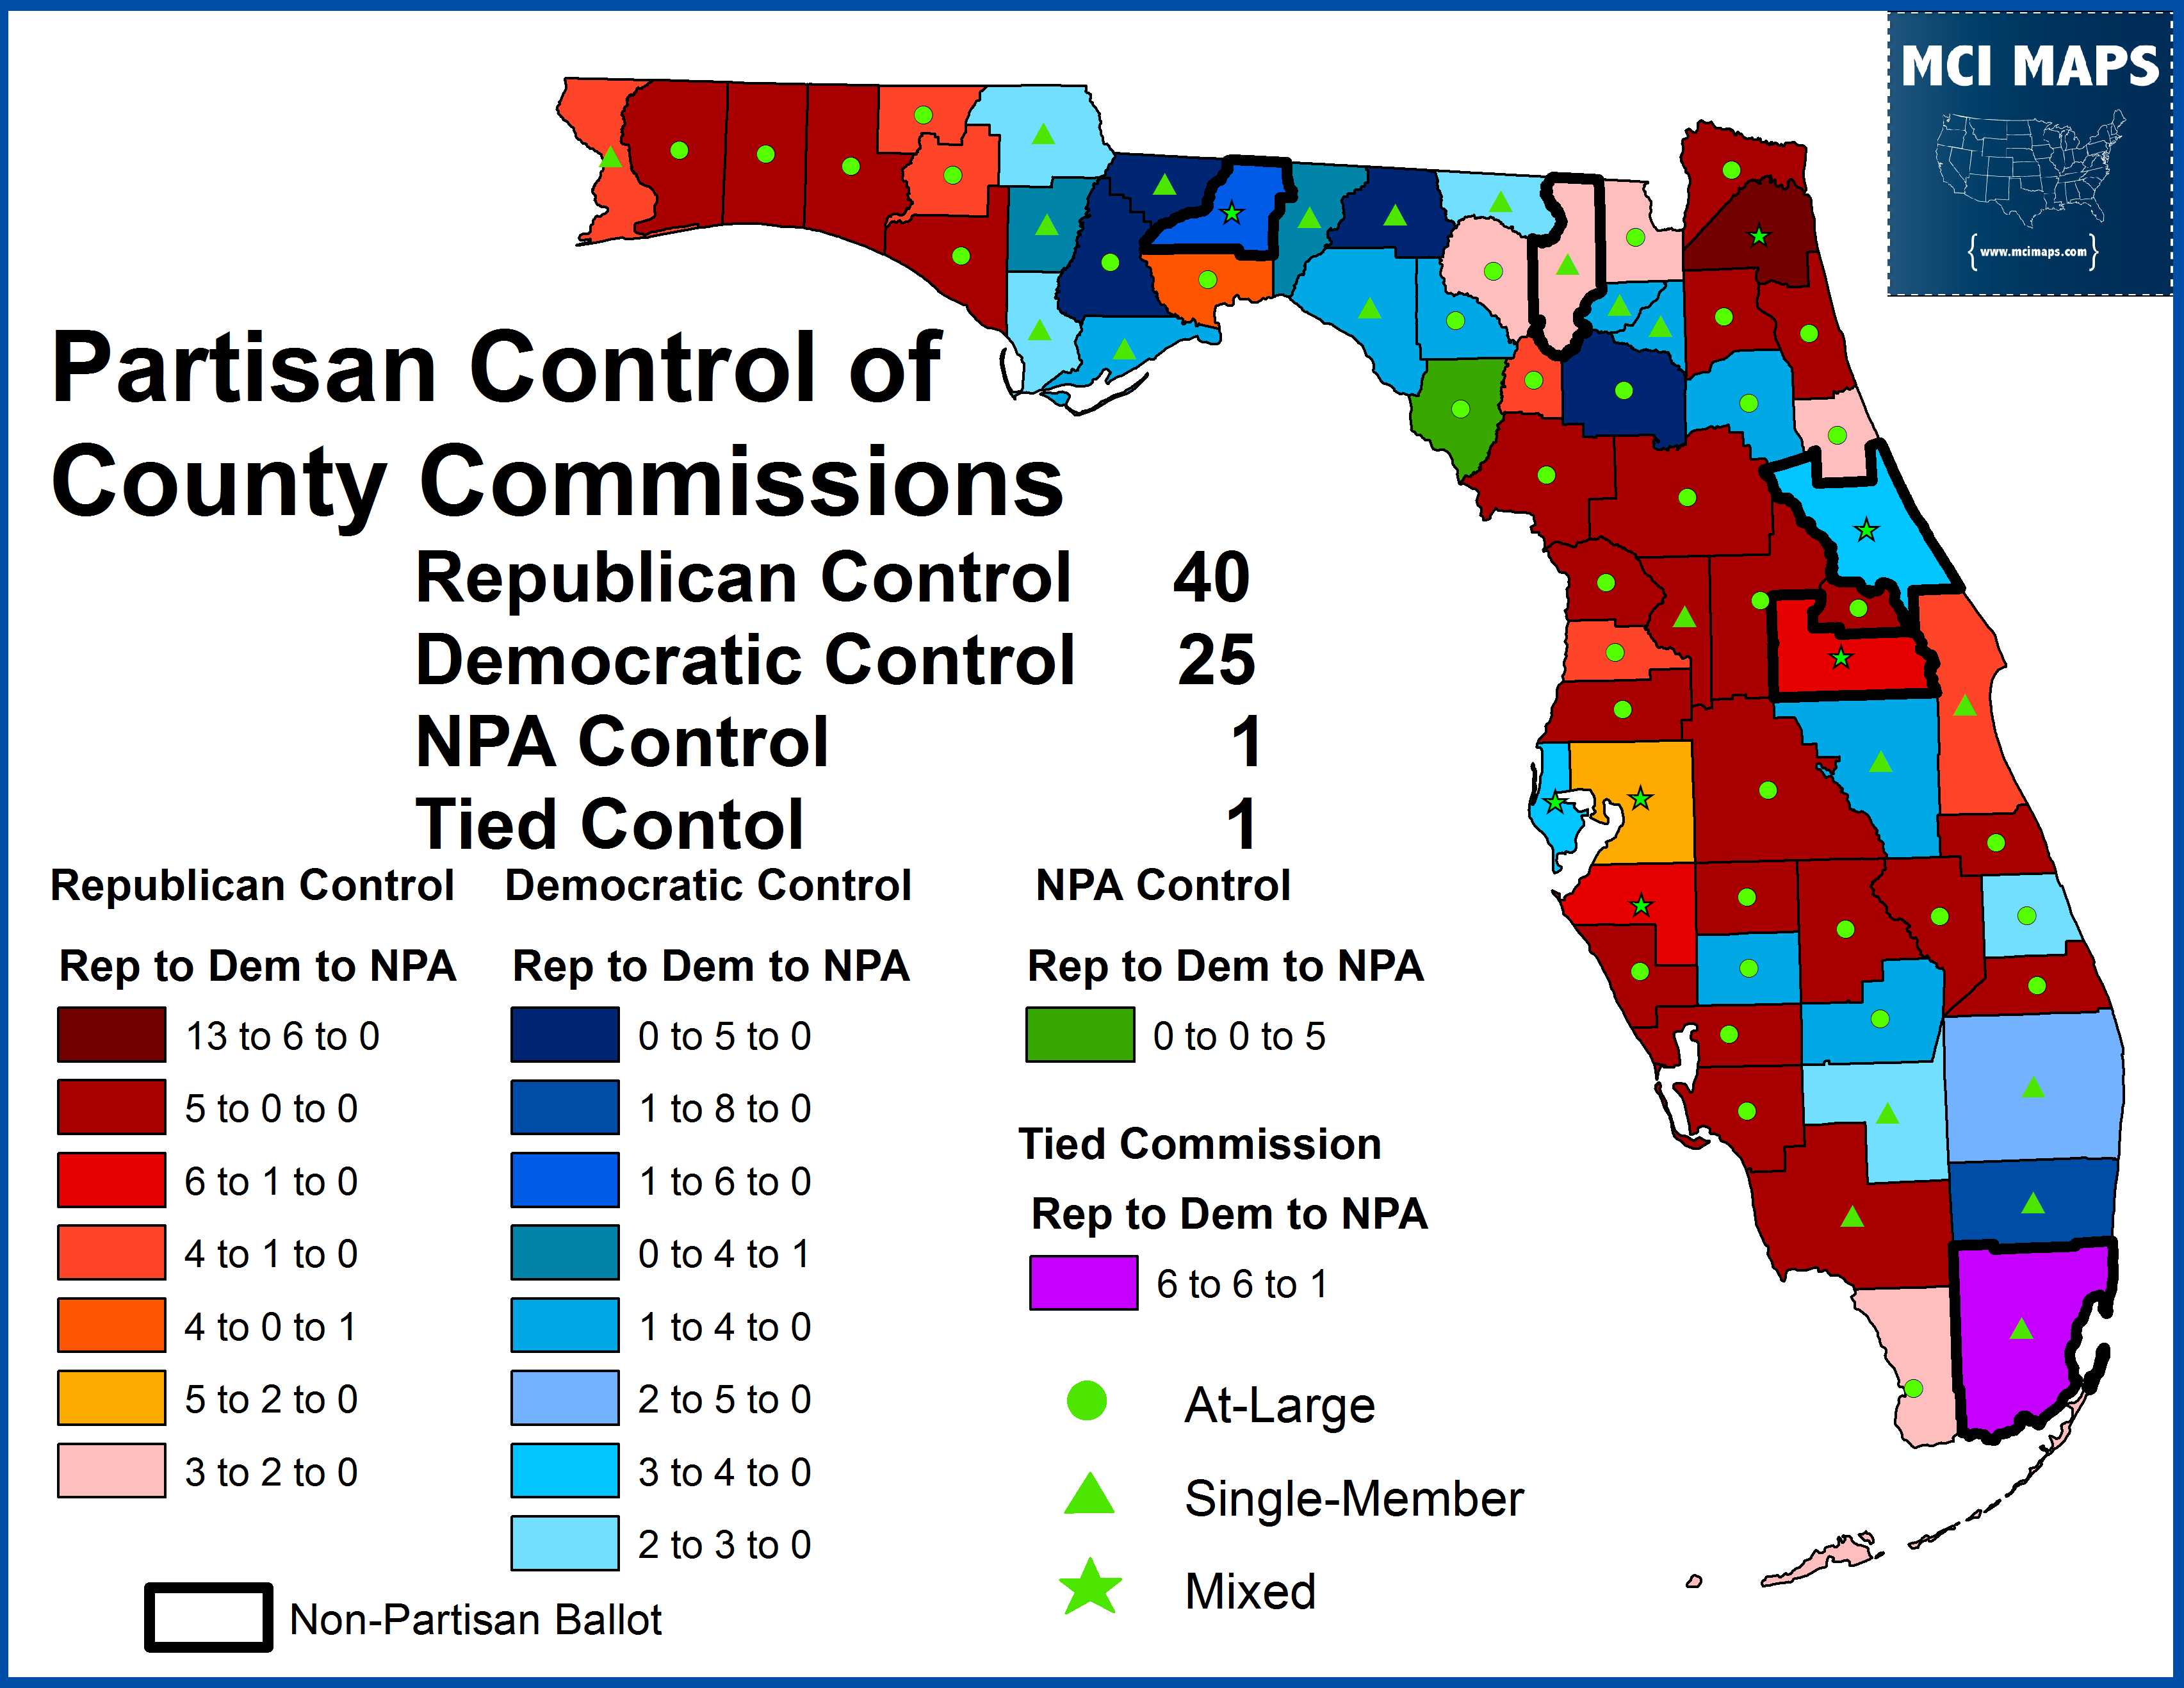
Before the 2014 elections, Democrats controlled 23 of the 67 county commissions. This may seem low, but keep in mind Obama only won 13 counties in 2012 when he won with 50%. Democrats controlled a large chunk of North Florida and rural counties that used to be reliably blue but have drifted away from state and federal Democrats. Republicans, meanwhile, controlled several blue-leaning urban counties despite weakness at the top of the ballot. The breakdown of county commission control as of December 2013 is below.
Key Races in 2014
Heading into November 2014, there were several key races brewing for county commission seats and constitutional officers. I profiled several of these races the day before the elections. Please give it a read through for more background details on each race. Some races that were not covered in that article will be covered now. In some races, I went into much more detail about how local candidates performed compared to Democratic Gubernatorial Candidate Charlie Crist. Any images for any race are uploaded in a minimized size. However, if you click the image, it will load larger.
Alachua Commission and Tax Collector
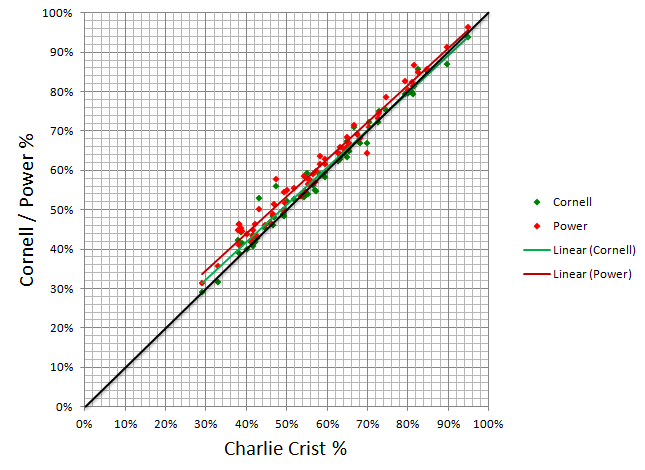
Alachua had two major local elections. Neither of these got coverage in my initial article due to an oversight. Alachua Commissioners are elected at-large and Democrats held a 4-1 advantage on the commission. Crist won 56.1% of the county in the Governor’s election. The lone Republican on the commission opted not to run again in 2014 and both parties fought for the seat. In the end, Democrat Ken Cornell won with 56.7% of the vote, beating Republican John Martin. In addition, the Tax Collector position was up in a special election for the last two years due to the death of the incumbent Democrat Von Fraser. The race saw Democrat John Power and Republican Jon C. Costabile face off. Both candidates worked in the Tax Collector office and pledged a positive campaign; claiming to be friends and colleagues. Power won with 58.85% of the vote. The votes for all three Democrats (Crist, Power, and Cornell) all correlate highly with each-other. Both local Democrats performed slightly better than Crist, likely thanks to a lack of third party candidates siphoning off votes.
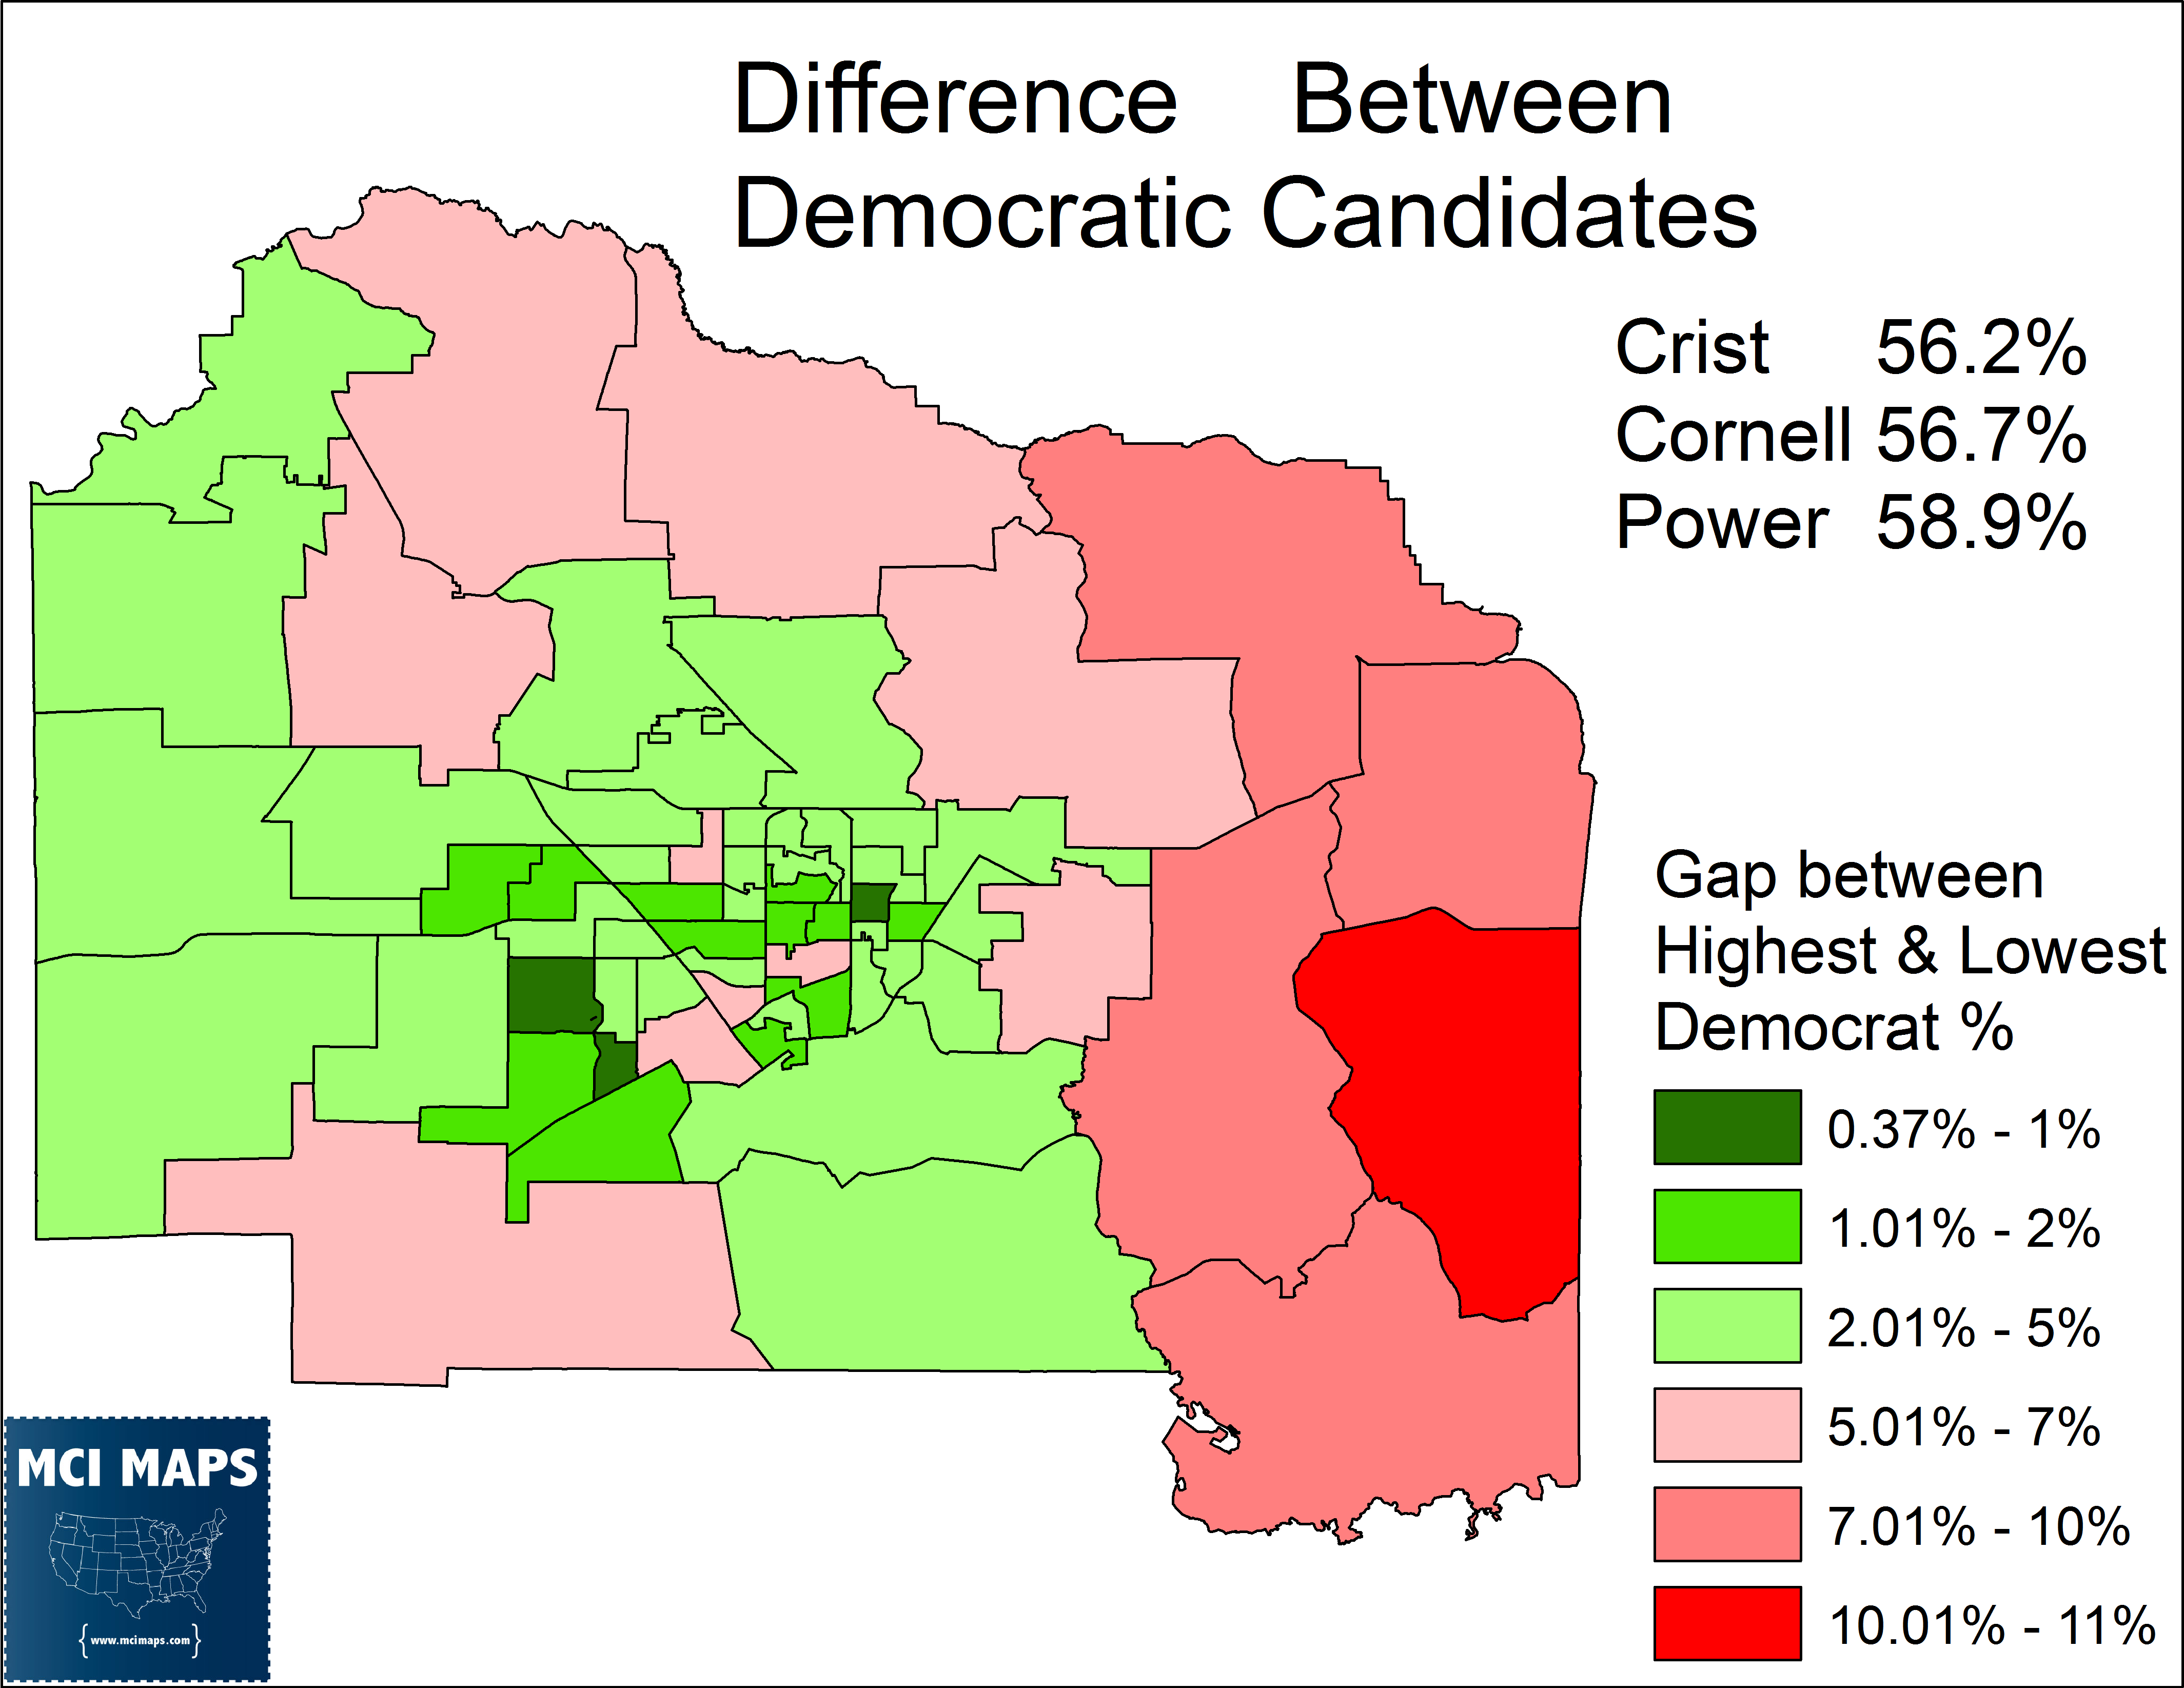
The scatter-plot below shows Crist % as they relate to Cornell and Power. All three candidates had strong correlation. The black line represents a perfect correlation with Crist’s percentages; which both local candidates come close to having. As precincts became more Democratic, vote totals came closer together; while Cornell and Power outdid Crist (running above of the black line in the scatter-plot) in less Democratic areas. The map below shows which precincts had the largest/smallest gaps between candidates.
Bradford County Commission: Districts 2 and 4
Bradford had two competitive county commission elections. Before the election, Democrats had 5-0 control of the commission. Incumbent Danny Riddick was able to beat a Republican challenger who outspent him $3,000 to $13,000 with 53% of the vote. Meanwhile, Incumbent Doyle Thomas lost to his Republican challenger with only 46.7% of the vote. The elections took place in different districts of the county; both heavily backing Scott. The result is Democrats holding 4-1 control of the commission.
Broward County Commission: District 4
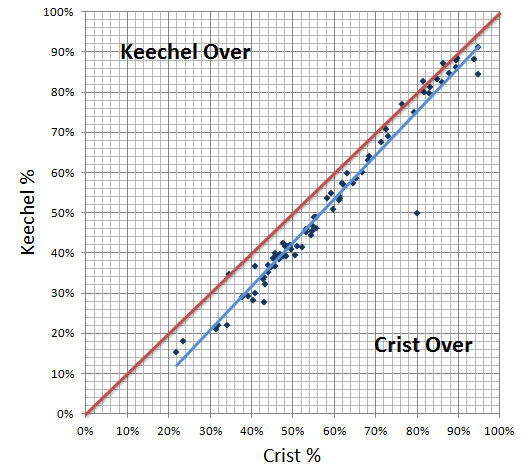
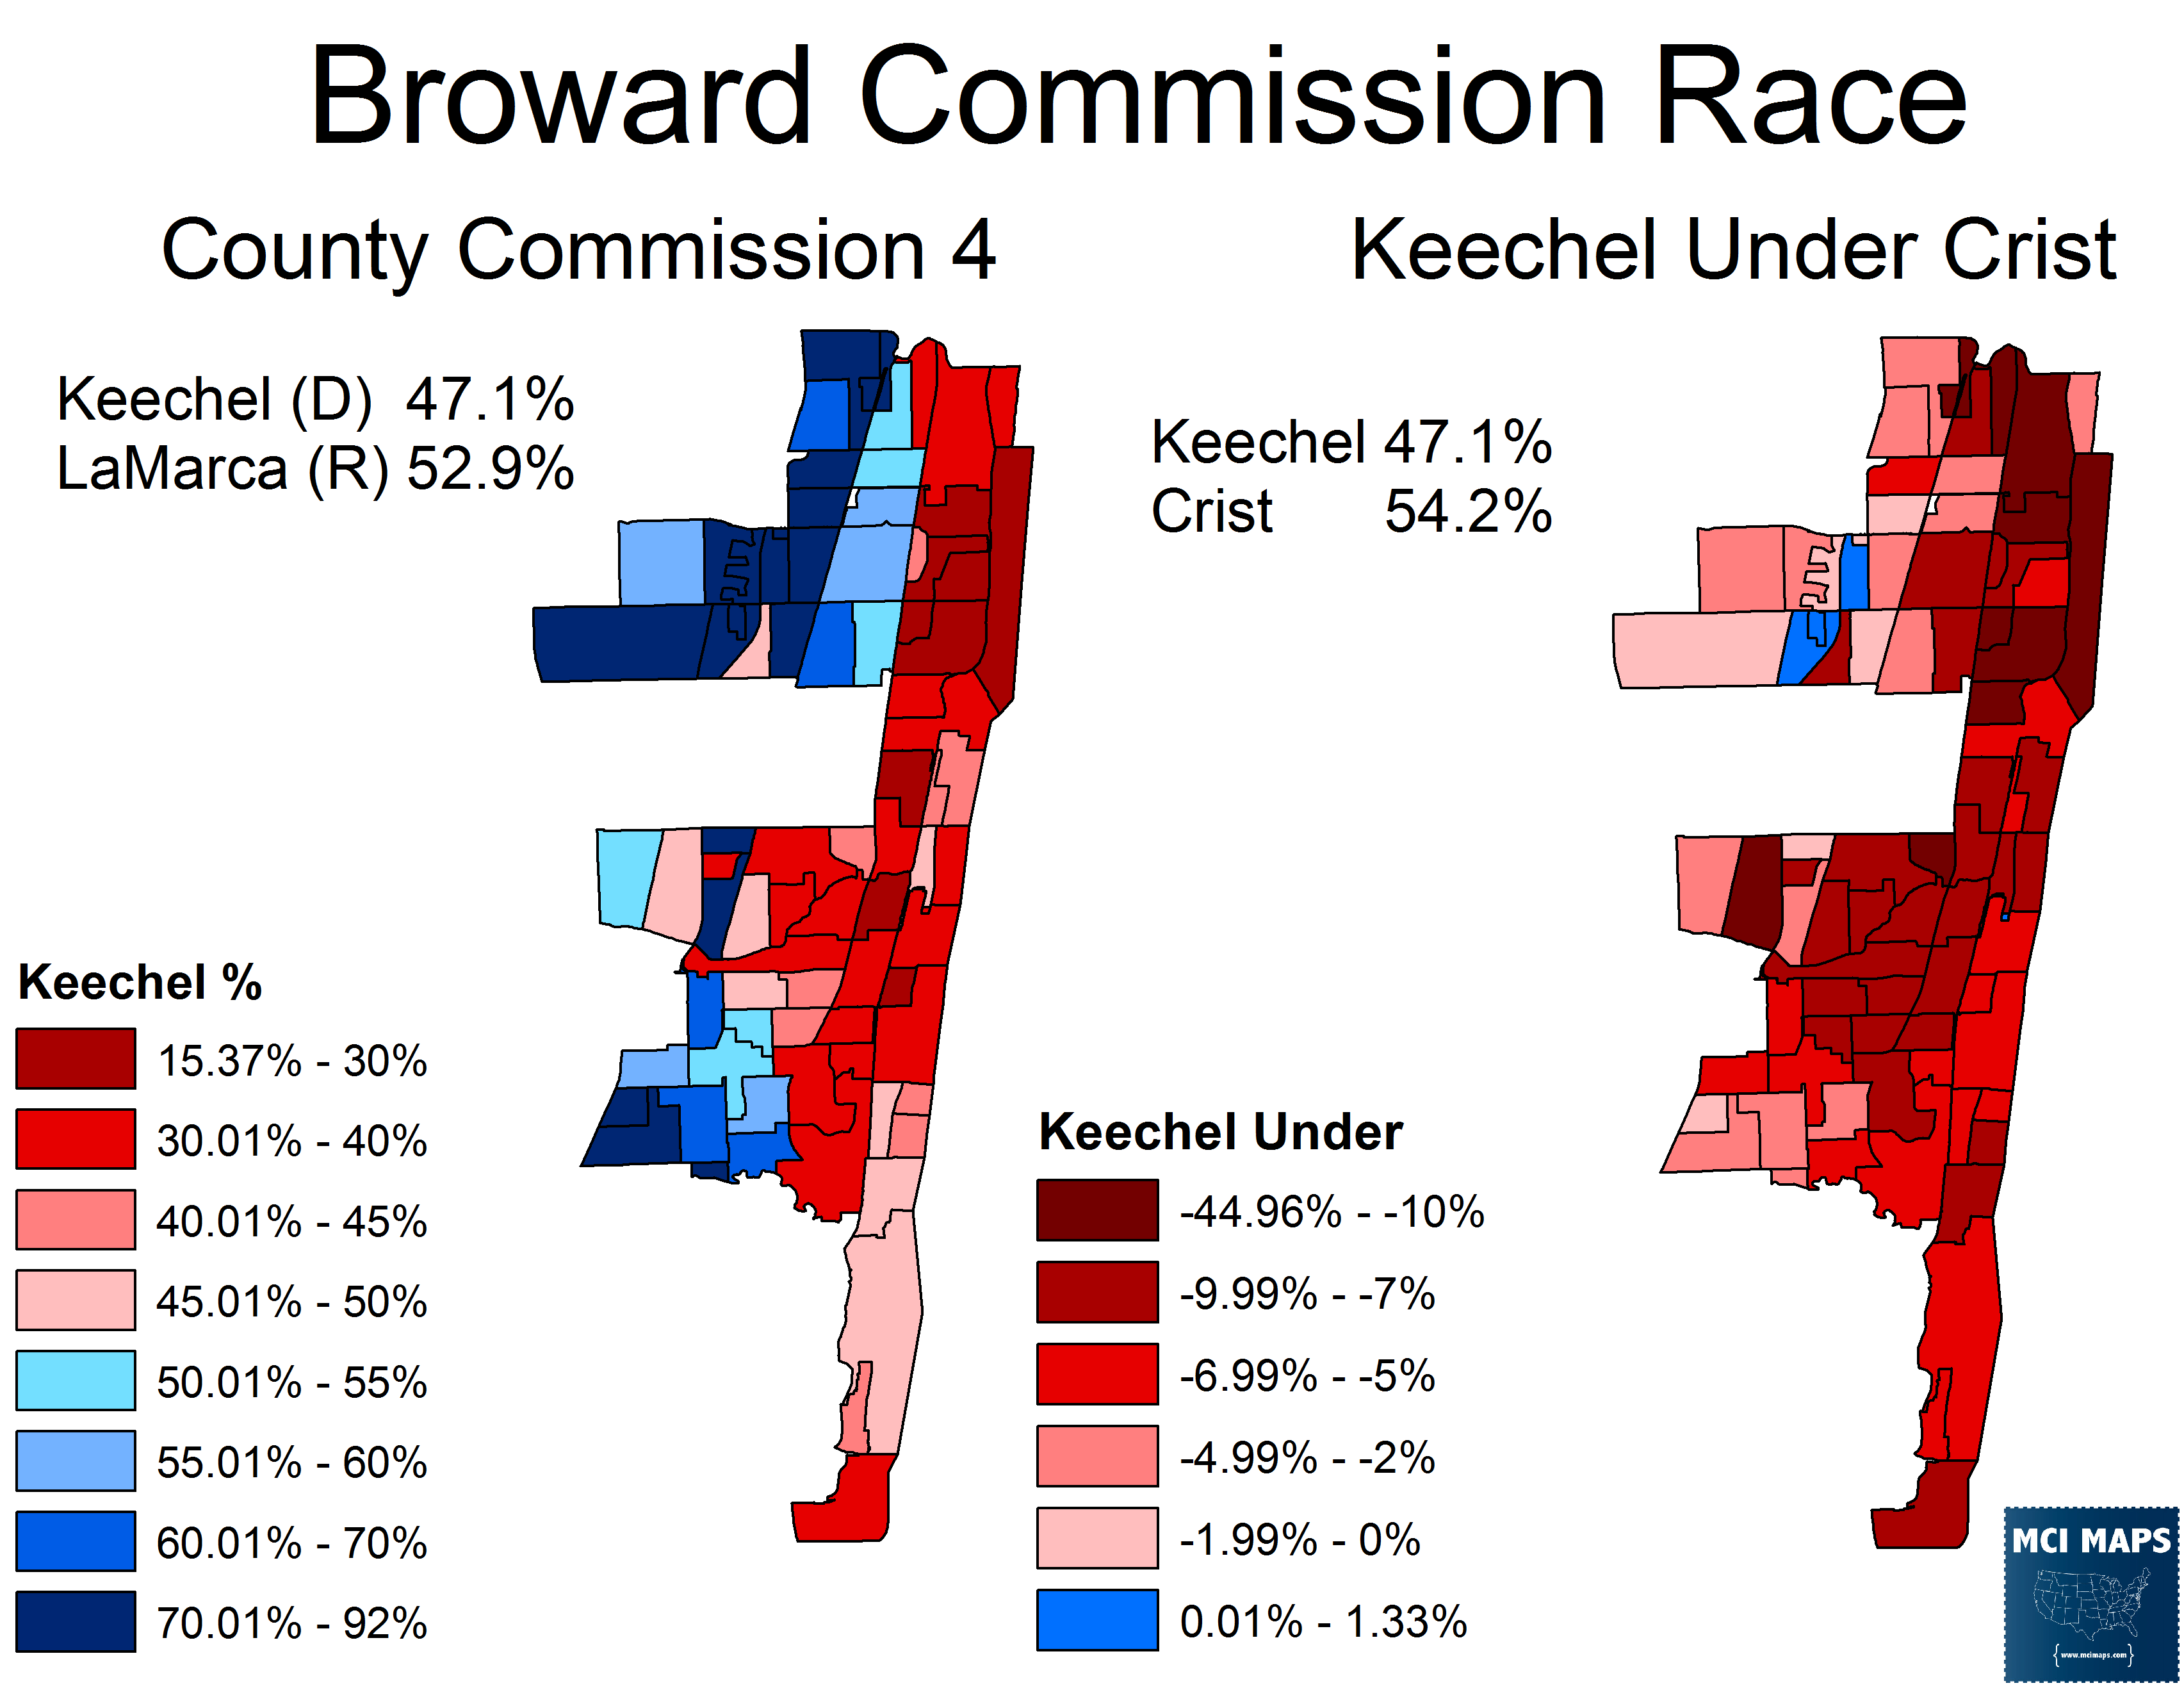
One big blow for local Democrats came out of Broward County. Until 2010, Democrats controlled all 9 of Broward’s county commission districts. Democratic Incumbent Ken Keechel lost to Republican Chip Lamarca in 2010. However, the commission redrew the lines in 2012 and made the district more Democratic. However, Keechel, seeking a rematch, fell short of taking back the seat 47.1% to 52.9%. Keechle framed the races as Democrat vs Republican. However, he was outspent by $300,000. Keechel’s votes were heavily tied to Crist (as the scatterplot below shows). However, he under-performed Crist in most precincts and especially in the heavily white, Republican coast. The loss in county 4 is a blow for Broward Democrats. LaMarca is strongly positioned to run for congress or state legislature from his coastal district. LaMarca benefited from Keechel having less funds and Keechel being seen as too much of a typical politician; he had run for a different county seat in 2012.
Calhoun County Commission: Districts 2 and 4
In Calhoun, NPA commissioner Darrell McDougald was re-elected in a four-way fight with 34% of the vote against two other NPA candidates and a Democrat. The Democrat came in last with only 17.5% of the vote. In the other district, Democrat Dennis Jones won re-election of an NPA candidate with 63% of the vote. The district was largely based out of the one heavily African-American precincts in Calhoun, the only one to vote for Charlie Crist. Democrats shouldn’t be too excited about Jones’ hold since the seat was African-American. They should be worried that a Democrat came in last in another district in county with overwhelming Democratic registration.
Columbia County Commission: District 4
Democrats made another under-the-radar pickup, this time in Columbia County. With Republicans previously controlled the commission 4-1 and only one seat being contested in November, Democrats could not gain control of the chamber. County Commissioners are elected on a non-partisan ballot, and party ID does not seem to play a major role in commission matters. In an open seat left by a retiring Republican, Democrat Everett Phillips won the seat with 52.6%. The district gave Rick Scott over 65% of the vote. The chamber now stands at 3-2 Republican control.
Dixie County Commission: District 4
Dixie County has made a stunning transformation in the last few election cycles. The commission used to be heavily Democratic. However, NPA candidates began winning the commission races and before long, the commission was 4 NPA candidates and 1 Democrat. In 2014, that last Democrat ran for re-election as a NPA candidate. Every candidate for the elections in district 2 and 4 were for NPAs despite candidates having the option to run with party affiliation. Democratic Incumbent Jason Holifield won re-election as an NPA with 66.5% of the vote.
Escambia County Commission: District 4
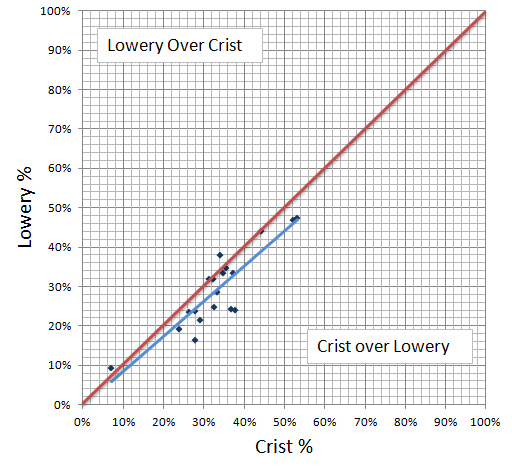
Local Democrats had hoped to make gains in the Escambia County Commission. However, those efforts ran into the wall of Crist’s unpopularity in the panhandle of Florida. Republican Grover Robinson managed to rack up 70% of the vote in his county commission district as the upper-income suburbs remained steadfastly Republican. Crist did slightly better than Democrat Mike Lowery. The two Democrat’s voters were fairly close together. However, as precincts became less hard-line Republican, Crist did slightly better.
Franklin County Commission: District 2
Democrat Cheryl Sanders was re-elected with 52.3% in a district that went strong for Rick Scott. Sander’s win was in spite of Franklin shifting further right, rejecting Crist and Graham by more than 15 points despite its history of supporting Alex Sink for Governor and Bill Nelson for Senate. This race serves as an example of a local Democrat surviving despite the top of the ballot shifting further red.
Gilchrist County Commission: Districts 2 and 4
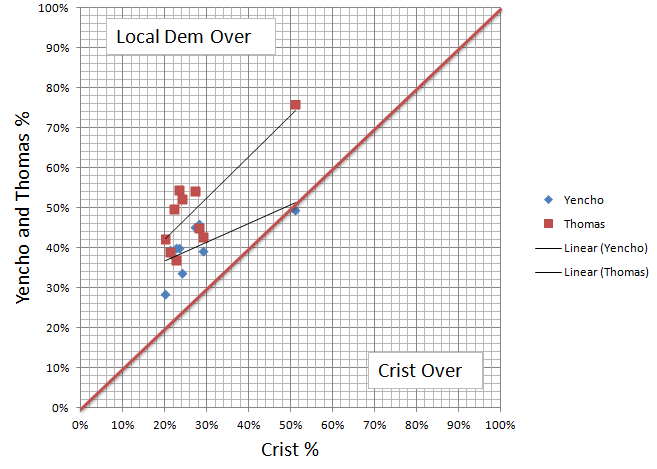
Gilchrist’s commission became more Republican in 2014. The commission was already 3-2 Republican, all elected at-large. In November, Democratic Incumbent John Rance Thomas lost to Republican challenger Marion Poitevint 47.8% to 52.2%. Crist, meanwhile, got just under 25% of the vote. The Gilchrist tea party made it a point to oppose Thomas, and Thomas went out of his way to separate himself from national Democrats. There were local controversies as well, involving business development and county administrative costs and salaries. Both local and national politics likely contributed to Thomas’s defeat. In another county commission race, Republican Incumbent Ray Harrison won re-election with 60.5% against a conservative Democrat, John Yencho.
As the scatterplot shows, Yencho and Thomas over-performed Crist. Only one precinct gave all three candidates similar percentages. That precinct has a large African-American population. The remaining precincts gave the two democrats varying levels of support while never giving Crist more than 30%. Both Democrats managed to keep their votes separate from Crist despite both losing.
Glades County Commission: Districts 1 and 4
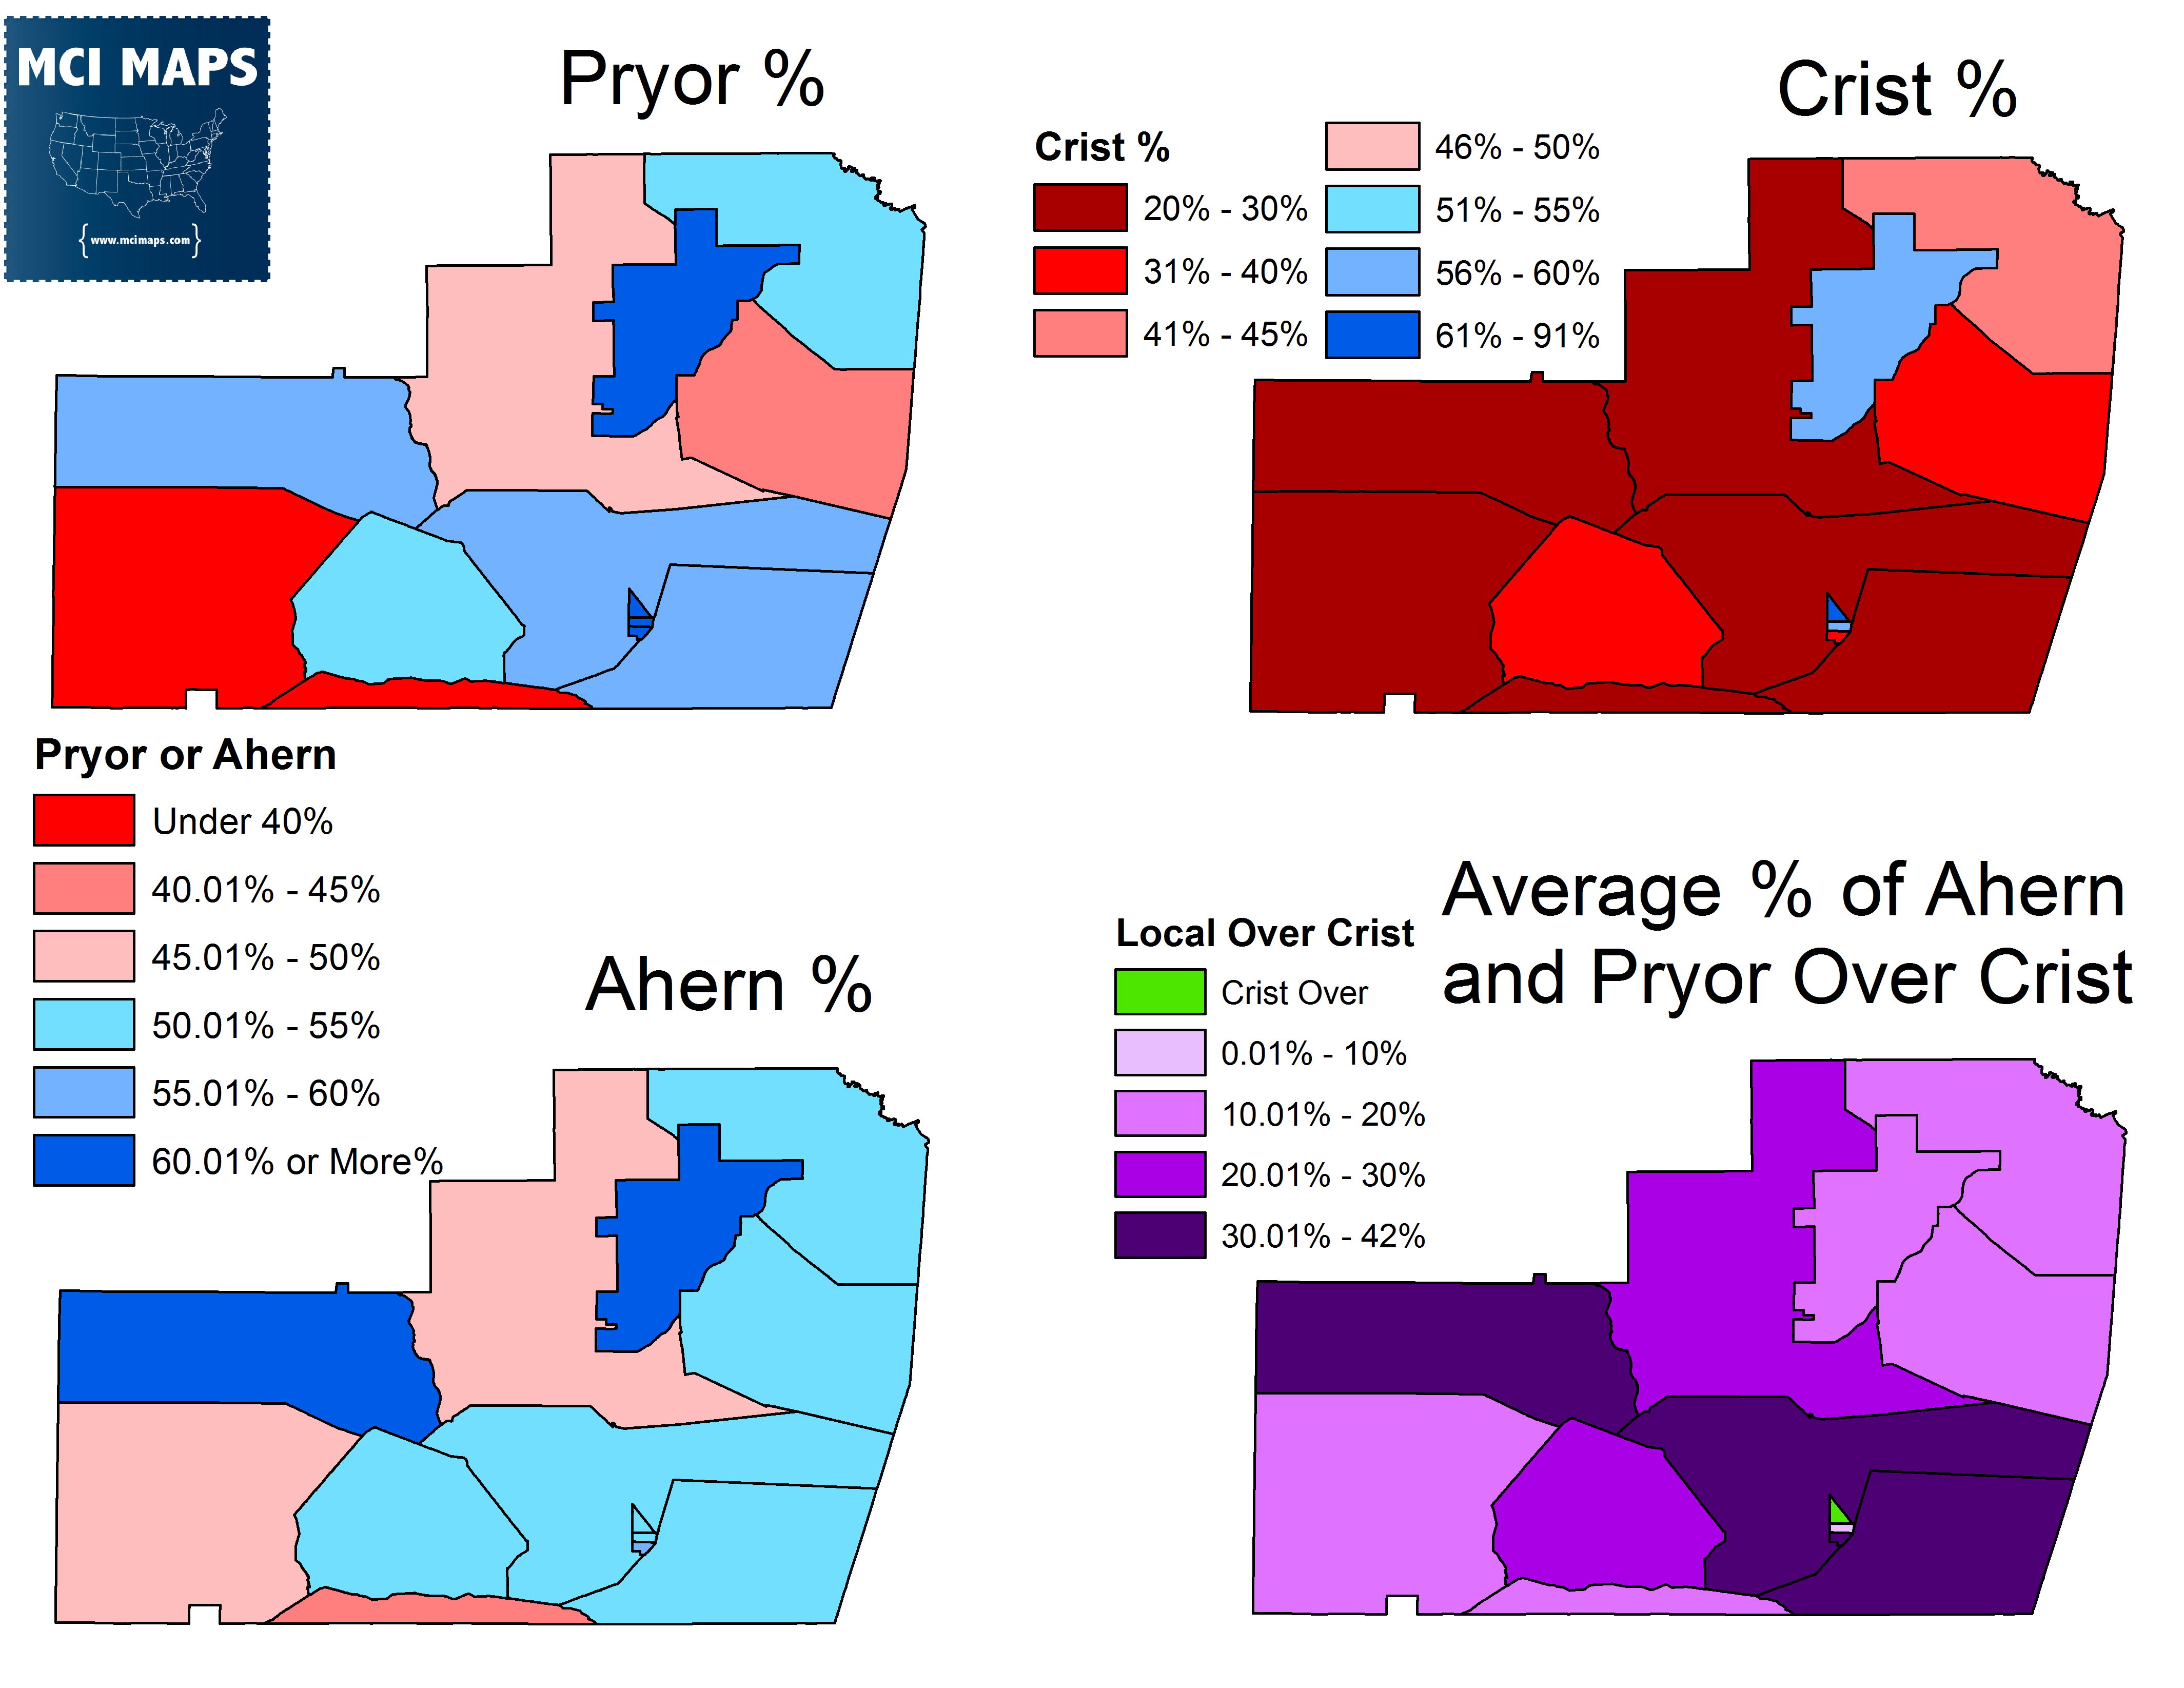
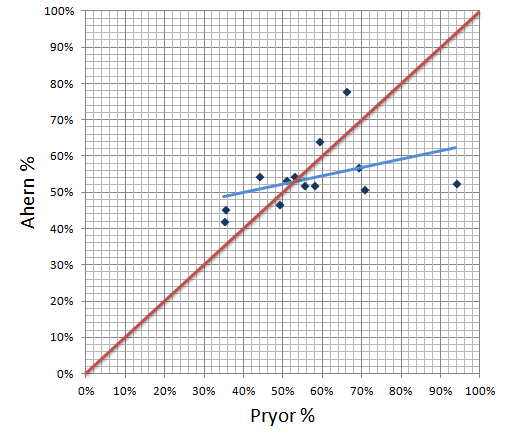
Democrats risked losing control of the Glades county commission in 2014. However, Democrats managed to hold the District 4 open seat, and won back district 1; beating a Rick Scott appointee. The result was Democrats returning to the 4-1 majority they held after the 2012 elections. In district 4, Democrat John Ahern got 51%. In district 1, Democrat Weston Pryor got 52%. The raw vote difference between both Democrats was only 36 votes. Despite having close vote totals, both candidates did better/worse in different precincts. As the scatterplot shows, the two Democrats’ vote was far from a perfect correlation (which the red line represents). The map below shows how Ahern and Pryor did compared to Crist.
Gulf County Commission: District 2
If I had to bet on which county commission would switch from Democratic to Republican control, I would have bet on Gulf. The 3-2 Democratic commission seemed poised to go 2-3 as Democrat Ward McDaniel fought for re-election is a district that gave Rick Scott 61% of the vote. McDaniel, however, managed to win with over 64% of the vote; even after being outspent 3-1. The result is a testament to local politics trumping national.
Hillsborough County Commission: At-Large
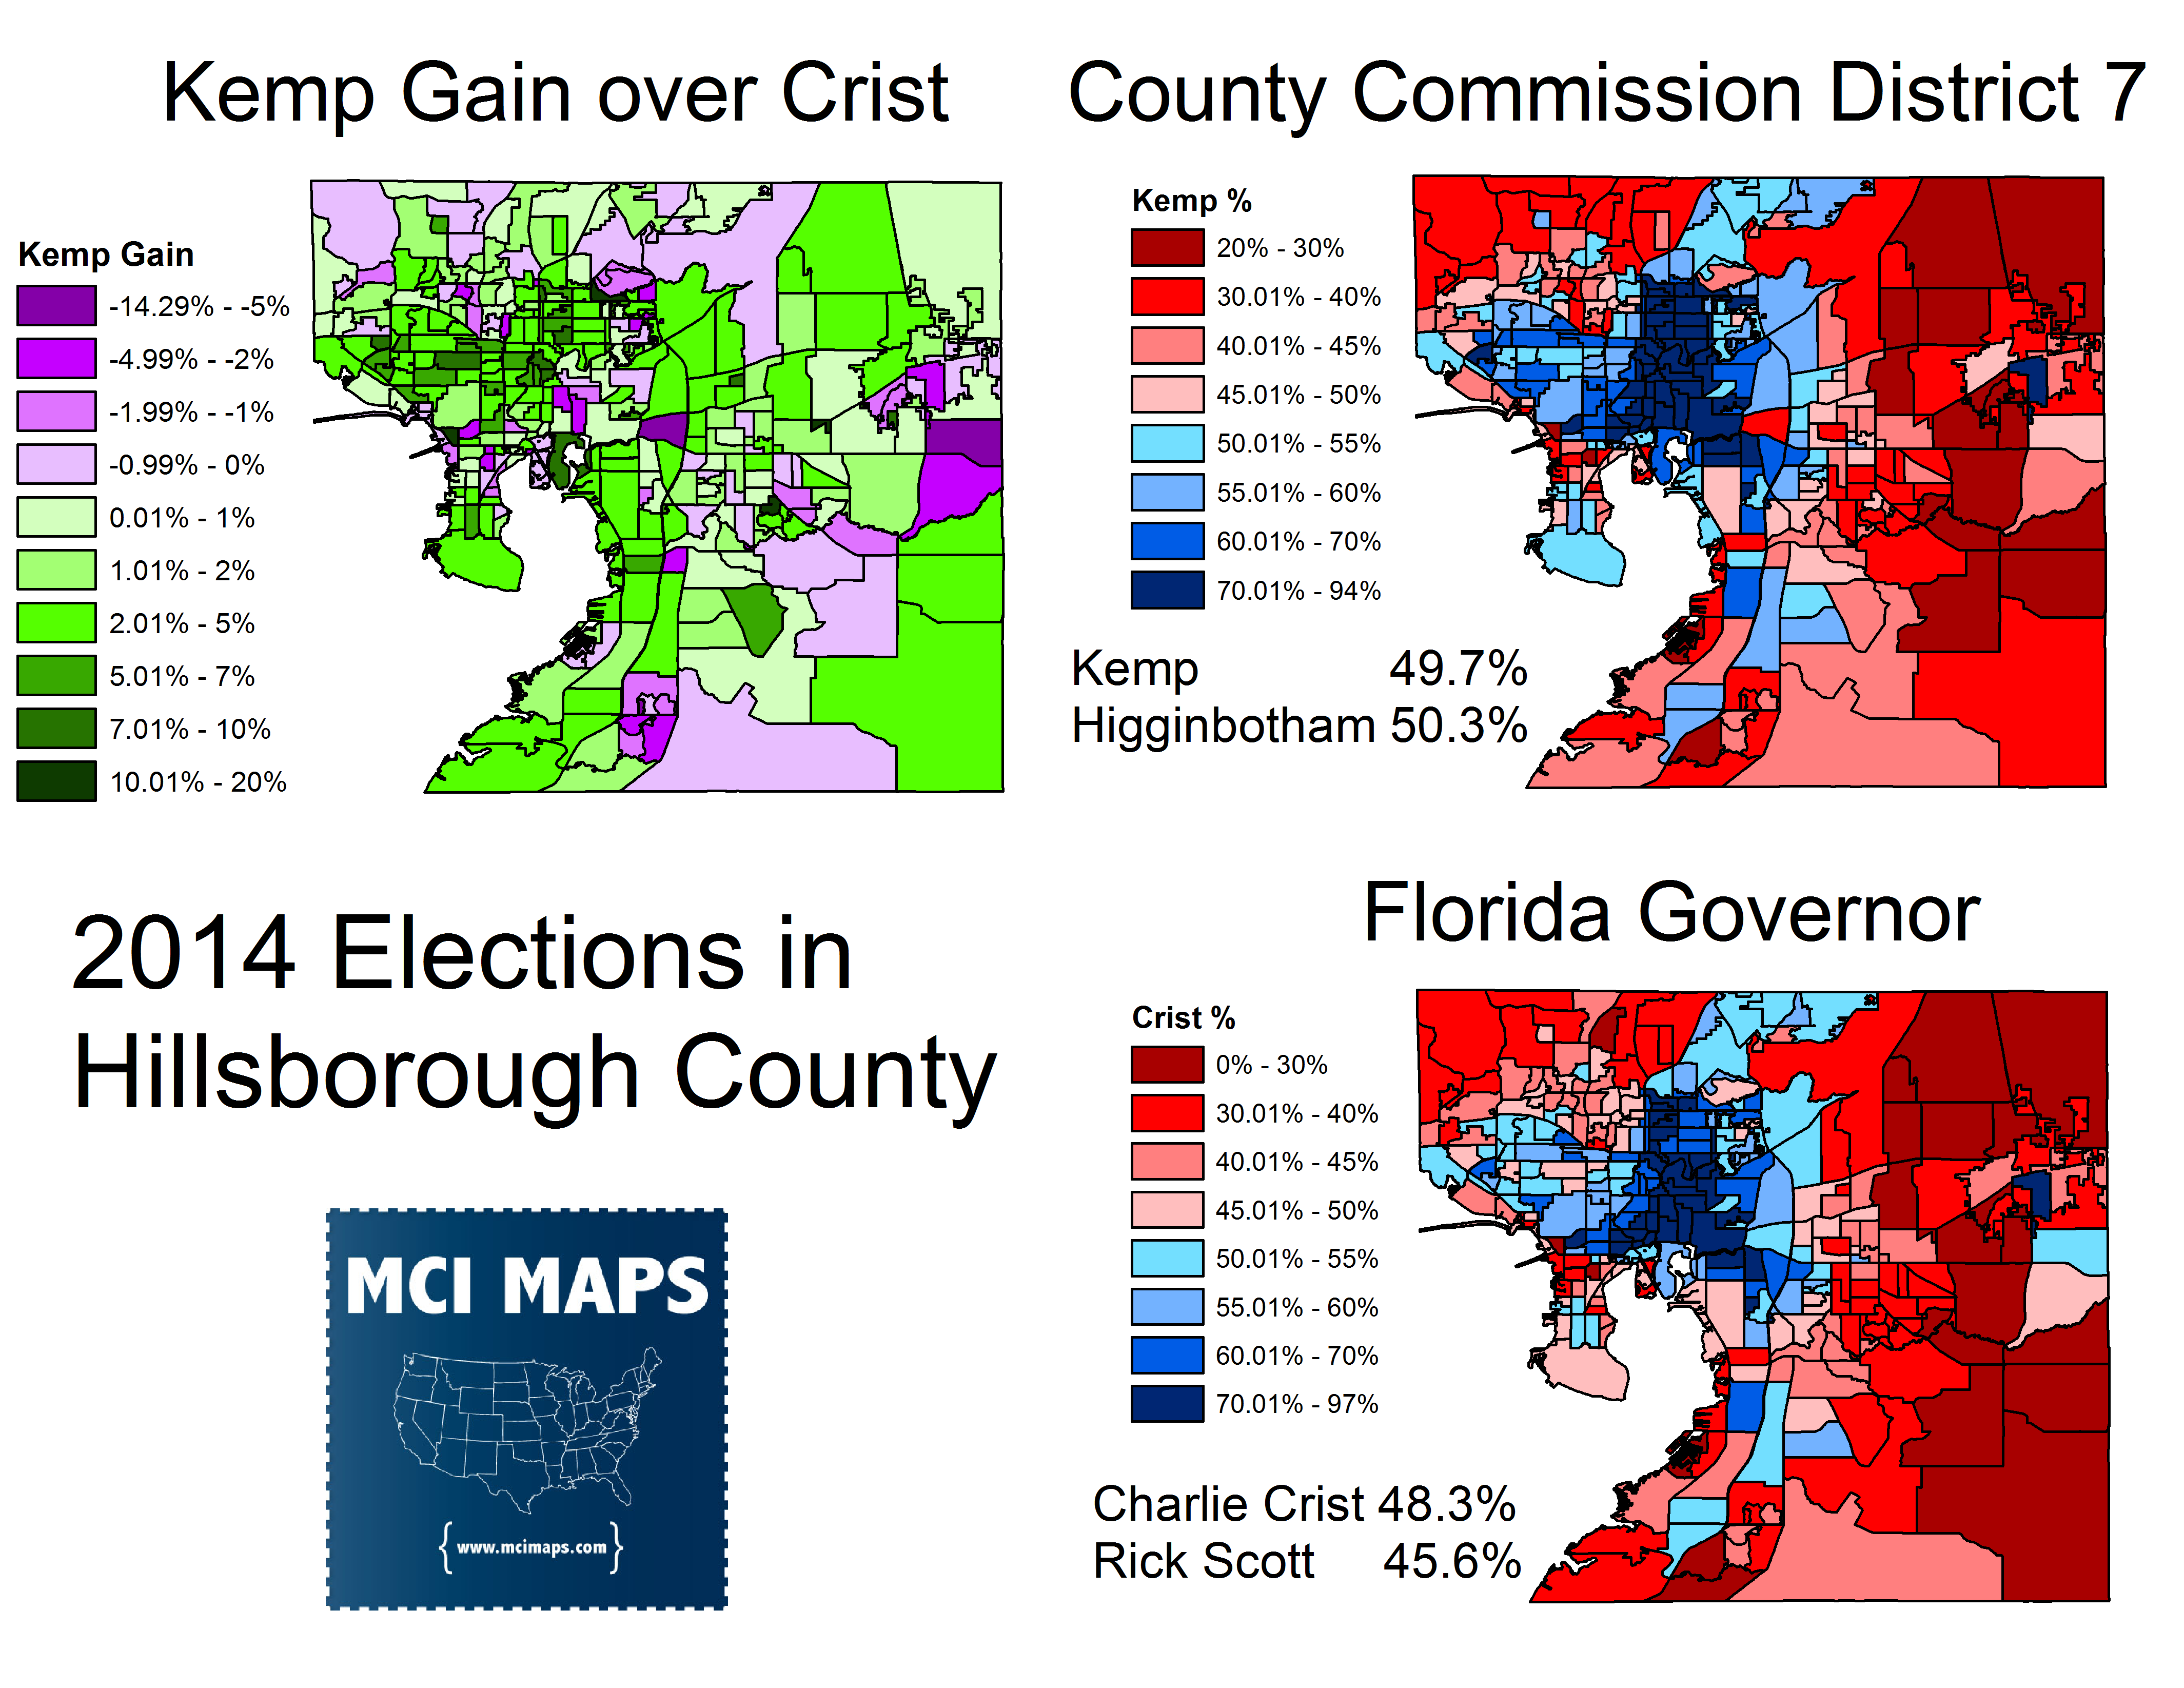
One of the heartbreaking local losses of 2014 was the Hillsborough County At-Large race. Democrats were hoping to pick up this seat with Pat Kemp. However, Republican Al Higginbotham narrowly won the seat by 2,000 votes. Kemp managed to get 49.7% of the vote, but was likely weighed down by Crist getting a very weak 48.2% plurality win in the county. 15,000 less votes were cast for the county commission race than for Governor. Kemp got 5,000 less votes than Crist. However, Higginbotham got 7,000 more votes than Scott. Higginbotham who served on the commission in a single-member seat, likely won some Crist voters and votes from 22,000 who votes for third party candidates for governor.
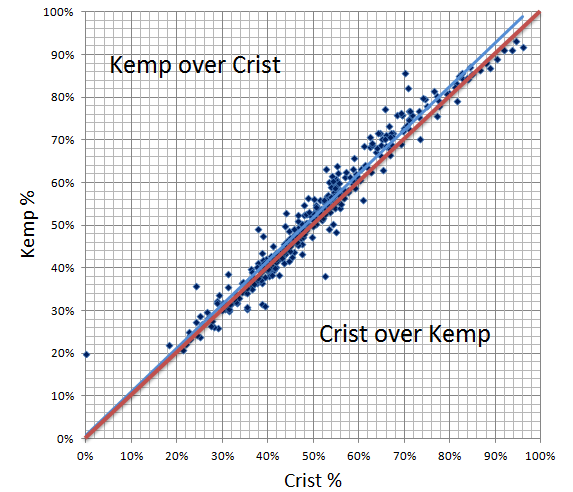
Crist and Kemp’s percentages were tied closely together. Kemp outperformed Crist in most of the precincts. Kemp’s over or under performing Crist had little to do with racial makeup of precincts. In addition, precincts with a larger under-vote (people skipping the county race) were split among precincts that gave Kemp more support and those that gained less. Kemp did under-perform Crist among the most heavily Democratic precincts (which were heavily African-American). However, she beat out Crist in most of the heavily Democratic areas and other African-American precincts..
Jackson County Commission: Districts 2 and 4
In my view, one of the most consequential local elections of 2014 where in Jackson County, where a political earthquake resulted from the election of two Republicans to local office for the first time in Jackson County’s history. District 2 Incumbent Democrat Edward Crutchfield lost re-election with 49.4% of the vote in a 2010 rematch against Republican Clint Pate. In the seat left open by Jeremy Branch, Democrat Alvin Roberts only received 36.5% of the vote to Republican Eric Hill’s 50.9% (the rest going to NPA candidates). Both districts were heavily Republican, with district 4 giving Crist around 28% and district 2 giving him 38%. The county splits its precincts between county commission districts, making precinct-comparisons imperfect. However, in the four precincts that were entirely in one specified district, the votes for Crist and the Democratic candidate for commission were not tied together. Jackson County stood out as the last county in Florida to never elect a Republican to county office. With 2014′s results, Republicans could begin to make a play for other commission districts and constitutional offices. Jackson County should serve as a wake up call for North Florida democrats. As Republican strength grows down ballot, upper ballot races in the region will become even tougher than they are right now and Congresswoman Gwen Graham cannot afford to see Jackson county trend further to the right.
Jefferson County Commission: District 4
In an off-the-radar race, Democratic Incumbent Betsy Barfield won re-election against NPA Troy Avera 53.2% to 46.8%. Jefferson leans Democratic thanks to the ancestral white Democrats, some state employees, and a large African-American population. The county often gives competitive Democrats between 50% and 55% of the vote. Local Republicans have been making inroads, taking Superintendent and nearly taking tax collector in 2012. One NPA commissioner already serves with four democrats. The district, comprising of only 3 precincts, narrowly voted for Scott. Barfield’s vote was modestly tied with Crist, with Barfield over-performing him in all three precincts.
Lafayette County Commission: Districts 2 and 4
Lafayette produced a mix bag for Democrats, who held control of the commission 5-0 before 2014. In district 2, the Democrat won with 59% of the vote, while in district 4 the Democratic candidate only got 43% of the vote. The winning Democrat won all 5 precincts, while the losing Democrat only got 1. The result is Democrats retaining control of the commission 4-1 and both did much better than Crist. However, the loss of one Democratic seat shows a continued Republican growth down-ballot.
Liberty County Commission and Superintendent
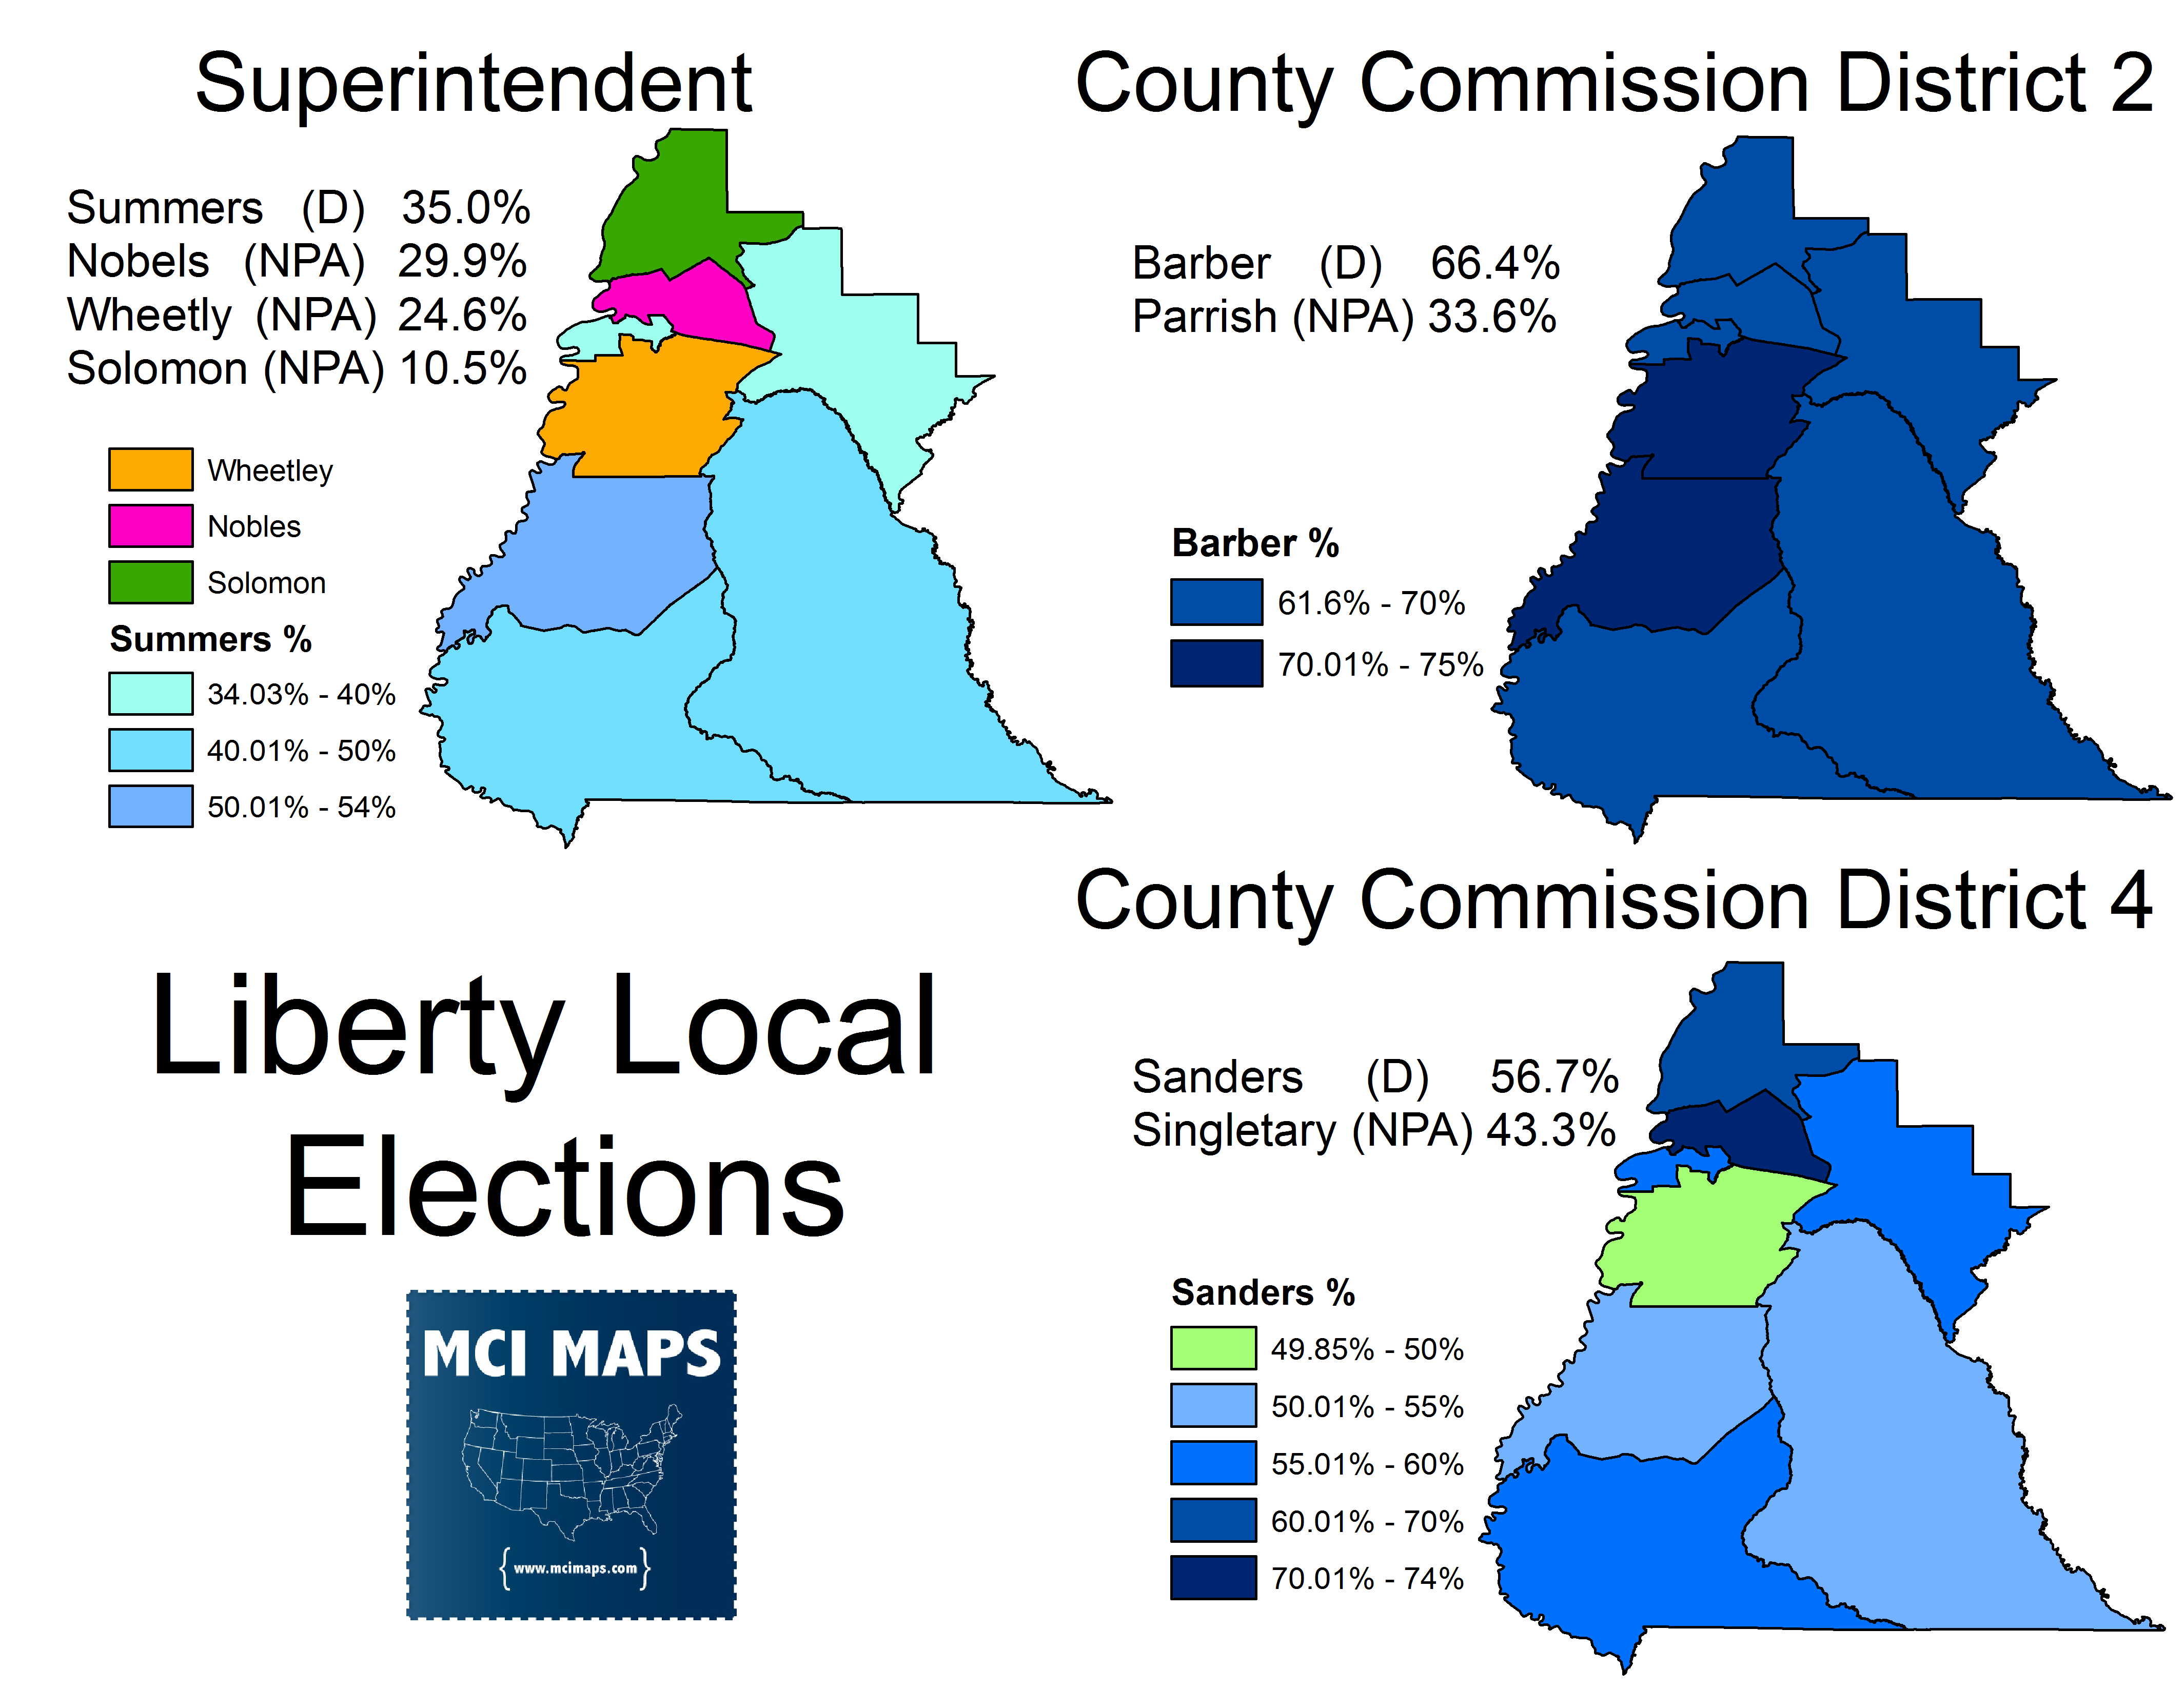
North Florida Democrats have been feeling the pressure from NPA candidates in recent elections. In addition, Liberty trended further right in 2014. Both Gwen Graham and Charlie Crist got around 34% of the vote (Gwen getting 34.7% to Crist’s 33.7%). The county had voted for Sink in 2010 and Nelson in 2012. However, it remained stubbornly Republican in 2014, giving Graham the second weakest gain over Crist of any county in CD2. Despite upper-ballot troubles, Democrats managed to hang on at the local level. Both County Commission seats stayed Democratic against NPA opposition. In district 2, Incumbent Dexter Barber won with 66.4% of the vote. In district 4, James Sanders won the open seat with 56.7%. In the Superintendent race, Democrat David Summers won with 35% of the vote against 3 NPA opponents. Summers’ win is especially notable since he only spent $700 in the race. For now, the Democratic near-monopoly at the local level holds with 5-0 commission control and 5 of the 6 constitutional officers. However, top of ballot woes have gotten worse.
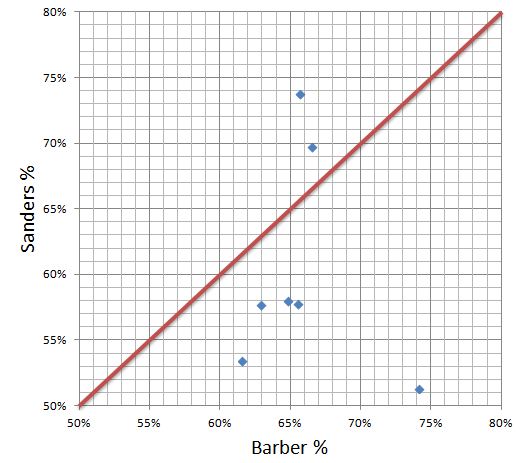
In the county commission races, the two Democratic candidate’s percentages were not closely tied to each other. Barber, an incumbent ran stronger, but Sander’s did better in the two most African-American precincts (the top two in the northwest corner of the district). In the superintendent race, Summer’s won despite an African-American NPA candidate winning the counties lone African-American majority precinct. While local Democrats did very well in Liberty. Their individual wins were not because voters cast ballots by party straight down the ballot, but rather individual dynamics in each race. The scatter-plot shows that Barber and Sander’s percentages did not correlate, while the map shows how each Democrat won.
Manatee Commission At-Large
Manatee was a dark horse county that could have gone to Crist in the right environment. However, as the Crist campaign faltered across the state, Manatee wound up giving Crist just 41.3%, worse than Obama had gotten in 2012. As a result, Democratic commission candidate Terry Wonder got 40.3% after being outspent by a large margin. In this suburban county, both candidates had their votes tied fairly close together. However, in several suburban precincts, Crist or Wonder beat out the other.
Miami-Dade Commission: District 8
Miami-Dade hosted its non-partisan elections for county commission in August. Most races do not get excessively partisan in the county. However, the August race for district 8 (located in the southern part of the county where Homestead lies), became extremely partisan. Democrat Daniella Levine Cava defeated Republican Incumbent Lynda Bell 52% to 48%. Unions and the local Democratic party heavily back Cava while Republicans pushed for Bell. Her win resulted in a commission of 6 Democrats, 6 Republicans, and 1 No Party candidate. The commission recently named Jean Monestime, a Democrat, its new chair.
Orange County Commission and Clerk of Courts, Amendment C
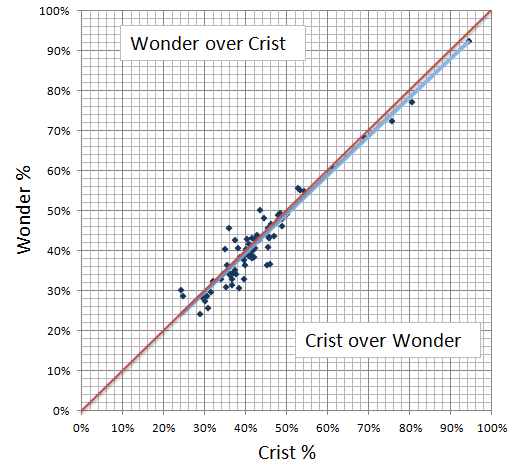
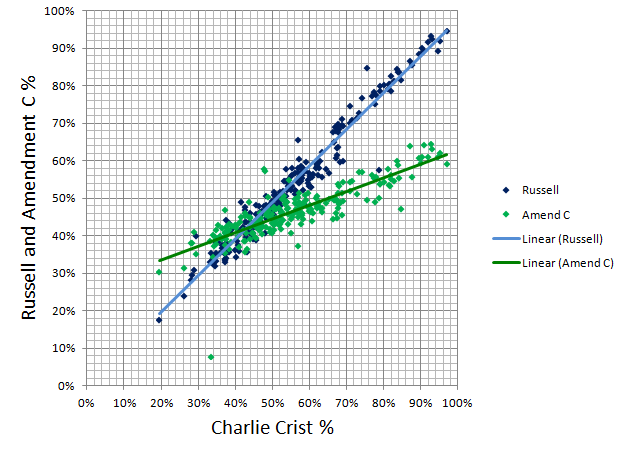
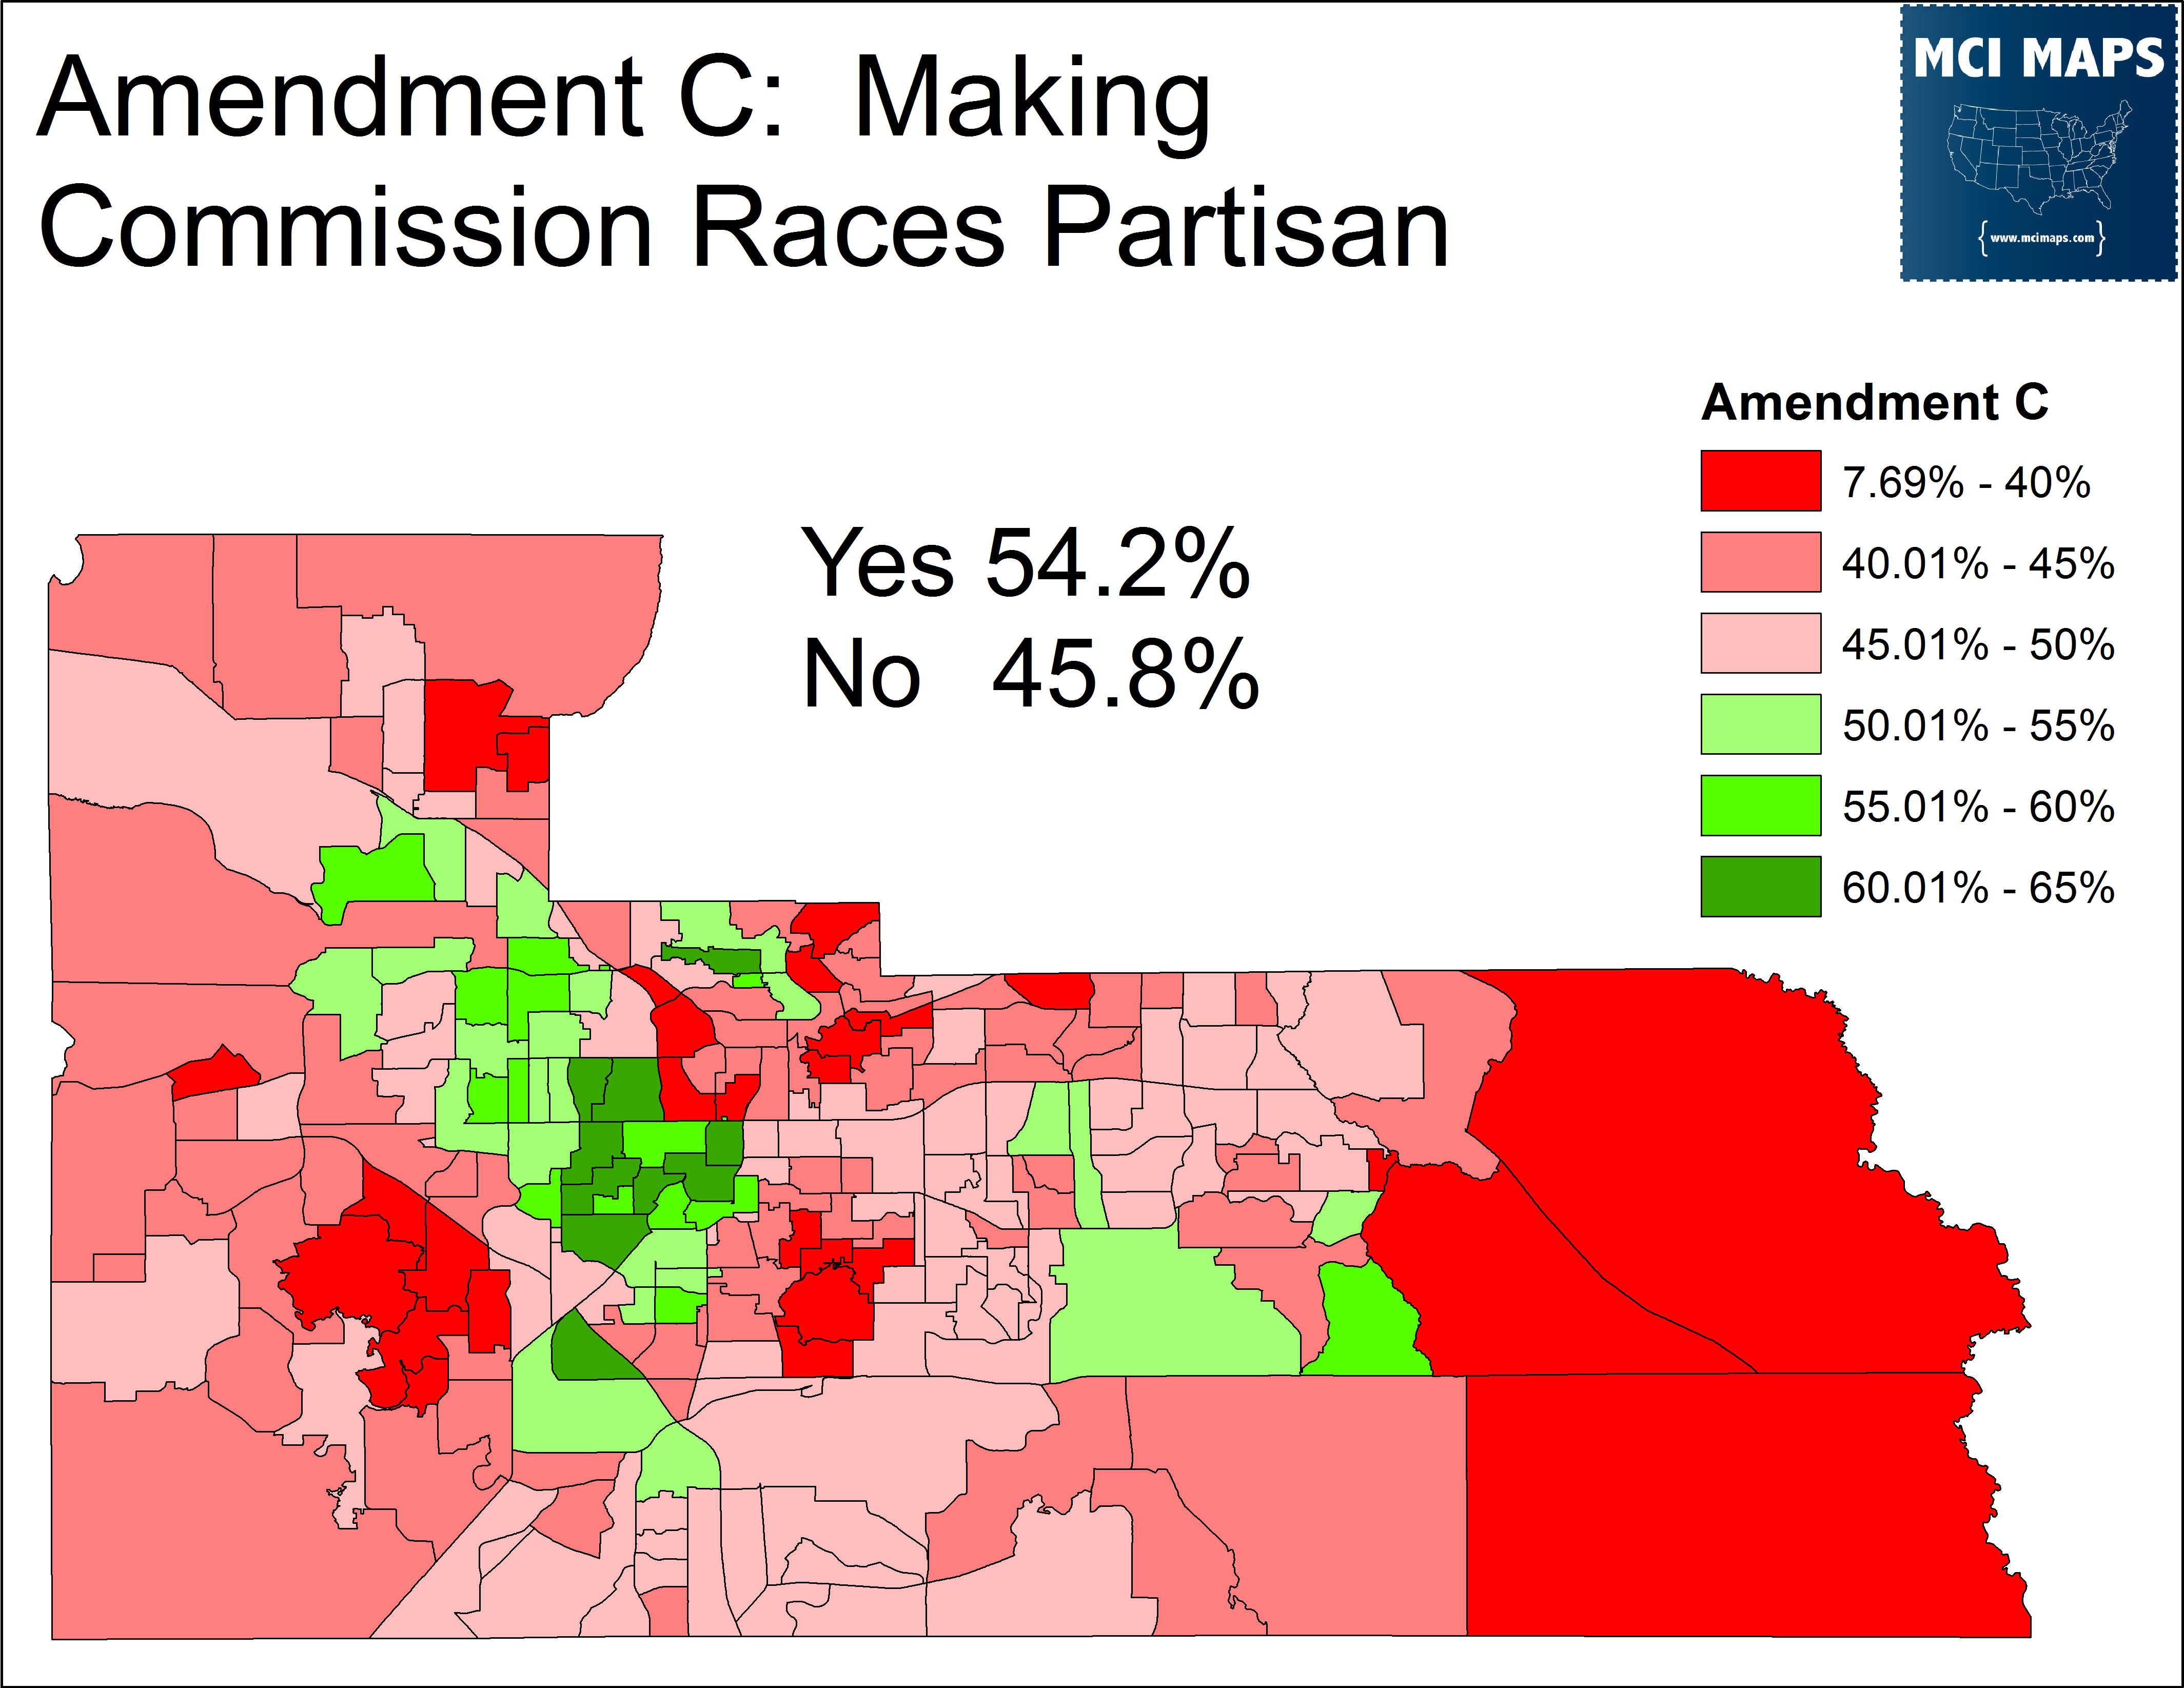
Orange county was bad for Democrats in 2014. Three House Democrats in the county lost re-election and Crist got a weak 53%. Democrats failed to pick up County Commission Seat 2, receiving only 41% despite Crist receiving 54%. However, the race being non-partisan on the ballot likely did not help matters. Democrats also failed to pass Amendment C, which would have made county commission races partisan. In a cruel irony, another amendment that would make Constitutional Officers non-partisan did pass. Democrats did manage to win the Clerk of Courts race. Democratic candidate Tiffany Moore Russell got 52% to Republican Incumbent Eduardo “Eddie” Fernandez’s 48%.
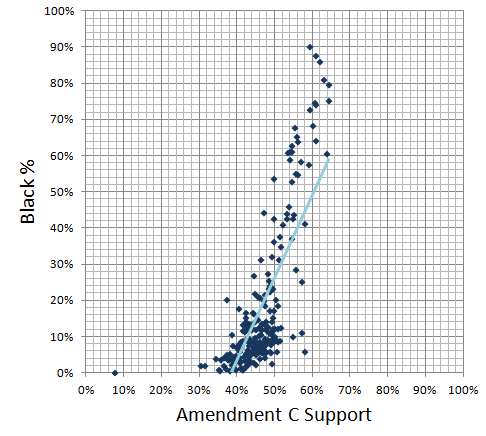
Russell won the Clerk of Court race by sticking close to Crist in most precincts. Both candidates vote’s strongly correlated with each other. While Crist was white and Russell is black, Russell did not do especially better with African-Americans. On the same notion, some areas where Russell did better than Crist were largely white. Crist actually did 0.8% better than Russell in her county commission district. Amendment C did correlate to smaller degree with Crist votes. However, as the scatter-plot shows, it under-performed Crist and Russell in more Democratic areas. That said, Amendment C had its strongest support in the African-American areas; with precincts voting Yes being almost exclusively African-American majority/plurality. The second scatterplot shows that Amendment C support grew as African-American percentages increased. However, Amendment C failed because it was weaker with white and Hispanic voters, and wasn’t strong enough with African Americans. In the County commission race, Democrat Alvin Moore under-performed Crist across the precincts. However, as the scatter-plot for the race shows, Moore’s percentages did increase as Crist’s did. Despite not having a D next to his name, Moore and Crist still had a respectable vote correlation. However, many voters clearly defected away for the county race.
Osceola County Commission: Districts 2 and 4
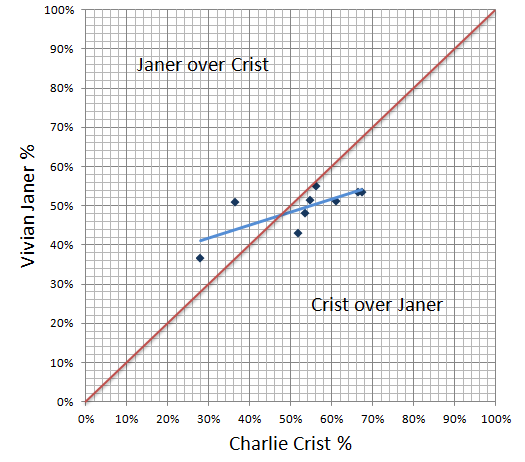
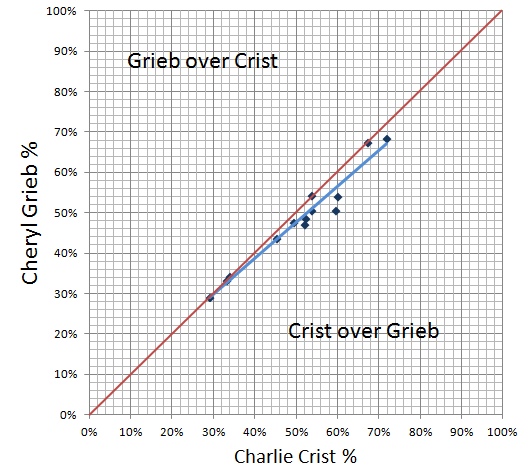
Democrats succeeded in taking control of the Osceola county commission after picking up two seats in 2014. Districts 2 and 4 were both held by Republican Incumbents facing strong Democratic challengers. In district 2, Democrat Viviana Janer beat Republican John Quinones 51.2% to 48.8%. The district gave Crist 61% of the vote, which was too much for Quinones, a popular local Republican, to overcome. Democrats will be glad to be rid of Quinones, who could have been a major threat for CD9 in future elections. Meanwhile, in district 4, Democrat Cheryl Grieb beat Republican Incumbent Frank Attkisson 47.6% to 46.7% (with the rest going to a third candidate). District 4 gave Crist 49.3% of the vote to Scott’s 44.5%. Just last week, as the ban on same-sex marriage lifted, Grieb and her partner were the first same-sex couple to marry in Osceola County.
As the scatter-plot’s below show, Grieb and Crist had strong vote correlations in district 4. However, in district 2, Janer and Crist’s vote totals were not correlated. This could be largely thanks to Quinones’ strong popularity.

Palm Beach County Commission: District 4
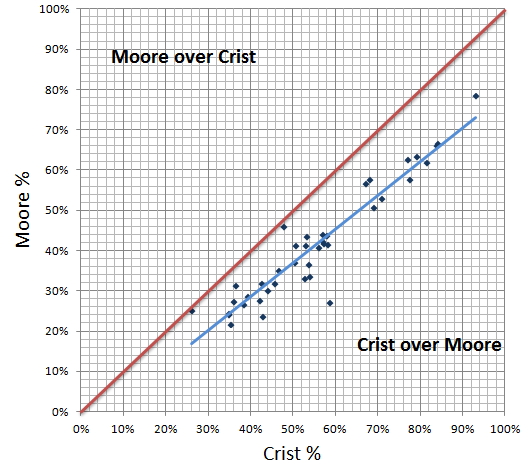
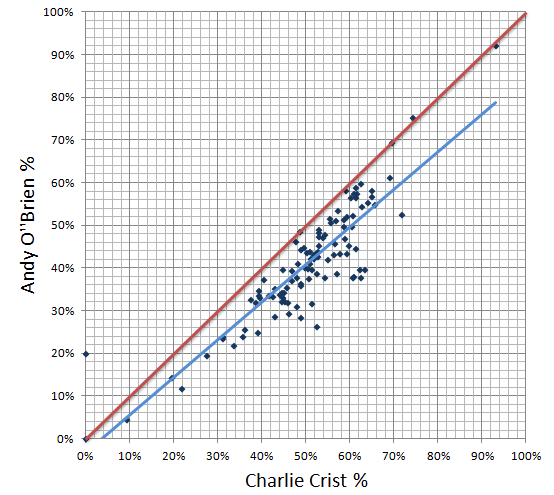
Republican Commissioner Steven Abrams defeated Democrat Andy O’Brien with 59.2% of the vote. Charlie Crist won the district with 50.8%, however, O’Brien was unable to capitalize. Abrams’ 2-1 money advantage no doubt helped. O’Brien’s vote share had a modest correlation with Crist’s. However, O’Brien under-performed Crist in nearly every precinct.
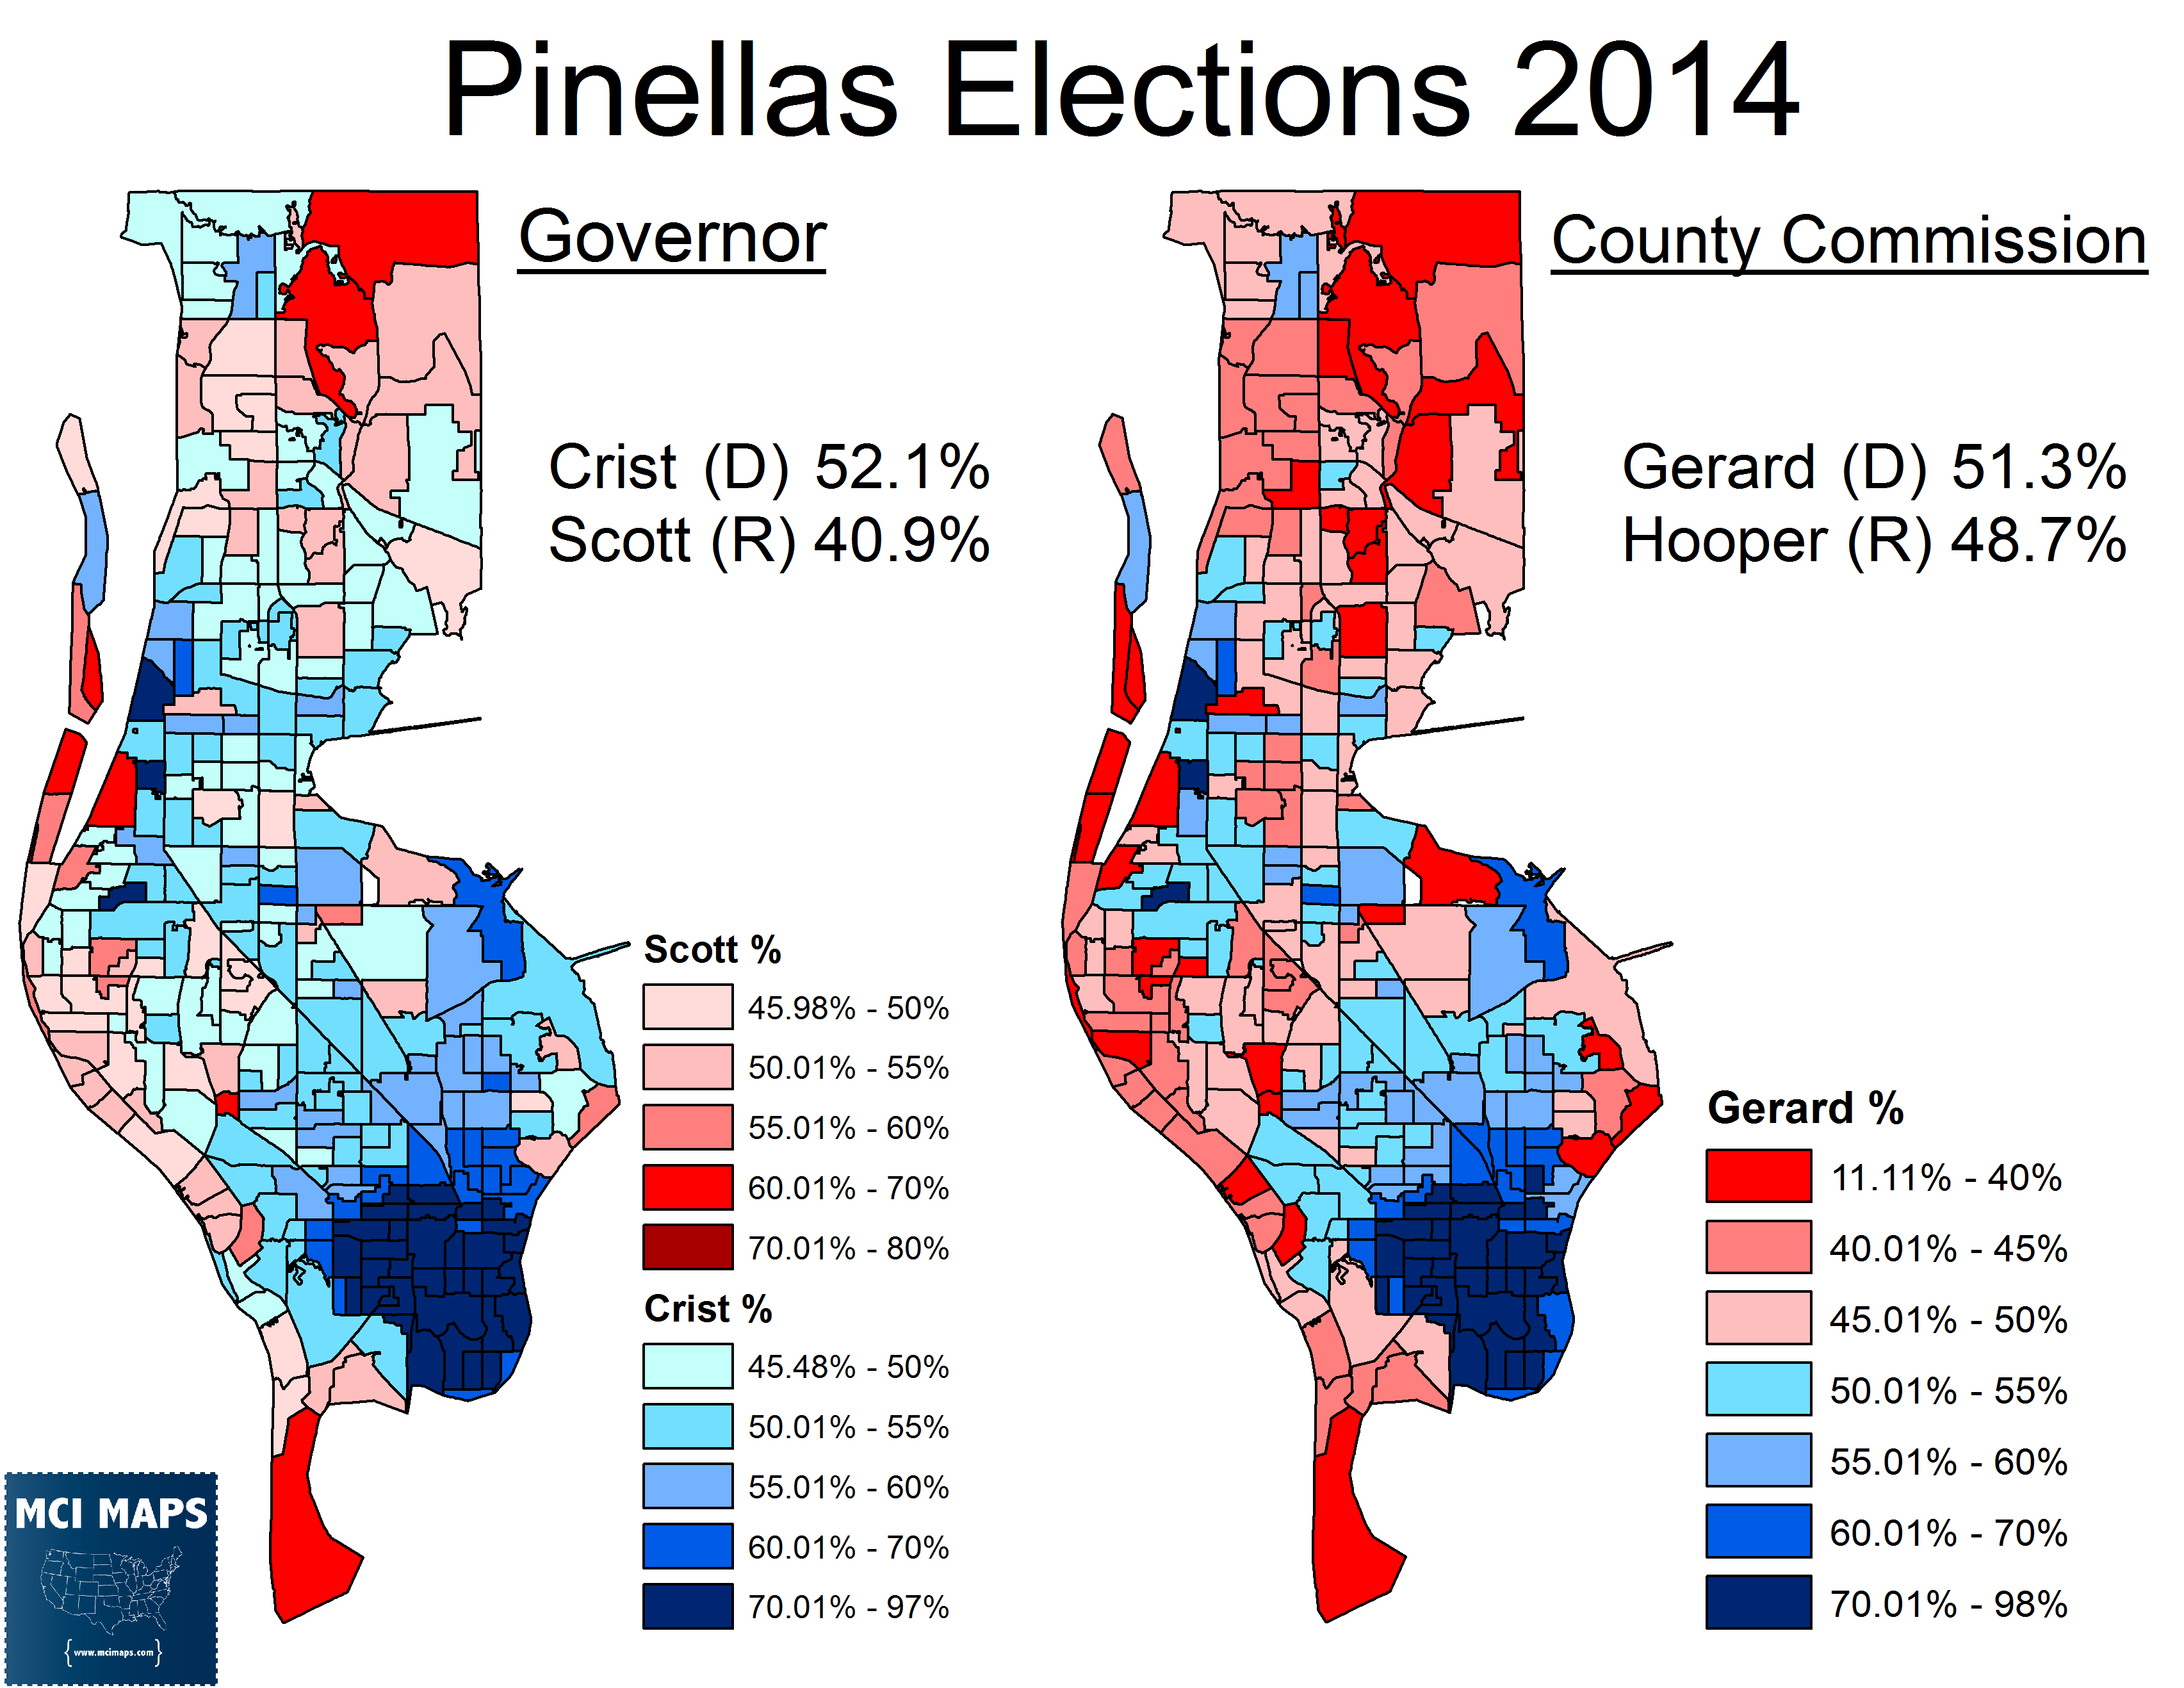
Pinellas County Commission: At-Large and District 4
Democrats took control of the Pinellas commission by winning their third at-large congressional district in two years. Before 2012, Democrats controlled 1 of the 7 commission districts (4 are in single-member districts, 3 are at-large). Democrats initially held just the African-American majority district. Then, in 2012, Democrats won the two at-large districts that were both up that year. In 2014, Democrats were making a play for the last at-large seat. Democrats nominated Largo Mayor Patricia Gerard, while Republicans nominated State Representative Ed Hooper. Hooper actually beat the incumbent Republican commission in the August primary. When the general election came, Gerard won 51% of the vote. The same day, Charlie Crist won 52%; actually a fairly mild showing considering Pinellas is his home county. Gerard and Crist’s percentages were closely tied together.
Meanwhile, in district 4, Republican Dave Eggers won with 60.9% of the vote against Democrat Mark Weinkrantz’s 32.9% (the rest going to NPA candidates). Crist won lost the district 45.8% to Scott’s 47%. Weinkrantz percentages had some correlation with Crist’s, however, he under-performed Crist across the board. The two scatterplots below shot how Gerard and Weinkrantz’s percentages related to Crist. The map shows Crist’s win in Pinellas next to Gerard’s.


Suwannee County Commission: District 4
Democrats picked up a seat for the Suwannee County Commission. This race was off my radar, as Republicans maintained a 4-1 advantage and a pickup wouldn’t have shifted control. Democrat Larry Carl Sessions won the district with 50.4% to Republican Harry K. Weaver’s 49.6%. Every precinct in the district voted heavily for Rick Scott. Sessions spent $9,000 compared to Weaver’s $3,000. The result gives Republicans 3-2 control of the commission.
Taylor County Commission: District 4
Democrat Pam Feagle won re-election to the Taylor County Commission, winning 65.6% to Republican David Woods’ 34.4%. Feagle sits in an overwhelmingly Republican district, but managed to win every precinct despite Crist loosing them all.
Final Result
As a result of the county commission elections, Democrats took control of two chambers; Pinellas and Osceola. In addition, Republican-controlled Miami-Dade was put into a tie.
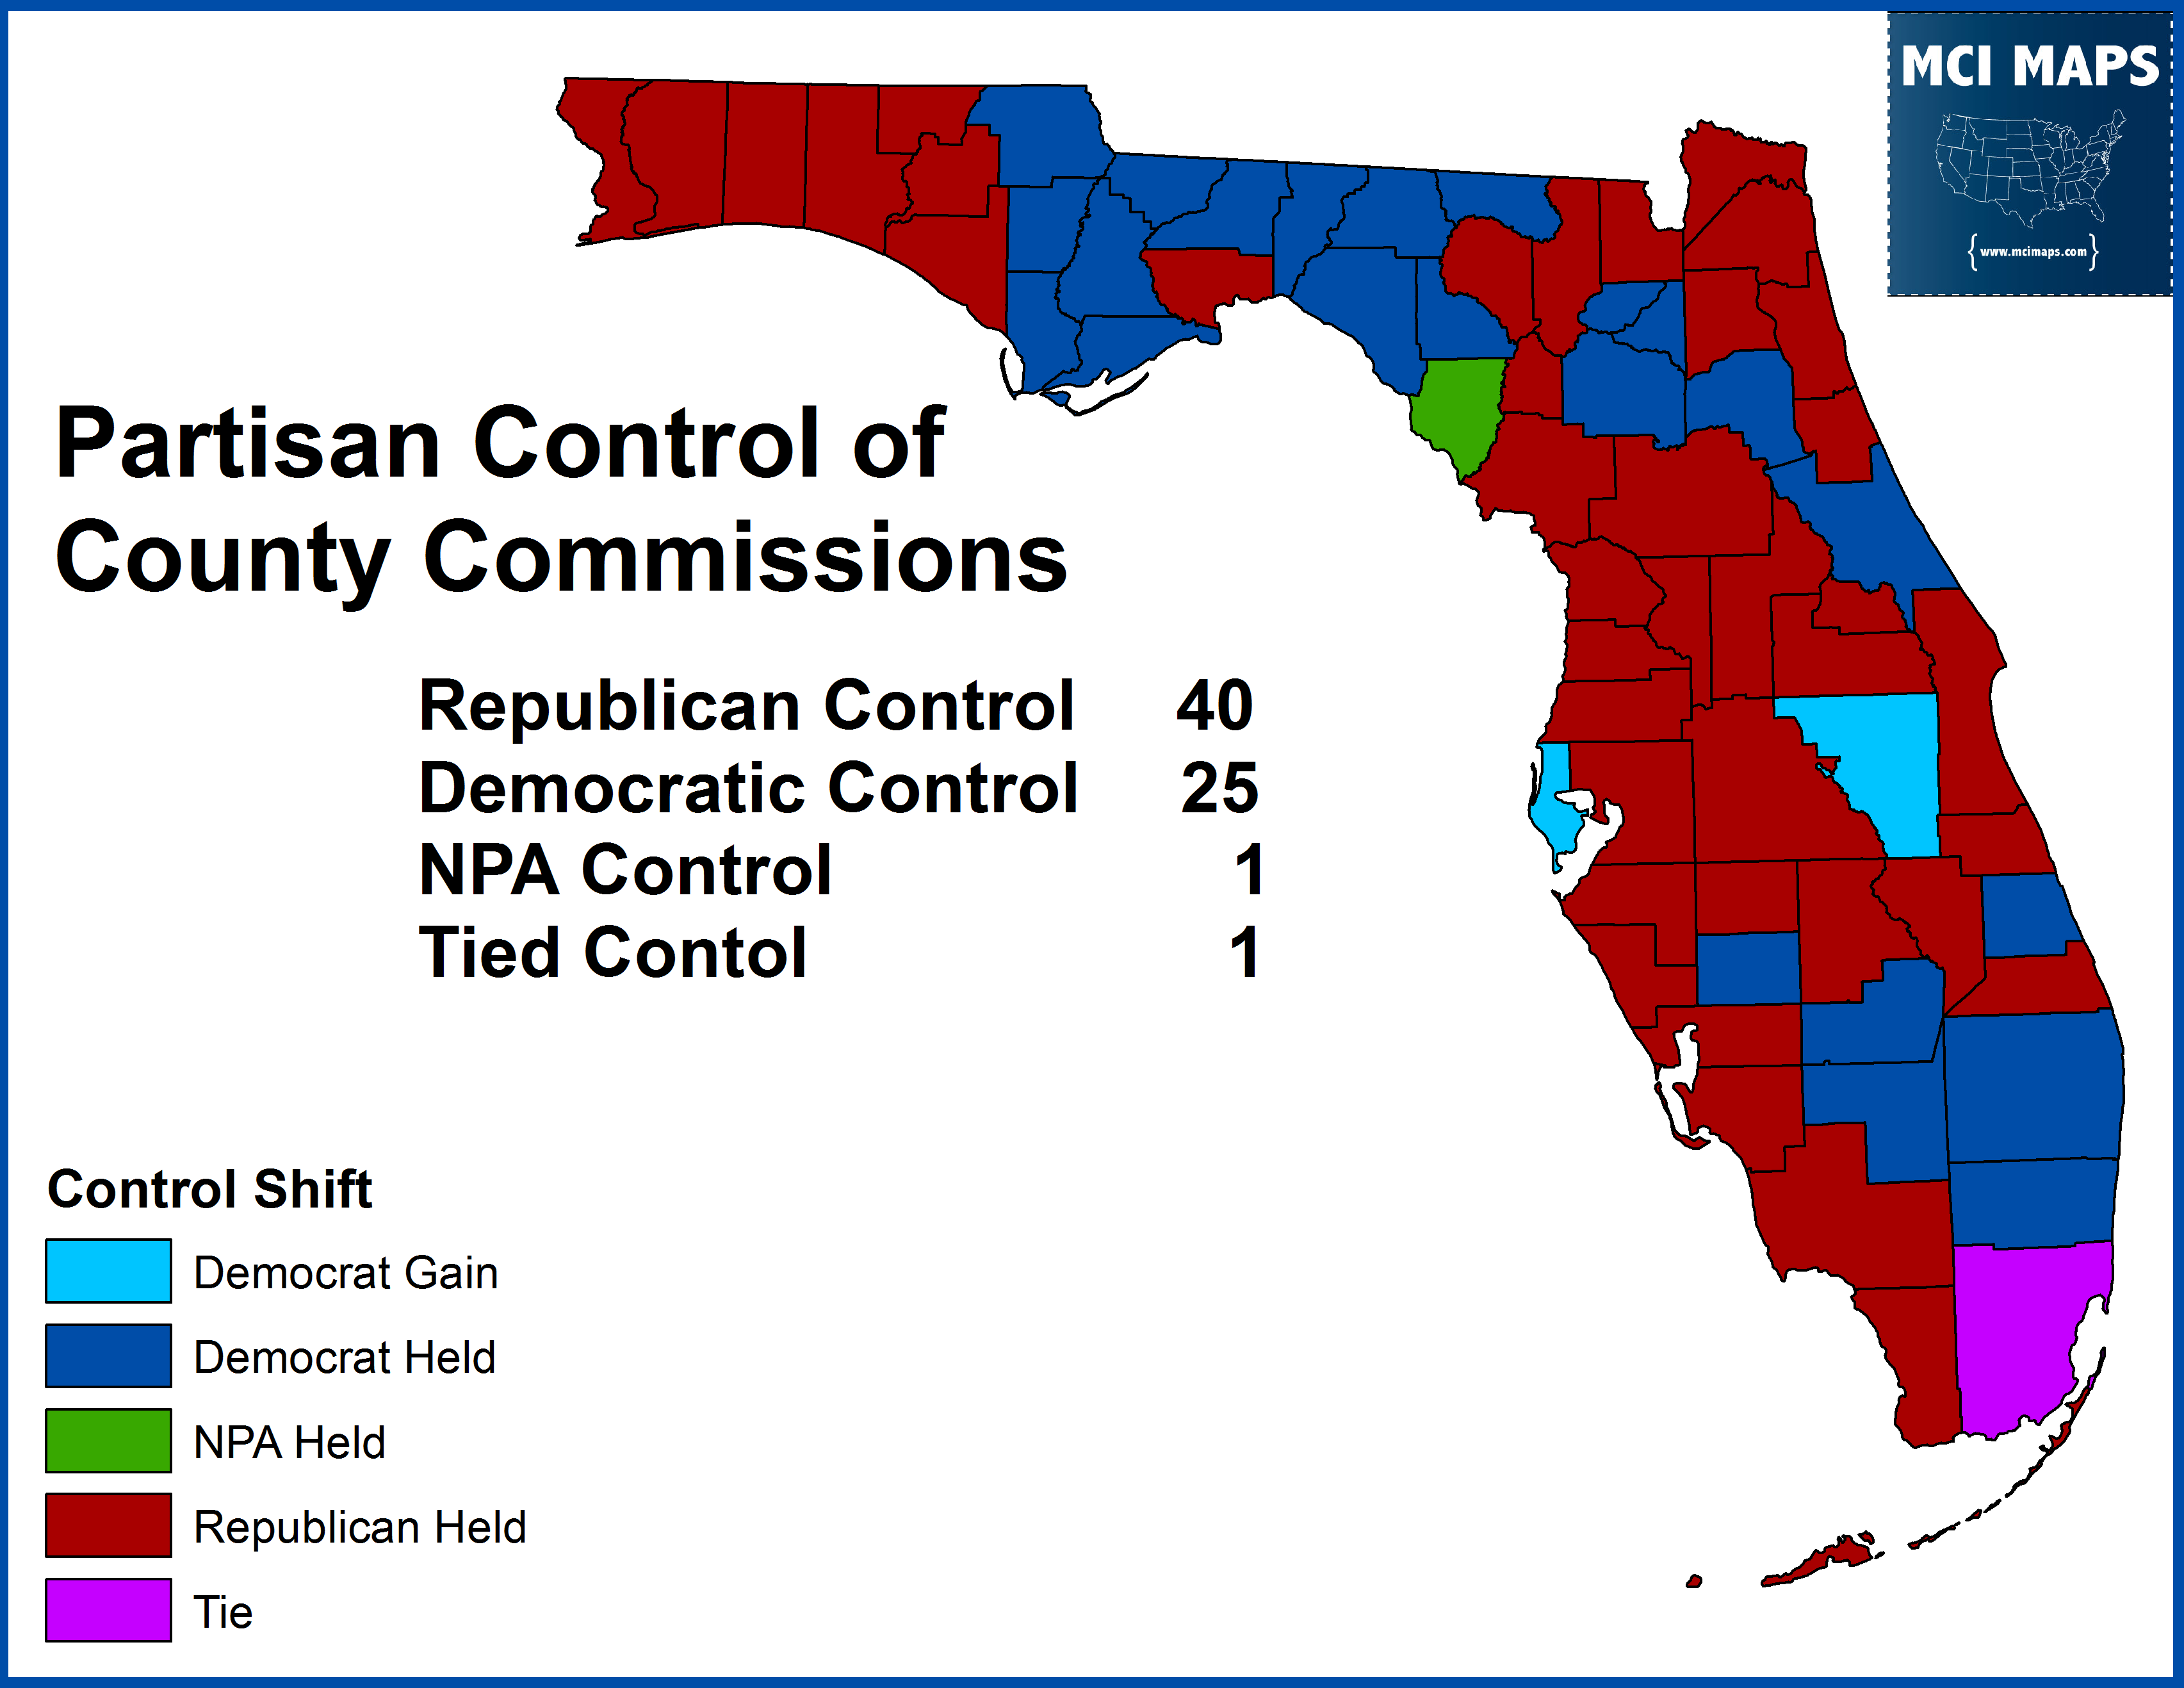
The gains and losses are visualized in the map below.
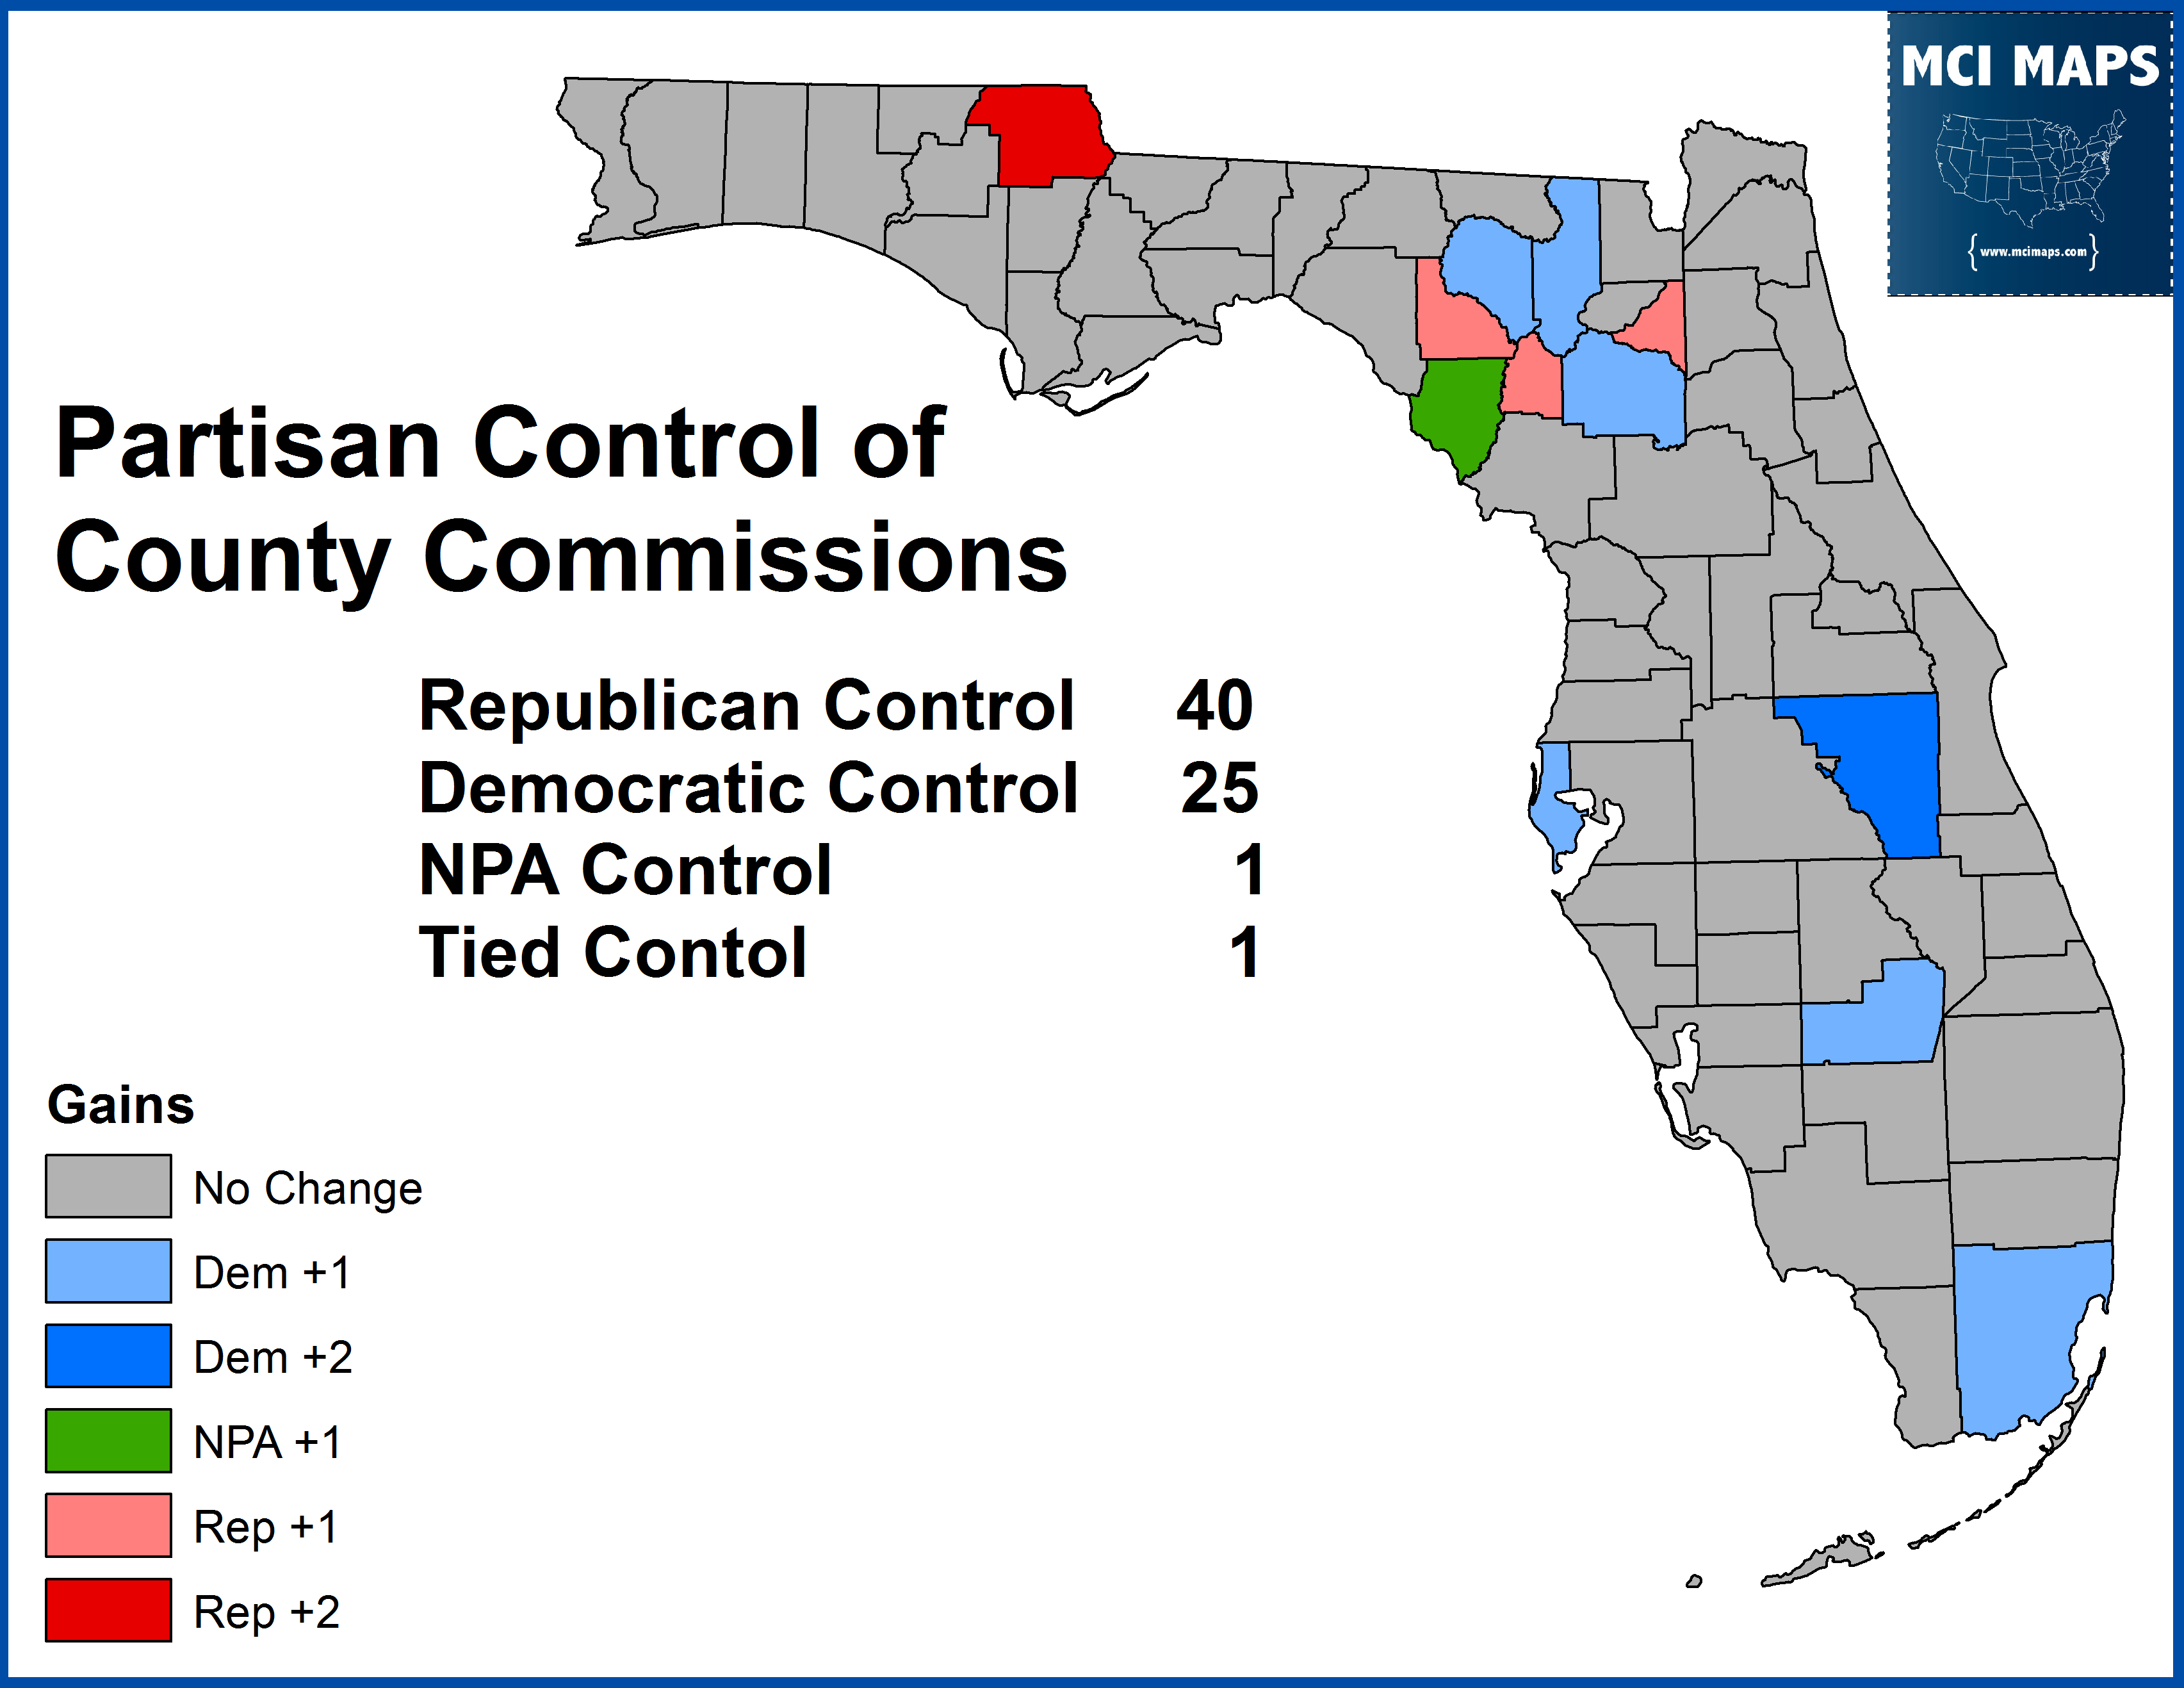
Democrats gained 8 seats while Republicans gained 5. On paper this means Democrats made a net gain of 3 commissioners. However, compared to where things stood after 2012, the math isn’t so simple. First, Republicans made a gain in Putnam county when Rick Scott appointed a Republican to a Democrat-held seat and that appointee was not challenged by a Democrat for November. This ended Putnam’s 5-0 Democratic commission. In addition, the Democratic gain in Glades was to take back another Rick Scott appointee from a previously dem-held seat; so the gain just reverted things back to pre-2014. This leaves Democrats with just one more seat than they held after 2012. However, the independent gain in Dixie county was a Democrat retreating from his party to run as an NPA candidate. That brings the increase in Democrats on the county commission to zero. However, that seat goes to an increase in NPA held districts. Unless I am missing any mid-cycle changes (possible considering there are alot of commissioners), the final party gains in terms of raw commissioners between 2012 and 2014 is
- Democrats <Even>
- Republicans -1
- NPAs +1
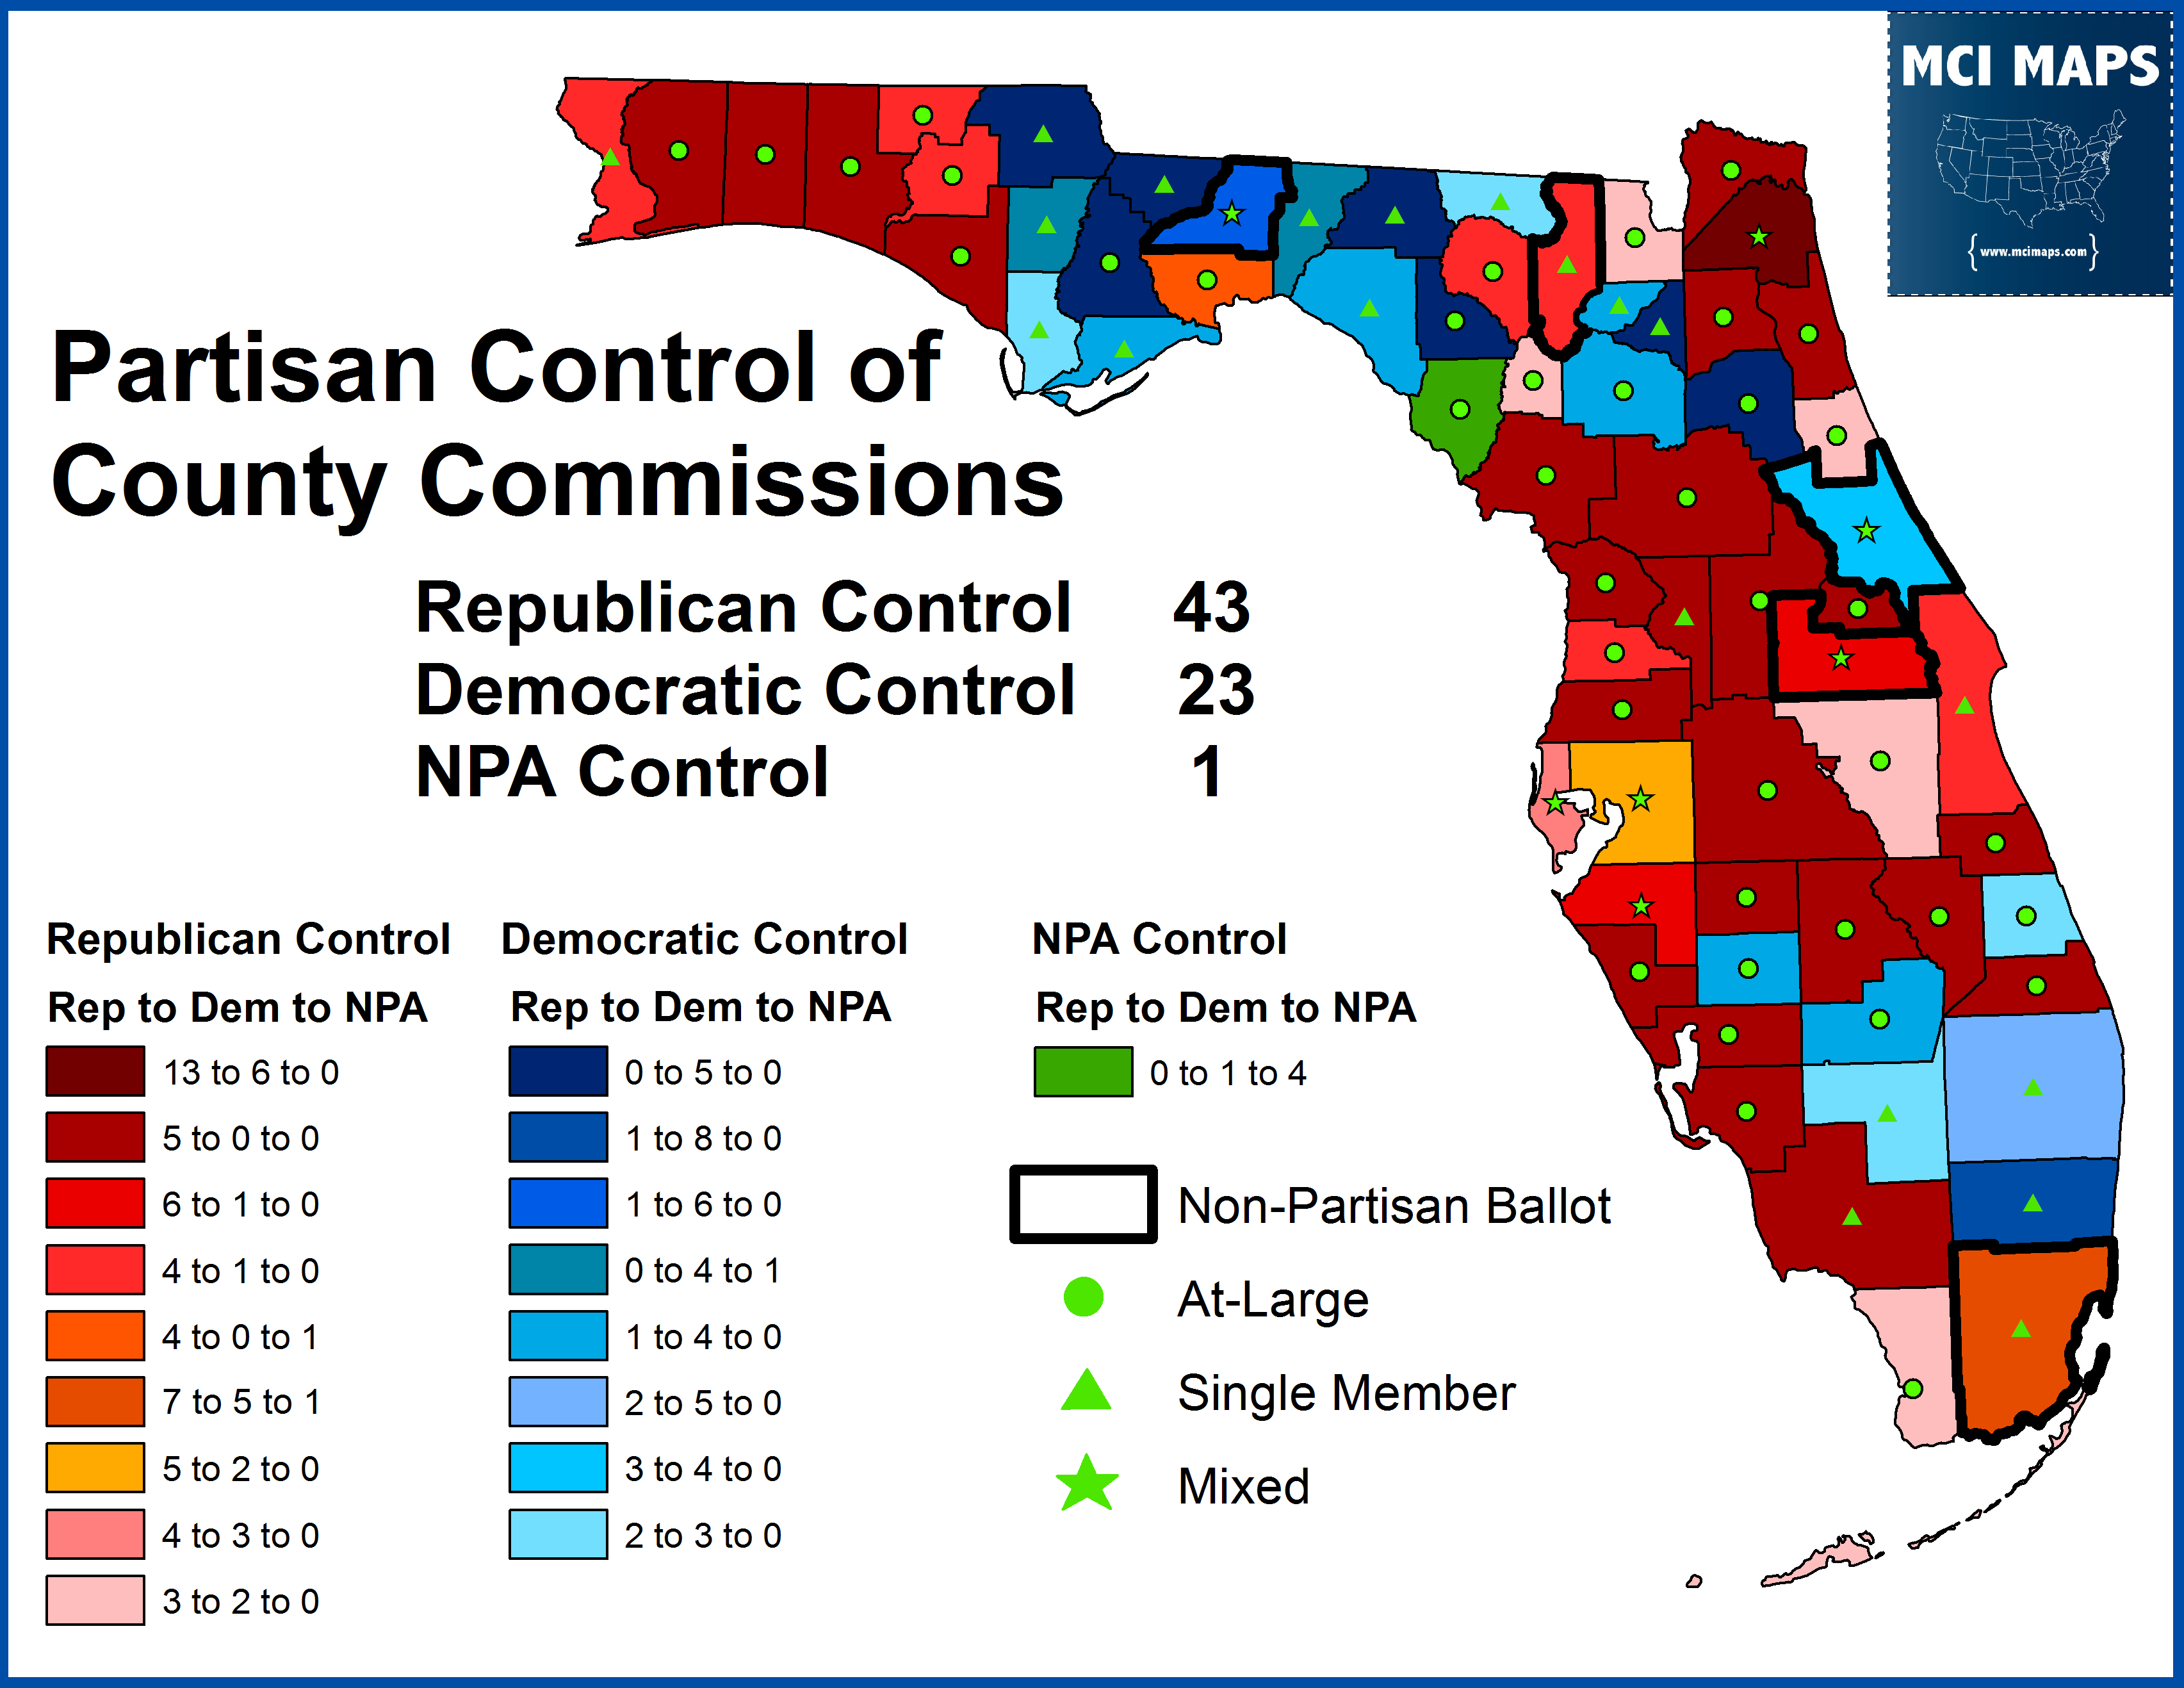
Final control of county commissioners can be seen in the map below.

Looking Ahead
Considering 2014 was such a bad year for Democrats across the board, the gains by Democrats in local office is a silver lining for the party. Democrats took control of two major counties in the state; Pinellas and Osceola. Democrats seizing control of all three at-large congressional seats in Pinellas over the last two years is especially notable and gives the party three prime candidates for David Jolly’s congressional seat. Meanwhile, many Democratic-held seats in North Florida did not fall to the GOP. However, Democrats suffering defeats in Jackson County may be a sign of future problems. In addition, failures by Democrats to pick up seats in Broward and Hillsborough continue to give the GOP a foothold in counties they should not have. That said, Democrats were the clear winner in the local elections of 2014. They gained control of commissioners and won critical and non-critical races. In many instances, local Democrats were closely tied to races going on at the top of the ballot. In other cases, Democrats outpaced or under-paced the top of the ballot. Indeed the results were contradictory. Some counties showed an amazing level of partisanship; yielding similar party results regardless of the race or circumstance. In other instances, Democrats could win or lose regardless of party fortunes further up the ballot. The urban elections such as Palm Beach 4 and Orange 2 showed a strong level of correlation between Democratic votes even if the Democrat lost. Meanwhile, the rural counties showed votes less tied together; with local dynamics mixing with national trends.
The notion that all politics is local is slowly giving way to increase nationalization of elections. However, several counties in 2014 showed that local circumstance can still beat out national trends. How long local Democrats and Republicans can hold off increased partisanship in the counties it has not already taken hold is something to watch in 2016 and beyond.